Autumn Lake Healthcare at Berkeley Heights
Nursing Home · Berkeley Heights, NJ
CMS overall rating Info The Overall CMS Rating is scored from 1 to 5 stars and combines results from health inspections, staffing levels, and quality measures. Health inspections carry the most weight. Staffing and quality scores can increase or decrease the final rating based on performance compared to state and national standards.

Autumn Lake Healthcare at Berkeley Heights

Nursing Home · Berkeley Heights, NJ
CMS overall rating Info The Overall CMS Rating is scored from 1 to 5 stars and combines results from health inspections, staffing levels, and quality measures. Health inspections carry the most weight. Staffing and quality scores can increase or decrease the final rating based on performance compared to state and national standards.
Calculator: See prices in your area
Autumn Lake Healthcare at Berkeley Heights accepts Medicaid, Medicare, and private pay.

Overview of Autumn Lake Healthcare at Berkeley Heights

Autumn Lake Healthcare at Berkeley Heights is an independent healthcare center situated in the scenic township of Berkeley Heights. As an award-winning and state-of-the-art nursing center, this skilled nursing community offers rehabilitation and long-term care services with 24/7 skilled nursing for various complex medical conditions.

Their commitment to providing top-notch care is reflected in their acceptance of Medicare, Medicaid, most insurances, and private pay. Autumn Lake Healthcare at Berkeley Heights takes pride in serving the community with heart and a dedication to excellence in healthcare.


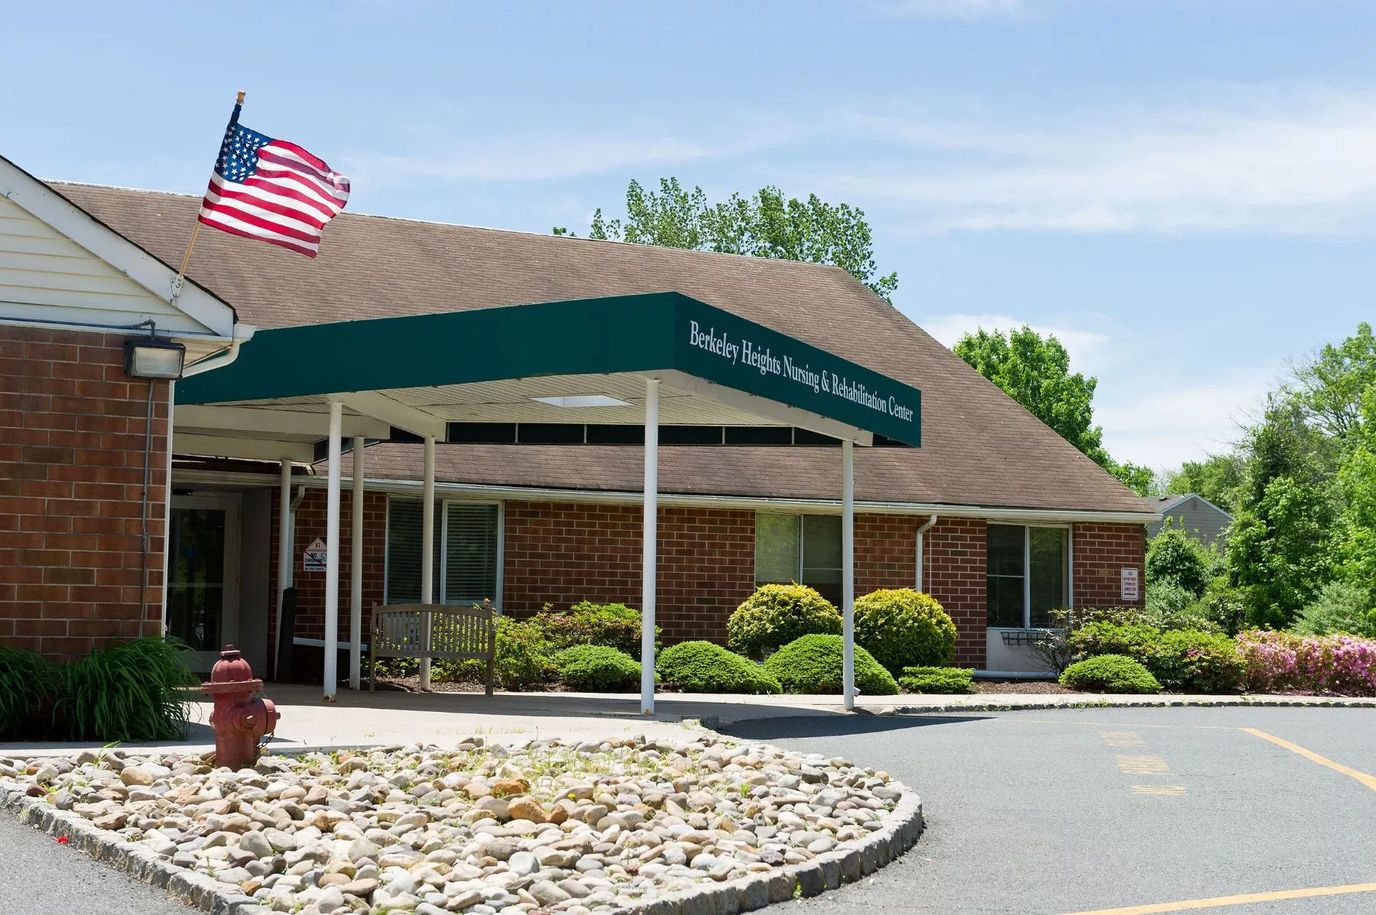
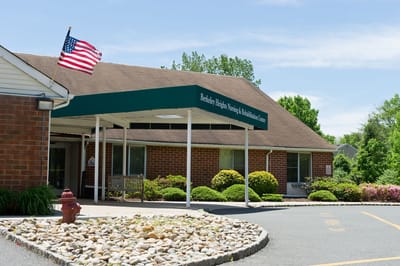
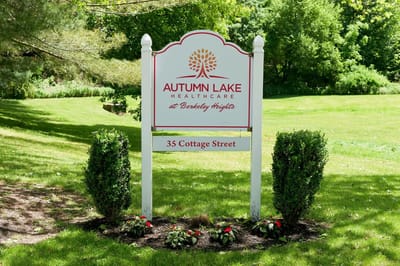
Autumn Lake  Healthcare at Berkeley Heights is an independently owned and operated healthcare center that is licensed to use the Autumn Lake Healthcare name and receive non-healthcare related services. All healthcare-related services are provided solely by Autumn Lake Healthcare at Berkeley Heights.

(908) 464-0048

Quality ratings

Measured by Centers for Medicare & Medicaid Services (CMS)

Overall rating Info The Overall CMS Rating combines results from health inspections, staffing levels and quality measures. Health inspections carry the most weight. Staffing and quality scores can increase or decrease the final rating based on performance compared to state and national standards.
▼ 41.5% Below NJ avg. ▼ 41.5% Below NJ avg.Click the badge to see the full State ranking.Click here to see the full State ranking.
Health Inspection Info Based on the results of the facility's three most recent standard inspections and any complaint investigations. CMS reviews the number, scope, and severity of deficiencies, with more recent findings weighted more heavily.
▼ 65.2% Below NJ avg. ▼ 65.2% Below NJ avg.Click the badge to see the full State ranking.Click here to see the full State ranking.
Staffing Info Measures average nursing staff hours per resident per day, including Registered Nurses (RNs) and total nursing staff. Ratings are adjusted based on the level of care residents require and are compared to state and national benchmarks.
▼ 35.5% Below NJ avg. ▼ 35.5% Below NJ avg.Click the badge to see the full State ranking.Click here to see the full State ranking.
Quality Measures Info Based on clinical and physical health indicators reported to CMS, such as hospital readmissions, falls, pressure ulcers, and improvements in mobility. These measures reflect how well residents' health needs are being managed.
▲ 13.6% Above NJ avg. ▲ 13.6% Above NJ avg.Click the badge to see the full State ranking.Click here to see the full State ranking.

Staffing hours breakdown

Info Daily nursing hours per resident by staff type, reported to CMS. Higher is generally better — compare this facility to state and national averages to see where staffing stands.

Hours per resident per day — compared to New Jersey state averages

Total nursing care / resident Info This home is ranked 104th out of 274 homes in New Jersey. Total adjusted nursing hours per resident per day, combining RN, LPN, and aide time. CMS adjusts this for case-mix so facilities can be fairly compared.
3h 50m per day
Rank #104 / 274Nurse hours — State benchmarkedThis home is ranked 104th out of 274 homes in New Jersey. Shows adjusted nurse hours per resident per day benchmarked to the New Jersey average, with a ranking across 274 New Jersey SNFs. More hours mean more direct care. The national average is about 3.5 hrs; below 3.0 is a red flag.Click the rank badge to see the full State ranking.Click here to see the full State ranking.
This facility New Jersey avg (3h 55m per day)
vs New Jersey avg
-2%

3 of 6 metrics below state avg

Standout metric Physical Therapist is +17% above state avg
Staff typeHours / Day / Residentvs state avg
Registered Nurse (RN) Info RNs hold the highest nursing license and can assess residents, interpret test results, and direct care plans. More RN hours per day often signals stronger clinical oversight and faster response to health changes. 24m per day ▼ 41% State avg: 41m per day · National avg: 41m per day
LPN / LVN Info Licensed Practical Nurses (LPNs) or Licensed Vocational Nurses (LVNs) deliver routine hands-on care — medication administration, wound dressing, and monitoring vital signs. They work under RN supervision and make up a large share of daily bedside care. 55m per day ■ Avg State avg: 56m per day · National avg: 52m per day
Nurse Aide Info Certified Nurse Aides (CNAs) provide the most direct day-to-day assistance: bathing, dressing, feeding, and mobility. Nurse aide hours are typically the largest staffing category and directly affect residents' quality of life. 2h 16m per day ■ Avg State avg: 2h 14m per day · National avg: 2h 21m per day
Weekend Total Nursing Info Combined nursing hours (RN + LPN + Nurse Aide) per resident per day on weekends. Staffing often drops on weekends — this figure reveals whether the facility maintains adequate coverage outside of weekday hours. 3h 20m per day ▼ 3% State avg: 3h 27m per day · National avg: 3h 26m per day
Physical Therapist Info Hours per resident per day provided by licensed Physical Therapists (PTs) or PT Assistants. PT services help residents recover mobility after injury or illness and are especially important for post-acute (short-stay) rehabilitation. 7m per day ▲ 17% State avg: 6m per day · National avg: 4m per day
Weekend RN Info Registered nurse hours specifically on weekends. Facilities sometimes reduce RN presence on Saturdays and Sundays — a low weekend RN figure compared to weekday hours can indicate reduced clinical oversight when most administrative staff are absent. 15m per day ▼ 48% State avg: 29m per day · National avg: 29m per day

Capacity and availability

Avg. Length of Stay
114 days
Bed community size
130-bed community Rank #136 / 277Bed count — State benchmarkedThis home is ranked 136th out of 277 homes in New Jersey. Shows this facility's certified or reported bed count compared to other New Jersey SNFs. Larger communities may offer more amenities, programs, and on-site services for residents and families.Click the rank badge to see the full State ranking.Click here to see the full State ranking.
A larger shared setting that may offer more common spaces and organized community services.
Walk Score
Walk Score: 50 / 100 Rank #139 / 277Walk Score — State benchmarkedThis home is ranked 139th out of 277 homes in New Jersey. Shows how walkable this facility's neighborhood is compared to the average Walk Score across New Jersey SNFs. Higher scores benefit residents, families, and staff.Click the rank badge to see the full State ranking.Click here to see the full State ranking.
Moderately walkable. Some errands can be accomplished on foot, with a mix of nearby amenities.

About this community

Occupancy

Occupancy rate
75%
Rank #194 / 276Occupancy rate — State benchmarkedThis home is ranked 194th out of 276 homes in New Jersey. Shows this facility's occupancy rate versus the New Jersey average, with its Statewide rank out of 276. Higher occupancy signals strong local demand and financial stability.Click the rank badge to see the full State ranking.Click here to see the full State ranking.
Similar to the New Jersey average: 77%
Occupied beds
97 / 130
Average residents per home in New Jersey 119 per day

License Details

Facility TypeLong Term Care Facility
StatusActive
ExpirationMay 31, 2026
License Number62016
CMS Certification Number315195

Ownership & Operating Entity

Autumn Lake Healthcare at Berkeley Heights is legally operated by Bheights Associates, Llc, and administrated by Shimon Sitzer.

Officers

Info Officers are individuals or entities with formal legal or financial responsibility for the organization that owns this facility

Mjh Group, LLC, Aryeh Stern, Mr . David Gluck, Morris Meisels, Mr . Samuel Handler

Type Of Units

Long Term Care
130 units
Total beds
130 units

Payment & Insurance

2 services
Accept Medicaid
Accept Medicare

Therapy & Rehabilitation

2 services
Rehabilitation Services
Short-Term Rehab

Additional Services

1 service
Sub-Acute Rehabilitation

Amenities & Lifestyle

Specific ProgramsPreparing for your stay, Info for families, Good times

Contact Autumn Lake Healthcare at Berkeley Heights

Inspection History

In New Jersey, the Department of Health, Health Facilities Evaluation and Licensing conducts mandatory unannounced surveys to ensure facilities provide safe and effective resident care.

Inspection Scorecard Info This scorecard compares key inspection, citation, and complaint metrics at this facility against the New Jersey state average. Metrics rated ≥15% worse than average are highlighted in red; those ≥15% better are highlighted in green.

Since 2022 vs. New Jersey state average
Overall vs. NJ average 3 Worse Metrics worse than New Jersey average:
• Total deficiencies (100% above)
• Deficiencies per year (100% above)
• Deficiencies per inspection (100% above)
1 At Avg Metrics at New Jersey average:
• Total inspections (at NJ avg)
1 Better Metrics better than New Jersey average:
• Complaint investigations (67% below)
Latest Inspection November 20, 2025

Deficiencies Info Deficiencies are formal regulatory issues recorded during state inspections.

This FacilityNJ Averagevs. NJ Avg
Total deficiencies Info Formal regulatory issues recorded by inspectors across all inspection types. 3618 This facility has 100% more total deficiencies than a typical New Jersey nursing home (36 vs. NJ avg 18).↑ 100% worse
Deficiencies per year Info Average deficiencies per year since 2022. 94.5 This facility has 100% more deficiencies per year than a typical New Jersey nursing home (9 vs. NJ avg 4.5).↑ 100% worse
Deficiencies per inspection Info Average deficiencies per inspection. 42 This facility has 100% more deficiencies per inspection than a typical New Jersey nursing home (4 vs. NJ avg 2).↑ 100% worse

Inspections Info State inspections evaluate whether the facility meets health and safety standards.

This FacilityNJ Averagevs. NJ Avg
Total inspections Info Combined count of all routine and focused inspections. Excludes complaint investigations. 99 This facility has total inspections in line with the New Jersey average (9 vs. NJ avg 9).— At avg
Complaint investigations Info On-site investigations triggered by complaints filed with New Jersey regulators. 13 This facility has 67% fewer complaint investigations than a typical New Jersey nursing home (1 vs. NJ avg 3).↓ 67% better

Inspection Reports Summary Info An editor-reviewed summary of the themes and findings across this facility's recent inspection reports.

The most recent inspection on November 18, 2025, identified deficiencies related to inaccurate completion of Minimum Data Set assessments and inconsistent monitoring of wander guard systems. Earlier inspections showed a mixed pattern, with prior reports citing issues in resident care such as abuse investigations, incontinence care, medication administration, staffing ratios, infection control, and life safety code compliance. Complaint investigations substantiated failures in abuse investigations, personal hygiene care, and medication management, but fines or enforcement actions were not listed in the available reports. Staffing shortages and training gaps were recurring themes, along with documentation and safety system monitoring. The facility’s record shows some ongoing challenges, though the most recent inspection did not indicate new types of deficiencies beyond assessment and monitoring issues.

Read the full inspection reports for this facility, including detailed findings and corrective actions.

Show Inspection Reports

Health Inspection History

Inspections since 2020
Total health inspections 4

New Jersey average 4


Last Health inspection on Feb 2025

Total health citations
22 Rank #163 / 276Health citations — State benchmarkedThis home is ranked 163rd out of 276 homes in New Jersey. Shows this facility's total health deficiency citations benchmarked to the New Jersey State average, with a ranking across all 276 NJ SNFs. Lower citation counts earn a better rank.Click the rank badge to see the full State ranking.Click here to see the full State ranking.

New Jersey average 20.9

Citations per inspection
5.5 Rank #164 / 276Citations per inspection — State benchmarkedThis home is ranked 164th out of 276 homes in New Jersey. Shows average deficiency citations per CMS inspection for this facility versus the New Jersey mean across 276 SNFs with citation data. Lower is better.Click the rank badge to see the full State ranking.Click here to see the full State ranking.

New Jersey average 5.35


Health citations are formal notices following inspections when they fail to comply with safety and care standards.

18 of 22 citations resulted from standard inspections; 1 of 22 resulted from complaint investigations; and 3 of 22 came from combined inspections (standard and complaint).

Breakdown of citation severity (last 6 years)
Critical Health citations
0
100% better than New Jersey average

New Jersey average: 0.7


Serious Health citations
1 Rank #1 / 76Serious citations (G–I) — State benchmarkedThis home is ranked 1st out of 76 homes in New Jersey. Shows G–I scope serious health citations for this facility versus other New Jersey SNFs. Lower counts rank better.Click the rank badge to see the full State ranking.Click here to see the full State ranking.
150% worse than New Jersey average

New Jersey average: 0.4

0 critical citations New Jersey average: 0.7

1 serious citation New Jersey average: 0.4

21 moderate citations New Jersey average: 19.3

0 minor citations New Jersey average: 0.5
Citations history (last 6 years)
Infection Control moderate citation Feb 10, 2025
Corrected

Abuse/Neglect moderate citation Jul 19, 2024
Corrected

Administration moderate citation Jul 19, 2024
Corrected

Infection Control moderate citation Jul 19, 2024
Corrected

Staffing Data

Reporting period: October 1 – December 31, 2025 (Q4 2025). Source: CMS Payroll-Based Journal report.

Total staff 244
Employees 80
Contractors 164
Staff to resident ratio 2.52:1
42% better than New Jersey average
New Jersey average ratio: 1.77:1 New Jersey average ratio: 1.77:1See full New Jersey ranking
Avg staff/day 58
Average shift 7.7 hours
0% compared with New Jersey average
New Jersey average: 8 hours New Jersey average shift: 8 hoursSee full New Jersey ranking
Total staff hours (quarter) 41,020

Nursing staff breakdown

Q4 2025 · Oct 1 – Dec 31 More info This data comes from the CMS Payroll-Based Journal report covering October 1 – December 31, 2025.
Registered Nurse

Manages medical care and health needs.

RN Staff 9
Average shift length Info Average shift length. Calculated as total hours divided by days worked and average staff per day. 6.9 hours

No contractors work on this role.

Licensed Practical Nurse

Assists with medical care and medications.

LPN Staff 76
Average shift length Info Average shift length. Calculated as total hours divided by days worked and average staff per day. 7.9 hours

This role is partially covered by contractors.

Certified Nursing Assistant

Helps with daily care and mobility.

CNA Staff 131
Average shift length Info Average shift length. Calculated as total hours divided by days worked and average staff per day. 7.7 hours

This role is partially covered by contractors.

Contractor staffing

Q4 2025 · Oct 1 – Dec 31 More info This data comes from the CMS Payroll-Based Journal report covering October 1 – December 31, 2025.

Total hours from contractors

27.2%

11,164 contractor hours this quarter

Certified Nursing Assistant: 93 Licensed Practical Nurse: 58 Respiratory Therapy Technician: 3 Speech Language Pathologist: 3 Physical Therapy Assistant: 3 Physical Therapy Aide: 2 Qualified Social Worker: 2

Staff by category

Q4 2025 · Oct 1 – Dec 31 More info This data comes from the CMS Payroll-Based Journal report covering October 1 – December 31, 2025.
Certified Nursing Assistant389313121,97792100%7.7
Licensed Practical Nurse1858768,33192100%7.9
Registered Nurse9092,6079199%6.9
Other Dietary Services Staff4041,19092100%7
Clinical Nurse Specialist4041,1046470%8.1
Dietitian2029888087%8
Respiratory Therapy Technician0339397784%6.6
RN Director of Nursing2027686470%8
Qualified Social Worker0225026368%7.7
Physical Therapy Assistant0334916267%7.1
Speech Language Pathologist0334866470%5.6
Mental Health Service Worker1014736368%7.5
Physical Therapy Aide0224446065%7.4
Administrator1013844852%8
Dental Services Staff1013384650%7.3
131 Certified Nursing Assistant
% of Days 100%
76 Licensed Practical Nurse
% of Days 100%
9 Registered Nurse
% of Days 99%
4 Other Dietary Services Staff
% of Days 100%
4 Clinical Nurse Specialist
% of Days 70%
2 Dietitian
% of Days 87%
3 Respiratory Therapy Technician
% of Days 84%
2 RN Director of Nursing
% of Days 70%
2 Qualified Social Worker
% of Days 68%
3 Physical Therapy Assistant
% of Days 67%
3 Speech Language Pathologist
% of Days 70%
1 Mental Health Service Worker
% of Days 68%
2 Physical Therapy Aide
% of Days 65%
1 Administrator
% of Days 52%
1 Dental Services Staff
% of Days 50%

Penalties and fines

Includes penalties issued in 2024

Federal penalties imposed by CMS for regulatory violations, including civil money penalties (fines) and denials of payment for new Medicare/Medicaid admissions.

Source: CMS Penalties Database (Data as of Jan 2026)

Total fines amount $103K Rank #245 / 276Federal fines — State benchmarkedThis home is ranked 245th out of 276 homes in New Jersey. Shows this facility's cumulative CMS federal fine dollars versus the New Jersey average among facilities with fines, and where it ranks among 276 skilled nursing facilities in the pool. Lower total dollars mean a better rank.Click the rank badge to see the full State ranking.Click here to see the full State ranking.
33% higher than New Jersey average

New Jersey average: $77K

Number of fines 1
50% fewer fines than New Jersey average

New Jersey average: 2.0

Payment Denials Info Serious action where Medicare and/or Medicaid temporarily stops payments for new residents until issues are fixed. 0
100% fewer payment denials than New Jersey average

New Jersey average: 0.1

Fines amount comparison
This facility $103K
New Jersey average $77K
Penalty History

Penalties are imposed by CMS for violations of federal nursing home regulations.

1 penalty in the past 3 years

Jul 19, 2024 · $103K

Civil Money Penalty Info Fines imposed for noncompliance, which can be assessed per day or per instance of violation. Jul 19, 2024
$103K

Last updated: Jan 2026

Quality of care over time

These measures show how residents usually do over time at this home, based on health outcomes and preventive care.

High-risk clinical events score Info A composite score based on pressure ulcers, falls with injury, weight loss, walking ability decline, and activities of daily living decline. 4.6
32% better than New Jersey average

New Jersey average: 6.8

Functional decline score Info A composite score based on activities of daily living decline, walking ability decline, and incontinence. 9.6
23% better than New Jersey average

New Jersey average: 12.4

Long-stay resident measures
Significantly above average New Jersey avg: 4.5 Info CMS star rating based on long-stay quality measure performance. 5 stars = significantly above average, 1 star = significantly below average.
Need for Help with Daily Activities Increased Info Percent of long-stay residents whose need for help with daily activities has increased 9.8%
In line with New Jersey average

New Jersey average: 10.1%

Walking Ability Worsened Info Percent of long-stay residents whose ability to move independently worsened 4.9%
56% better than New Jersey average

New Jersey average: 11.0%

Low Risk Residents with Bowel/Bladder Incontinence Info Percent of low risk long-stay residents who lose control of their bowels or bladder 14.0%
12% better than New Jersey average

New Jersey average: 16.0%

Falls with Major Injury Info Percent of long-stay residents experiencing one or more falls with major injury 1.3%
47% better than New Jersey average

New Jersey average: 2.4%

High Risk Residents with Pressure Ulcers Info Percent of long-stay high risk residents with pressure ulcers 5.0%
17% better than New Jersey average

New Jersey average: 6.1%

Urinary Tract Infection Info Percent of long-stay residents with a urinary tract infection 0.0%
100% better than New Jersey average

New Jersey average: 1.0%

Lost Too Much Weight Info Percent of long-stay residents who lose too much weight 2.2%
54% better than New Jersey average

New Jersey average: 4.6%

Depressive Symptoms Info Percent of long-stay residents who have depressive symptoms 2.8%
75% better than New Jersey average

New Jersey average: 11.3%

Antipsychotic Use Info Percent of long-stay residents who received an antipsychotic medication 13.9%
26% worse than New Jersey average

New Jersey average: 11.1%

Pneumococcal Vaccine Info Percent of long-stay residents assessed and appropriately given the pneumococcal vaccine 100.0%
8% better than New Jersey average

New Jersey average: 93.0%

Influenza Vaccine Info Percent of long-stay residents assessed and appropriately given the seasonal influenza vaccine 100.0%
In line with New Jersey average

New Jersey average: 97.2%

Hospitalizations per 1,000 days Info Number of hospitalizations per 1,000 long-stay resident days. 1.40
33% better than New Jersey average

New Jersey average: 2.08

ED visits per 1,000 days Info Number of outpatient emergency department visits per 1,000 long-stay resident days. 0.26
77% better than New Jersey average

New Jersey average: 1.12

Short-stay resident measures
Significantly above average New Jersey avg: 3.8 Info CMS star rating based on short-stay quality measure performance. 5 stars = much above average, 1 star = much below average.
Pneumococcal Vaccine Info Percent of short-stay residents assessed and appropriately given the pneumococcal vaccine 100.0%
27% better than New Jersey average

New Jersey average: 78.9%

Antipsychotic medication increase Info Percent of short-stay residents who newly received an antipsychotic medication 0.4%
63% better than New Jersey average

New Jersey average: 1.2%

Influenza Vaccine Info Percent of short-stay residents assessed and appropriately given the seasonal influenza vaccine 99.5%
24% better than New Jersey average

New Jersey average: 80.1%

Re-hospitalized after SNF stay Info Percentage of short-stay residents who were re-hospitalized after their nursing home admission. 30.0%
18% worse than New Jersey average

New Jersey average: 25.4%

Emergency department visits Info Percentage of short-stay residents who had an outpatient emergency department visit. 7.0%
15% better than New Jersey average

New Jersey average: 8.2%

Falls with major injury Info Percentage of SNF residents who experience falls with major injury during their stay. 0.5%
34% better than New Jersey average

New Jersey average: 0.8%

Ability to care for self at discharge Info Percentage of residents at or above expected ability to care for themselves at discharge. 42.3%
21% worse than New Jersey average

New Jersey average: 53.7%

Successful return to home or community Info Rate of successful return to home or community from a skilled nursing facility. 64.8%
28% better than New Jersey average

New Jersey average: 50.6%

Breakdown by payment type

Medicare

52% of new residents, usually for short-term rehab.

Typical stay 23 days

Private pay

37% of new residents, often for short stays.

Typical stay 2 - 3 months

Medicaid

11% of new residents, often for long-term daily care.

Typical stay 1 - 2 years

Facility Characteristics

Source: CMS Long-Term Care Facility Characteristics (Data as of Jan 2026)

Total residents 97
Medicare
11
11.3% of residents
Medicaid
61
62.9% of residents
Private pay or other
25
25.8% of residents
Programs & Services
Residents Group

Residents meet regularly to discuss policies, care quality, and activities

Active Resident Council

Organized group of residents that meets regularly to discuss facility policies, quality of life, and activities.

Finances and operations

Privately-owned community
Operated by a business corporation.
Home revenue
$12.5M
Operating loss
-$1.2M
Privately-owned community Operated by a business corporation.
Home revenue
$12.5M Rank #221 / 272Revenue — State benchmarkedThis home is ranked 221st out of 272 homes in New Jersey. Shows this facility's annual revenue compared to the New Jersey SNF average. Higher revenue generally means more resources for staffing and capital — read alongside Payroll %.Click the rank badge to see the full State ranking.Click here to see the full State ranking.
Operating loss
-$1.2M
Payroll costs Info The portion of the home's budget spent on staff, including nurses, caregivers, and other employees who support care and operations. Rank #194 / 272Payroll — State benchmarkedThis home is ranked 194th out of 272 homes in New Jersey. Shows total annual staff payroll benchmarked to the New Jersey average. Higher payroll investment relative to peers often signals better staffing and less reliance on cheaper contract labor.Click the rank badge to see the full State ranking.Click here to see the full State ranking.
$7.4M
59.3% of revenue Rank #42 / 272Payroll % — State benchmarkedThis home is ranked 42nd out of 272 homes in New Jersey. Shows payroll as a percentage of revenue versus the New Jersey average. Well-run New Jersey SNFs typically land around 55–65% — the top third Statewide. Below 25% may signal understaffing or heavy agency use — read with Staffing ratings.Click the rank badge to see the full State ranking.Click here to see the full State ranking.
Other operating costs Info All remaining costs needed to run the home, such as food, utilities, building maintenance, supplies and administrative expenses.
$6.3M
Total costs $13.7M

Who this home usually serves

TYPE OF STAY

Mostly short-term rehab stays

Most residents typically stay for a few weeks or months before returning home or moving on.

Places of interest near Autumn Lake Healthcare at Berkeley Heights

Address 0.9 miles from city center Info Estimated distance in miles from Berkeley Heights's city center to Autumn Lake Healthcare at Berkeley Heights's address, calculated via Google Maps. — 4.92 miles to nearest hospital (Overlook Medical Center)

Calculate Travel Distance to Autumn Lake Healthcare at Berkeley Heights

Add your location

Address

Financial Assistance for
Nursing Home in New Jersey

Autumn Lake Healthcare at Berkeley Heights is located in Berkeley Heights, New Jersey.
Here are the financial assistance programs available to residents in New Jersey.

Get Financial aid guidance

Managed Long Term Services and Supports

NJ Medicaid MLTSS

Age 65+ or disabled
General New Jersey resident, Medicaid- eligible, nursing home-level care need.
Income Limits (2025) ~$2,829/month 300% FBR, individual
Asset Limits $2,000 (individual), $3,000 (couple).
NJ

High urban demand; managed care model.

Benefits
In-home care (5-7 hours/day) Assisted living Respite (240 hours/year) Medical services

JACC (Jersey Assistance for Community Caregiving)

NJ JACC

Age 60+
General New Jersey resident, at risk of nursing home.
Income Limits ~$2,500/month individual, varies
Asset Limits $40,000 individual
NJ

Higher asset limit; limited funding.

Benefits
In-home care (3-5 hours/week) Respite (up to 10 days/year) Home modifications (~$1,000 avg.)

Pharmaceutical Assistance to the Aged and Disabled (PAAD)

New Jersey PAAD

Age 65+
General NJ resident, enrolled in Medicare Part D or eligible.
Income Limits (2025) ~$42,142/year (individual), ~$49,209/year (couple).
Asset Limits Not assessed.
NJ

Copays $5 (generic), $7 (brand); covers Part D premiums up to benchmark.

Benefits
Prescription cost reduction ($500-$1,000/year savings) Premium assistance ($20/month above benchmark)

Senior Gold Prescription Discount Program

New Jersey Senior Gold

Age 65+
General NJ resident, enrolled in Medicare Part D or eligible.
Income Limits (2025) ~$42,142-$52,142/year (individual), ~$49,209-$59,209/year (couple).
Asset Limits Not assessed.
NJ

Copays $15 + 50% of remaining cost; no premium assistance.

Benefits
Prescription cost reduction (~$300-$800/year savings)

Medicare Savings Program (MSP)

New Jersey Medicare Savings Program

Age 65+ or disabled
General NJ resident, Medicare Part A/B.
Income Limits (2025) ~$2,510/month (QMB), ~$3,380/month (SLMB), ~$3,598/month (QI)—individual.
Asset Limits $9,430 (individual), $14,130 (couple).
NJ

Three tiers; no waitlist; includes Extra Help for Part D.

Benefits
Covers Part B premiums ($174.70/month) Deductibles ($240/year) Copays (~20%)

Senior Freeze (Property Tax Reimbursement)

New Jersey Senior Freeze

Age 65+ by Dec 31 prior year
General NJ resident, homeowner, paid property taxes.
Income Limits (2025) ~$150,000/year combined household, projected
Asset Limits Not assessed; home ownership required.
NJ

Combines with ANCHOR/Stay NJ via PAS-1; annual application.

Benefits
Tax reimbursement (~$500-$2,000/year) for increases since base year

ANCHOR (Affordable NJ Communities for Homeowners and Renters)

New Jersey ANCHOR

Age 65+ prioritized
General NJ resident, homeowner/renter, paid property taxes/rent.
Income Limits (2025) ~$150,000/year (homeowners), ~$75,000/year (renters).
Asset Limits Not assessed.
NJ

Combines with Senior Freeze/Stay NJ; broader than prior Homestead program.

Benefits
Tax relief (~$700-$1,500/year homeowners, ~$250-$450 renters)

Stay NJ

New Jersey Stay NJ

Age 65+ by Dec 31 prior year
General NJ resident, homeowner, lived in home 10+ years.
Income Limits (2025) ~$500,000/year projected, subject to final regs
Asset Limits Not assessed; home ownership required.
NJ

Up to 50% tax credit (max $6,500); phased implementation.

Benefits
Tax credit (~$3,000-$6,500/year, projected) starting 2026

Universal Service Fund (USF)

New Jersey Universal Service Fund

Age 65+ prioritized
General NJ resident, utility customer, low-income.
Income Limits (2025) ~$3,970/month individual, 185% FPL
Asset Limits Not assessed; income-focused.
NJ

Must owe >$25 on bill; combines with LIHEAP if eligible.

Benefits
Bill credits (~$300-$1,500/year) to cap energy costs at 6% of income

NJ Family Caregiver Support Program (via NFCSP)

New Jersey Family Caregiver Support Program

Age
General Caregivers of 60+ needing care or 55+ caregivers of others; NJ resident; functional needs (2+ ADLs).
Income Limits (2025) Prioritizes ~$24,980/year (individual); no strict cap.
Asset Limits Not assessed; need-based.
NJ

21 AAAs; rural/low-income priority.

Benefits
Respite (4-6 hours/week or 5 days/year) Adult day care ($60/day) Training Supplies (~$500/year)

VA Aid and Attendance (A&A) and Housebound Benefits

New Jersey VA Aid and Attendance/Housebound

Age 65+ or disabled veteran/spouse
General NJ resident, wartime service, need for ADL help (A&A) or homebound.
Income Limits (2025) Net income < ~$1,984/month (veteran with dependent, A&A); pension offsets income.
Asset Limits ~$155,356 net worth limit
NJ

High veteran demand in urban/rural areas.

Benefits
Cash (~$1,433-$2,642/month veteran, ~$951-$1,318 spouse) for care costs (e.g., in-home, assisted living)

Compare Nursing Home around Berkeley Heights

The information below is reported by the New Jersey Department of Health, Health Facilities Evaluation and Licensing.

2 facilities compared · CMS & NJ Dept. of Health data

Filter by care type
Runnells Care Center
NH

Nursing Home Licensed facility providing 24/7 skilled nursing care for residents with complex, ongoing medical needs. Staffed by RNs, LPNs, and CNAs. Inspected and star-rated annually by CMS. Accepts Medicare (short-term rehab) and Medicaid (long-term care).

AL

Assisted Living A licensed, long-term care setting for seniors or individuals with disabilities who need help with daily activities — like bathing, dressing, and medication management — but not 24-hour skilled nursing. Offers housing, meals, and around-the-clock support while aiming to maximize resident independence.

MC

Memory Care Secured, specialized care for people living with Alzheimer's or dementia. Staff trained in cognitive impairment, with higher staff-to-resident ratios and an environment designed to reduce confusion and wandering risk.

Berkeley Heights (Watchung Way)300 90.1% +17%4.96 +82%+28%$5.2k264.31246 15 Avraham Rosenberg$33.3M$19.6M58.9%315009
Autumn Lake Healthcare at Berkeley Heights
NH

Nursing Home Licensed facility providing 24/7 skilled nursing care for residents with complex, ongoing medical needs. Staffed by RNs, LPNs, and CNAs. Inspected and star-rated annually by CMS. Accepts Medicare (short-term rehab) and Medicaid (long-term care).

AL

Assisted Living A licensed, long-term care setting for seniors or individuals with disabilities who need help with daily activities — like bathing, dressing, and medication management — but not 24-hour skilled nursing. Offers housing, meals, and around-the-clock support while aiming to maximize resident independence.

Berkeley Heights (Cottage Street)130 68.3% -11%3.83 -61%-1%$102.7k225.51105 50 Bheights Associates LLC$12.5M$7.4M59.3%315195

Frequently Asked Questions about Autumn Lake Healthcare at Berkeley Heights

What neighborhood is Autumn Lake Healthcare at Berkeley Heights in?

Autumn Lake Healthcare at Berkeley Heights is in the Cottage Street neighborhood of Berkeley Heights.

Who is the owner of Autumn Lake Healthcare at Berkeley Heights?

The legal owner and operator of Autumn Lake Healthcare at Berkeley Heights is Bheights Associates, Llc.

Is Autumn Lake Healthcare at Berkeley Heights in a walkable area?

Autumn Lake Healthcare at Berkeley Heights has a walk score of 50. Moderately walkable. Some errands can be accomplished on foot, with a mix of nearby amenities.

What is the license number of Autumn Lake Healthcare at Berkeley Heights?

According to NJ state health department records, Autumn Lake Healthcare at Berkeley Heights's license number is 62016.

When does Autumn Lake Healthcare at Berkeley Heights's license expire?

According to NJ state health department records, Autumn Lake Healthcare at Berkeley Heights's license expires on May 31, 2026.

What is the occupancy rate at Autumn Lake Healthcare at Berkeley Heights?

Autumn Lake Healthcare at Berkeley Heights's occupancy is 75%.

Who is the administrator of Autumn Lake Healthcare at Berkeley Heights?

Shimon Sitzer is the administrator of Autumn Lake Healthcare at Berkeley Heights.

Guides for Better Senior Living

Care Cost Calculator: See Prices in Your Area

Nursing Home Data Explorer

Don’t Wait Too Long: 7 Red Flag Signs Your Parent Needs Assisted Living Now

The True Cost of Assisted Living in 2025 – And How Families Are Paying For It

Understanding Senior Living Costs: Pricing Models, Discounts & Financial Assistance

Explore Open Rooms
1 Contact details
2 What type of senior care service are you looking for?
3 What budget do you have in mind for senior care?
4 How soon do you need to find care?
5 Additional details

Thank you for your interest!

Our team will be in touch shortly to help with next steps.