Scenic Pointe Nursing & Rehabilitation Center

Nursing Home

Scenic Pointe Nursing & Rehabilitation Center

8067 Township Rd 334, Millersburg, OH 44654 View Map
Nursing Home
icon
Care Cost Calculator: See Prices in Your Area Care Cost Calculator: See Prices in Your Area icon
Overview of Scenic Pointe Nursing & Rehabilitation Center

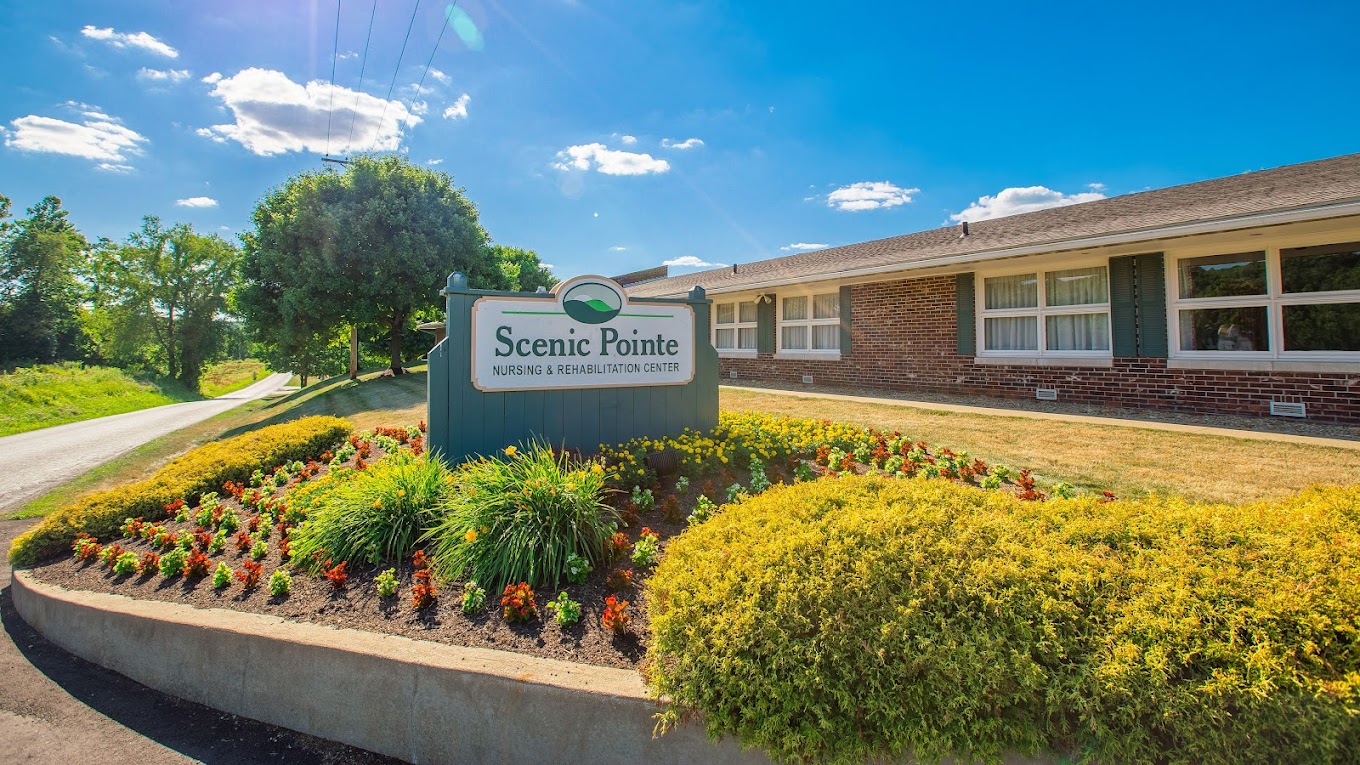
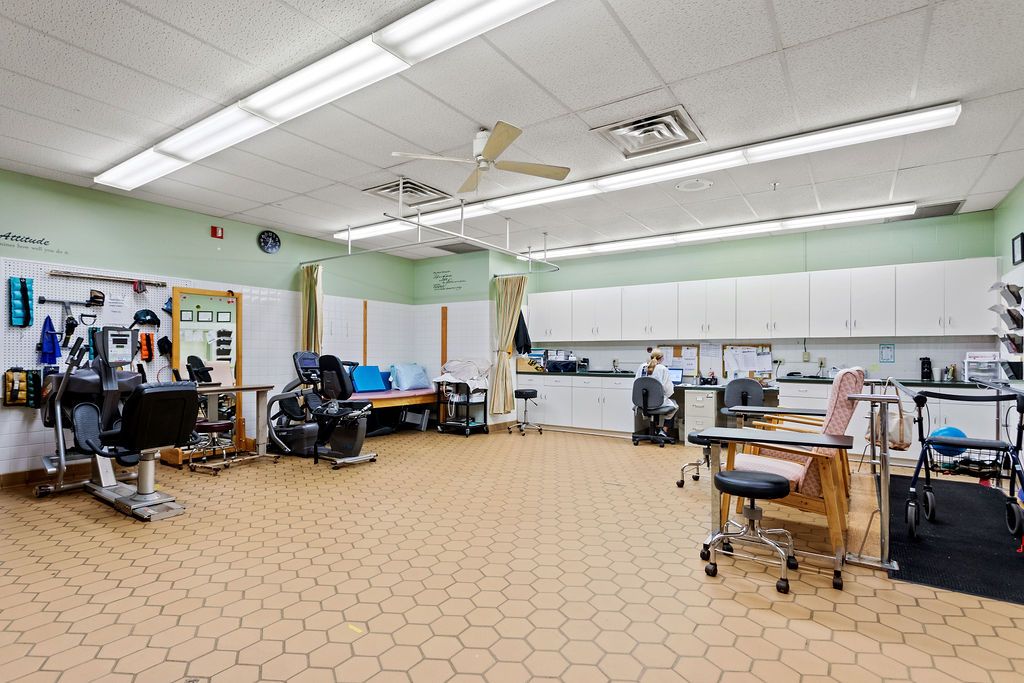
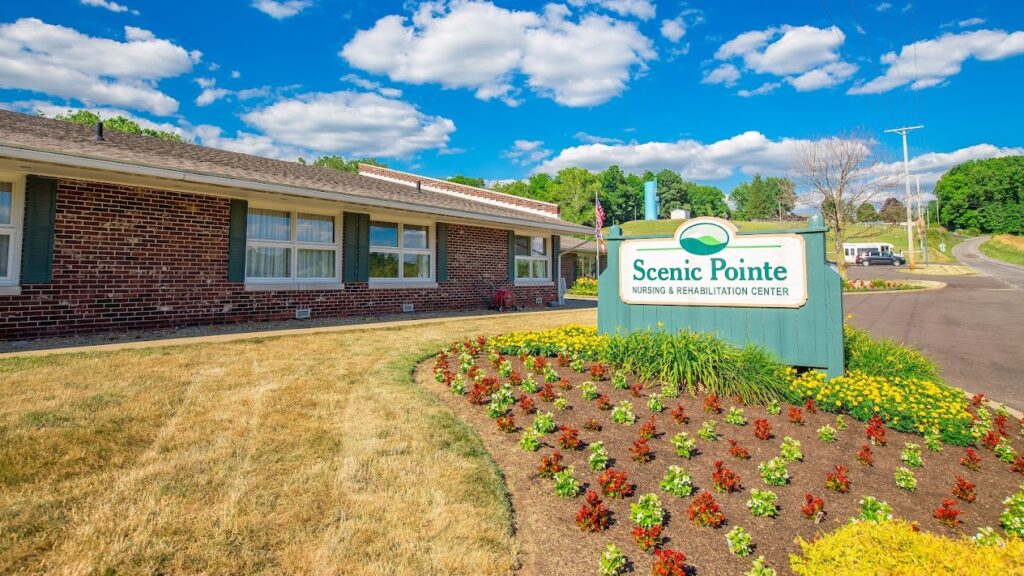
A purposely built community that is dedicated to improving seniors’ well-being, Scenic Pointe Nursing & Rehabilitation Center in Millersburg, OH, provides skilled nursing, occupational, physical, and speech therapy, and respite care. With meticulously designed behavioral units, the community promotes a serene and welcoming environment for seniors going through a mental health crisis. Delivering top-notch care and assistance around the clock, a competent and responsible team ensures seniors thrive and live their best lives.

Seniors can seek comfort and families receive the support they need for their end-of-life journey with hospice care. The community also partners with the Ohio Veterans Hospitals to provide veterans with the finest care and assistance for their honorable service. Scenic Pointe Nursing & Rehabilitation Center is an enticing option for seniors to enjoy a wondrous retirement.

(330) 674-0015

Quality ratings

Measured by Centers for Medicare & Medicaid Services (CMS)

Overall rating Info Official CMS rating based on health inspections, staffing and quality measures.
3/5
Ohio average: 3.2/5
Health Inspection Info Official CMS rating based on deficiencies found during state health inspections.
3/5
Ohio average: 2.8/5
Staffing Info Official CMS rating based on nurse staffing hours per resident per day.
2/5
Ohio average: 2.4/5

Nursing care per resident

Info Average daily nursing hours per resident (adjusted for acuity). Higher values indicate more nursing time per resident.
2h 23m per day

This home provides 33% less nursing time per resident than the state average.

Ohio average: 3h 32m per day

Staffing hours breakdown

Info Hours of care per resident per day, broken down by staff type. Data from CMS Medicare.
Staff type Facility State avg National avg
Registered Nurse (RN) Info Registered nurse hours per resident per day. 27m per day 38m per day 41m per day
LPN / LVN Info Licensed Practical Nurse / Licensed Vocational Nurse hours per resident per day. 51m per day 58m per day 52m per day
Nurse Aide Info Nurse aide hours per resident per day. 1h 38m per day 2h 8m per day 2h 21m per day
Total Nursing (Weekend) Info Total number of nurse staff hours per resident per day on weekends. 2h 20m per day 3h 17m per day 3h 26m per day
RN (Weekend) Info Registered nurse hours per resident per day on weekends. 10m per day 25m per day 29m per day

Capacity and availability

This home usually has limited availability

Occupancy is moderate, suggesting balanced demand.

Similar demand to the Ohio average
Occupancy rate 89.5%
Residents per day (avg) 137
Occupancy rate
89.5%
Residents per day (avg)
137

Who this home usually serves

TYPE OF STAY

Mostly long-term care residents

Most residents stay for extended periods and receive ongoing daily care.

Might be optimal for
Long-term daily care Ongoing support needs

Breakdown by payment type

Medicare

5% of new residents, usually for short-term rehab.

Typical stay 2 - 3 months

Private pay

70% of new residents, often for short stays.

Typical stay 1 years

Medicaid

25% of new residents, often for long-term daily care.

Typical stay 5 - 6 years

Finances and operations

Proprietary home
Corporation
Home revenue
$13.8M
Profit
$2.2M
Proprietary home Corporation
Home revenue
$13,759,750.00
Profit
$2,158,012.00
Payroll costs Info The portion of the home's budget spent on staff, including nurses, caregivers, and other employees who support care and operations.
$6.3M
46.1% of revenue
Other operating costs Info All remaining costs needed to run the home, such as food, utilities, building maintenance, supplies and administrative expenses.
$5.3M
Total costs $11.6M

What does this home offer?

Accepts Medicaid icon

Accept Medicaid: Yes, Accept

Total residents icon

Total Residents: 164 Residents

Housing options icon

Housing Options: Private / Semi-Private Rooms

Building type icon
Building type icon

Building Type: Single-story

Types of Care at Scenic Pointe Nursing & Rehabilitation Center

Nursing Home
Contact Scenic Pointe Nursing & Rehabilitation Center

Compare Nursing Homes around Millersburg

The information below is reported by the Ohio Department of Health, Bureau of Survey and Certification.
Scenic Pointe Nursing & Rehabilitation Center
AL

Assisted Living For seniors needing help with daily tasks but not full-time nursing.

IL

Independent Living For self-sufficient seniors seeking community and minimal assistance.

MC

Memory Care Specialized care for those with Memory Loss, Alzheimer's, or dementia, ensuring safety and support.

SNF

Nursing Homes 24/7 care needed

Millersburg
150
No
1
PROUDFOOT, BETHANY
89.5%
$13,758,512.00
$6,336,783.00
46.1%
136.50
3/5
2.3854
3/5
2/5
18
1
-54%
-33%
+14%
Private / Semi-Private Rooms
Danbury Millersburg
AL

Assisted Living For seniors needing help with daily tasks but not full-time nursing.

IL

Independent Living For self-sufficient seniors seeking community and minimal assistance.

MC

Memory Care Specialized care for those with Memory Loss, Alzheimer's, or dementia, ensuring safety and support.

SNF

Nursing Homes 24/7 care needed

Millersburg
-
Yes
17
-
-
-
-
-
-
-
-
-
-
-
-
-
-
-
Private / Semi-Private Rooms

Places of interest near Scenic Pointe Nursing & Rehabilitation Center

Address 2.4 miles from city center

Address 8067 Township Rd 334, Millersburg, OH 44654

Calculate Travel Distance to Scenic Pointe Nursing & Rehabilitation Center

Add your location

Address

Staffing Data

Source: CMS Payroll-Based Journal (Q2 2025)

143
Total Staff
127
Employees
16
Contractors
44,094
Total Hours (Quarter)
53
Avg Staff/Day
9.1
Avg Shift (hrs)
Nursing Staff Breakdown
Role Count Avg Shift (hrs) Uses Contractors?
Registered Nurse69.5 No
Licensed Practical Nurse2411 No
Certified Nursing Assistant629.8 No
Staff by Category
Administration
1 staff
8hs shift avg
Nursing Staff
103 staff
9.9hs shift avg
Physicians & Practitioners
8 staff
7.6hs shift avg
Therapy Services
15 staff
5.5hs shift avg
Activities & Recreation
1 staff
5hs shift avg
Social Services
5 staff
3.3hs shift avg
Dietary Services
6 staff
8hs shift avg
Other Services
4 staff
8hs shift avg
Contractor Analysis
2.9%
of total hours from contractors
1,290 contractor hours this quarter
Respiratory Therapy Technician: 1 Qualified Social Worker: 5 Physical Therapy Assistant: 2 Physical Therapy Aide: 5 Speech Language Pathologist: 3
Role Employees Contractors Total Staff Total Hours Days Worked % of Days Avg Shift (hrs)
Certified Nursing Assistant6206221,06591100%9.8
Licensed Practical Nurse240249,55191100%11
Clinical Nurse Specialist7073,2088593%7.5
Other Dietary Services Staff5052,2668593%8.1
Registered Nurse6061,91391100%9.5
Dental Services Staff3039616571%7.7
Nurse Aide in Training9097773437%7.4
RN Director of Nursing2026686470%7.7
Occupational Therapy Aide3035666470%7.8
Nurse Practitioner1014886167%8
Administrator1014806066%8
Dietitian1014685965%7.9
Speech Language Pathologist0334636571%5.8
Physical Therapy Aide0554106571%6.1
Mental Health Service Worker1013283842%8.6
Qualified Social Worker0551935763%3.3
Respiratory Therapy Technician0111254347%2.9
Physical Therapy Assistant022993943%2.5
Qualified Activities Professional1013578%5
Occupational Therapy Assistant1013167%5.2

Health Inspection History

Inspections
Total health inspections 6

Ohio average 6.7


Last Health inspection on Apr 2025

Total health citations 18
Citations per inspection
3

Health citations are formal notices following inspections when they fail to comply with safety and care standards.

13 of 18 citations resulted from standard inspections; and 5 of 18 resulted from complaint investigations.

Breakdown of citation severity (last 3 years)
Critical Health citations More info 0
100% better than Ohio average

Ohio average: 0.3


Serious Health citations More info 1
11% worse than Ohio average

Ohio average: 0.9

0 critical citations More info Ohio average: 0.3

1 serious citation More info Ohio average: 0.9

17 moderate citations More info Ohio average: 29

0 minor citations More info Ohio average: 0.7
Citations history (last 3 years)
Resident Rights moderate citation Apr 07, 2025
Corrected

Nutrition moderate citation Sep 19, 2024
Corrected

Resident Rights moderate citation Sep 19, 2024
Corrected

Nursing Services moderate citation Mar 28, 2024
Corrected

Facility Characteristics

Source: CMS Long-Term Care Facility Characteristics (Data as of Jan 2026)

Ownership: For-Profit Corporation
Part of: Foundations Health Solutions
Resident Census by Payment Source
131 Total Residents
Medicaid 101 (77.1%)
Private Pay/Other 30 (22.9%)
Programs & Services
Nurse Aide Training

Quality of care over time

These measures show how residents usually do over time at this home, based on health outcomes and preventive care.

High-risk clinical events score Info A composite score based on pressure ulcers, falls with injury, weight loss, walking ability decline, and activities of daily living decline. 1.5
74% better than Ohio average

Ohio average: 5.8

Functional decline score Info A composite score based on activities of daily living decline, walking ability decline, and incontinence. 5.8
54% better than Ohio average

Ohio average: 12.7

Long-stay resident measures
Need for Help with Daily Activities Increased Info Percent of long-stay residents whose need for help with daily activities has increased 1.6%
77% better than Ohio average

Ohio average: 6.8%

Walking Ability Worsened Info Percent of long-stay residents whose ability to move independently worsened 0.7%
93% better than Ohio average

Ohio average: 8.9%

Low Risk Residents with Bowel/Bladder Incontinence Info Percent of low risk long-stay residents who lose control of their bowels or bladder 15.3%
31% better than Ohio average

Ohio average: 22.0%

Falls with Major Injury Info Percent of long-stay residents experiencing one or more falls with major injury 3.4%
In line with Ohio average

Ohio average: 3.4%

High Risk Residents with Pressure Ulcers Info Percent of long-stay high risk residents with pressure ulcers 0.3%
92% better than Ohio average

Ohio average: 3.9%

Urinary Tract Infection Info Percent of long-stay residents with a urinary tract infection 0.0%
100% better than Ohio average

Ohio average: 0.5%

Lost Too Much Weight Info Percent of long-stay residents who lose too much weight 1.7%
72% better than Ohio average

Ohio average: 6.2%

Depressive Symptoms Info Percent of long-stay residents who have depressive symptoms 72.3%
201% worse than Ohio average

Ohio average: 24.0%

Pneumococcal Vaccine Info Percent of long-stay residents assessed and appropriately given the pneumococcal vaccine 98.1%
6% better than Ohio average

Ohio average: 92.4%

Influenza Vaccine Info Percent of long-stay residents assessed and appropriately given the seasonal influenza vaccine 100.0%
6% better than Ohio average

Ohio average: 94.5%

Hospitalizations per 1,000 days Info Number of hospitalizations per 1,000 long-stay resident days. 0.97
45% better than Ohio average

Ohio average: 1.77

ED visits per 1,000 days Info Number of outpatient emergency department visits per 1,000 long-stay resident days. 0.95
48% better than Ohio average

Ohio average: 1.83

Short-stay resident measures
Pneumococcal Vaccine Info Percent of short-stay residents assessed and appropriately given the pneumococcal vaccine 82.1%
5% better than Ohio average

Ohio average: 78.0%

Guides for Better Senior Living

Care Cost Calculator: See Prices in Your Area

Nursing Home Data Explorer

Don’t Wait Too Long: 7 Red Flag Signs Your Parent Needs Assisted Living Now

The True Cost of Assisted Living in 2025 – And How Families Are Paying For It

Understanding Senior Living Costs: Pricing Models, Discounts & Financial Assistance

Financial Aid for Ohio Seniors

Get financial aid guidance

PASSPORT Waiver

Ohio Medicaid PASSPORT

Age 60+, Ohio resident, Medicaid-eligible, nursing home-level care need.

~$2,829/month (300% FBR, individual).

$2,000 (individual), $3,000 (couple).

Administered through regional agencies; waitlists possible.

Ohio Home Care Program (non-Medicaid)

OH HCP

Age 60+, Ohio resident, at risk of decline.

~$2,000/month (individual, varies).

$5,000 (individual).

Limited funding; regional variation.

Assisted Living Waiver (ALW)

Ohio Assisted Living Waiver

Age 21+ (65+ prioritized), OH resident, Medicaid-eligible, NFLOC.

~$2,829/month (individual); QIT required.

$2,000 (individual), $3,000 (couple).

Covers ~300 facilities; room/board not included (separate cost).

Program of All-Inclusive Care for the Elderly (PACE)

Ohio PACE (e.g., McGregor PACE)

Age 55+, OH resident (specific counties), NFLOC, safe with PACE support.

~$2,829/month (Medicaid-eligible); private pay option available.

$2,000 (individual), $3,000 (couple) for Medicaid enrollees.

Available in 9 counties (e.g., Cuyahoga, Franklin); expanding via Healthy Aging Grants.

Medicare Savings Program (MSP)

Ohio Medicare Savings Program

Age 65+ or disabled, OH resident, Medicare Part A/B.

~$2,510/month (QMB), ~$3,380/month (SLMB), ~$3,598/month (QI)—individual.

$9,430 (individual), $14,130 (couple).

Three tiers; includes Extra Help for Part D; no waitlist.

Home Energy Assistance Program (HEAP)

Ohio HEAP

Age 60+ prioritized, OH resident, low-income household.

~$3,970/month (individual, 185% FPL).

Not assessed; income-focused.

Covers gas, electric, oil; emergency aid via Winter/Summer Crisis Programs.

Family Caregiver Support Program (FCSP)

Ohio Family Caregiver Support Program

Caregivers of 60+ needing care or 55+ caregivers of others; OH resident; functional needs (2+ ADLs).

Prioritizes ~$24,980/year (individual); no strict cap.

Not assessed; need-based.

12 AAAs; rural/low-income priority; volunteer respite option.

Senior Community Service Employment Program (SCSEP)

Ohio SCSEP

Age 55+, unemployed, low-income, OH resident.

~$1,983/month (125% FPL).

Not specified; income-focused.

Priority for veterans, rural residents; AARP partnership.

VA Aid and Attendance (A&A) and Housebound Benefits

Ohio VA Aid and Attendance/Housebound

Age 65+ or disabled veteran/spouse, OH resident, wartime service, need for ADL help (A&A) or homebound.

Net income < ~$1,984/month (veteran with dependent, A&A); pension offsets income.

~$155,356 (net worth limit).

High veteran demand; supports care in multiple settings.

Homestead Exemption

Ohio Homestead Exemption

Age 65+ (or disabled), OH resident, homeowner, low-income.

~$38,500/year (individual, adjusted annually).

Not assessed; home ownership required.

Reduces taxable value by $25,000; applies to primary residence.

Save the Dream Ohio (Homeowner Assistance Fund)

Ohio Save the Dream

Age 60+ prioritized, OH resident, homeowner, hardship post-Jan 21, 2020.

~$147,600/year (family of 4, 150% AMI; varies by county).

Not assessed; hardship-focused.

Covers delinquent mortgages, utilities, taxes; max $25,000 mortgage aid.

Who we are

Your Senior Care Partner, Every Step of the Way

We help families find affordable senior communities and unlock same day discounts, Medicaid, and Medicare options tailored to your needs.

Contact us Today