Scenic Pointe Nursing & Rehabilitation Center

Nursing Home in Millersburg

CMS overall rating Info The Overall CMS Rating is scored from 1 to 5 stars and combines results from health inspections, staffing levels, and quality measures. Health inspections carry the most weight. Staffing and quality scores can increase or decrease the final rating based on performance compared to state and national standards.

Overview of Scenic Pointe Nursing & Rehabilitation Center

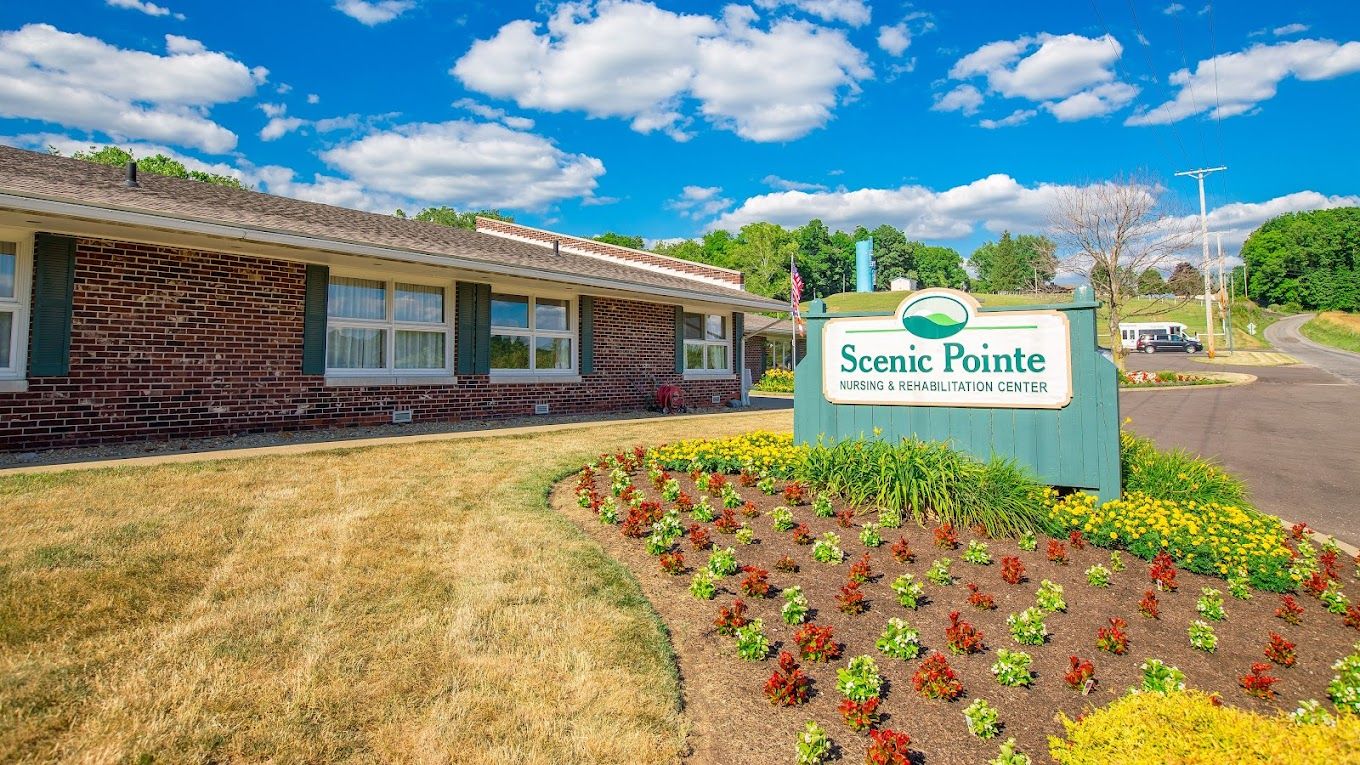
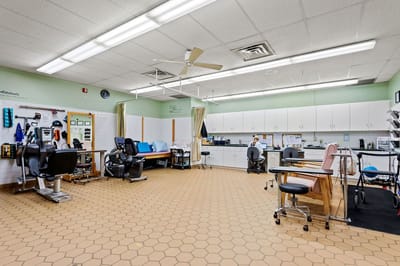
A purposely built community that is dedicated to improving seniors’ well-being, Scenic Pointe Nursing & Rehabilitation Center in Millersburg, OH, provides skilled nursing, occupational, physical, and speech therapy, and respite care. With meticulously designed behavioral units, the community promotes a serene and welcoming environment for seniors going through a mental health crisis. Delivering top-notch care and assistance around the clock, a competent and responsible team ensures seniors thrive and live their best lives.

Seniors can seek comfort and families receive the support they need for their end-of-life journey with hospice care. The community also partners with the Ohio Veterans Hospitals to provide veterans with the finest care and assistance for their honorable service. Scenic Pointe Nursing & Rehabilitation Center is an enticing option for seniors to enjoy a wondrous retirement.

(330) 674-0015

Quality ratings

Measured by Centers for Medicare & Medicaid Services (CMS)

Overall rating Info The Overall CMS Rating combines results from health inspections, staffing levels and quality measures. Health inspections carry the most weight. Staffing and quality scores can increase or decrease the final rating based on performance compared to state and national standards.
3/5 ▼ 0.2 Ohio average: 3.2/5
Health Inspection Info Based on the results of the facility's three most recent standard inspections and any complaint investigations. CMS reviews the number, scope, and severity of deficiencies, with more recent findings weighted more heavily.
3/5 ▲ 0.2 Ohio average: 2.8/5
Staffing Info Measures average nursing staff hours per resident per day, including Registered Nurses (RNs) and total nursing staff. Ratings are adjusted based on the level of care residents require and are compared to state and national benchmarks.
2/5 ▼ 0.4 Ohio average: 2.4/5

Staffing hours breakdown

Info Daily nursing hours per resident by staff type, reported to CMS. Higher is generally better — compare this facility to state and national averages to see where staffing stands.

Hours per resident per day — compared to Ohio state averages

Total nursing care / resident Info This home is ranked 172nd out of 176 homes in Ohio.

Total adjusted nursing hours per resident per day, combining RN, LPN, and aide time. CMS adjusts this for case-mix so facilities can be fairly compared.
2h 23m per day
Rank #172 / 176Nurse hours — state benchmarkedThis home is ranked 172nd out of 176 homes in Ohio.Shows adjusted nurse hours per resident per day benchmarked to the Ohio average, with a ranking across 176 Ohio SNFs. More hours mean more direct care. The national average is about 3.5 hrs; below 3.0 is a red flag.
This facility Ohio avg (3h 32m per day)
vs Ohio avg
-33%

5 of 5 metrics below state avg

Staff typeHours / dayvs state avg
Registered Nurse (RN) Info RNs hold the highest nursing license and can assess residents, interpret test results, and direct care plans. More RN hours per day often signals stronger clinical oversight and faster response to health changes. 27m per day ▼ 29% State avg: 38m per day · National avg: 41m per day
LPN / LVN Info Licensed Practical Nurses (LPNs) or Licensed Vocational Nurses (LVNs) deliver routine hands-on care — medication administration, wound dressing, and monitoring vital signs. They work under RN supervision and make up a large share of daily bedside care. 51m per day ▼ 12% State avg: 58m per day · National avg: 52m per day
Nurse Aide Info Certified Nurse Aides (CNAs) provide the most direct day-to-day assistance: bathing, dressing, feeding, and mobility. Nurse aide hours are typically the largest staffing category and directly affect residents' quality of life. 1h 38m per day ▼ 23% State avg: 2h 8m per day · National avg: 2h 21m per day
Total Nursing (Weekend) Info Combined nursing hours (RN + LPN + Nurse Aide) per resident per day on weekends. Staffing often drops on weekends — this figure reveals whether the facility maintains adequate coverage outside of weekday hours. 2h 20m per day ▼ 29% State avg: 3h 17m per day · National avg: 3h 26m per day
RN (Weekend) Info Registered nurse hours specifically on weekends. Facilities sometimes reduce RN presence on Saturdays and Sundays — a low weekend RN figure compared to weekday hours can indicate reduced clinical oversight when most administrative staff are absent. 10m per day ▼ 60% State avg: 25m per day · National avg: 29m per day

Capacity and availability

This home usually has limited availability

Occupancy between 85% and 95% suggests balanced demand.

Higher occupancy than the Ohio average: 78.7%
Occupancy rate 89.5% Rank #36 / 177Occupancy rate — state benchmarkedThis home is ranked 36th out of 177 homes in Ohio.Shows this facility's occupancy rate versus the Ohio average, with its statewide rank out of 177. Higher occupancy signals strong local demand and financial stability.
Avg. Length of Stay 842 days
Occupancy rate
89.5% Rank #36 / 177Occupancy rate — state benchmarkedThis home is ranked 36th out of 177 homes in Ohio.Shows this facility's occupancy rate versus the Ohio average, with its statewide rank out of 177. Higher occupancy signals strong local demand and financial stability.
Avg. Length of Stay
842 days

Who this home usually serves

TYPE OF STAY

Mostly long-term care residents

Most residents stay for extended periods and receive ongoing daily care.

Might be optimal for
Long-term daily care Ongoing support needs

Breakdown by payment type

Medicare

5% of new residents, usually for short-term rehab.

Typical stay 2 - 3 months

Private pay

70% of new residents, often for short stays.

Typical stay 1 years

Medicaid

25% of new residents, often for long-term daily care.

Typical stay 5 - 6 years

Finances and operations

Privately-owned community
Operated by a business corporation.
Home revenue
$13.8M
Profit
$2.2M
Privately-owned community Operated by a business corporation.
Home revenue
$13.8M Rank #44 / 176Revenue — state benchmarkedThis home is ranked 44th out of 176 homes in Ohio.Shows this facility's annual revenue compared to the Ohio SNF average. Higher revenue generally means more resources for staffing and capital — read alongside Payroll %.
Profit
$2.2M
Payroll costs Info The portion of the home's budget spent on staff, including nurses, caregivers, and other employees who support care and operations. Rank #28 / 176Payroll — state benchmarkedThis home is ranked 28th out of 176 homes in Ohio.Shows total annual staff payroll benchmarked to the Ohio average. Higher payroll investment relative to peers often signals better staffing and less reliance on cheaper contract labor.
$6.3M
46.1% of revenue Rank #38 / 176Payroll % — state benchmarkedThis home is ranked 38th out of 176 homes in Ohio.Shows payroll as a percentage of revenue versus the Ohio average. Well-run SNFs often land around 55–65%. Below 25% may signal understaffing or heavy agency use — read with Staffing ratings.
Other operating costs Info All remaining costs needed to run the home, such as food, utilities, building maintenance, supplies and administrative expenses.
$5.3M
Total costs $11.6M
Walk Score
Walk Score: 1 / 100 Rank #119 / 123Walk Score — state benchmarkedThis home is ranked 119th out of 123 homes in Ohio.Shows how walkable this facility's neighborhood is compared to the average Walk Score across Ohio SNFs. Higher scores benefit residents, families, and staff.
Car-dependent. Most errands require a car, with limited nearby walkable options.

What does this home offer?

Accepts Medicaid icon

Accept Medicaid: Yes, Accept

Total residents icon

Total Residents: 164 Residents

Housing options icon

Housing Options: Private / Semi-Private Rooms

Building type icon
Building type icon

Building Type: Single-story

Types of Care at Scenic Pointe Nursing & Rehabilitation Center

Nursing Home

Contact Scenic Pointe Nursing & Rehabilitation Center

Health Inspection History

Inspections
Total health inspections 6

Ohio average 6.7


Last Health inspection on Apr 2025

Total health citations
18 Rank #48 / 177Health citations — state benchmarkedThis home is ranked 48th out of 177 homes in Ohio.Shows this facility's total health deficiency citations benchmarked to the Ohio state average, with a ranking across all 177 OH SNFs. Lower citation counts earn a better rank.

Ohio average 30.9

Citations per inspection
3

Ohio average 4.59


Health citations are formal notices following inspections when they fail to comply with safety and care standards.

13 of 18 citations resulted from standard inspections; and 5 of 18 resulted from complaint investigations.

Breakdown of citation severity (last 3 years)
Critical Health citations More info
0 Rank #1 / 96Severe citations — state benchmarkedThis home is ranked 1st out of 96 homes in Ohio.Shows citations where actual resident harm occurred, compared to the Ohio average and ranked across 96 SNFs statewide. Even a single severe citation is significant — lower is always better.
100% better than Ohio average

Ohio average: 0.3


Serious Health citations More info 1
11% worse than Ohio average

Ohio average: 0.9

0 critical citations More info Ohio average: 0.3

1 serious citation More info Ohio average: 0.9

17 moderate citations More info Ohio average: 29

0 minor citations More info Ohio average: 0.7
Citations history (last 3 years)
Resident Rights moderate citation Info Issues related to resident's rights, including dignity, privacy, and the ability to make decisions about their care. Apr 07, 2025
Corrected

Nutrition moderate citation Info Issues related to food quality, meal service, and resident's nutritional needs. Sep 19, 2024
Corrected

Resident Rights moderate citation Info Issues related to resident's rights, including dignity, privacy, and the ability to make decisions about their care. Sep 19, 2024
Corrected

Nursing Services moderate citation Info Issues related to the availability and quality of nursing staff and the care they provide. Mar 28, 2024
Corrected

Compare Nursing Homes around Millersburg The information below is reported by the Ohio Department of Health, Bureau of Survey and Certification.

1 facility compared · CMS & OH Dept. of Health data · Updated Apr 2026

Filter by care type
Scenic Pointe Nursing & Rehabilitation Center
AL

Assisted Living A licensed, long-term care setting for seniors or individuals with disabilities who need help with daily activities — like bathing, dressing, and medication management — but not 24-hour skilled nursing. Offers housing, meals, and around-the-clock support while aiming to maximize resident independence.

IL

Independent Living Lifestyle-focused communities for older adults offering dining, activities, and transportation with minimal personal care. Best for active, independent seniors who want community without medical support.

MC

Memory Care Secured, specialized care for people living with Alzheimer's or dementia. Staff trained in cognitive impairment, with higher staff-to-resident ratios and an environment designed to reduce confusion and wandering risk.

NH

Nursing Home Licensed facility providing 24/7 skilled nursing care for residents with complex, ongoing medical needs. Staffed by RNs, LPNs, and CNAs. Inspected and star-rated annually by CMS. Accepts Medicare (short-term rehab) and Medicaid (long-term care).

Millersburg150 89.5% +14%2.39 --54%-33%0183.01137- 1 Proudfoot, Bethany$13.8M$6.3M46.1%366333

Financial Assistance for
Nursing Home in Ohio

Get Financial aid guidance

PASSPORT Waiver

Ohio Medicaid PASSPORT

Age 60+
General Ohio resident, Medicaid-eligible, nursing home-level care need.
Income Limits (2025) ~$2,829/month 300% FBR, individual
Asset Limits $2,000 (individual), $3,000 (couple).
OH

Administered through regional agencies; waitlists possible.

Benefits
Personal care (5-7 hours/day) Respite (240 hours/year) Adult day care ($65/day) Home modifications ($1,500 avg.)

Ohio Home Care Program (non-Medicaid)

OH HCP

Age 60+
General Ohio resident, at risk of decline.
Income Limits ~$2,000/month individual, varies
Asset Limits $5,000 individual
OH

Limited funding; regional variation.

Benefits
In-home care (3-5 hours/week) Respite (up to 10 days/year) Transportation (~5 trips/month)

Assisted Living Waiver (ALW)

Ohio Assisted Living Waiver

Age 21+ (65+ prioritized)
General OH resident, Medicaid-eligible, NFLOC.
Income Limits (2025) ~$2,829/month (individual); QIT required.
Asset Limits $2,000 (individual), $3,000 (couple).
OH

Covers ~300 facilities; room/board not included (separate cost).

Benefits
Personal care Meals Medication management Transportation (~$3,000-$4,000/month value)

Program of All-Inclusive Care for the Elderly (PACE)

Ohio PACE (e.g., McGregor PACE)

Age 55+
General OH resident (specific counties), NFLOC, safe with PACE support.
Income Limits (2025) ~$2,829/month (Medicaid-eligible); private pay option available.
Asset Limits $2,000 (individual), $3,000 (couple) for Medicaid enrollees.
OH

Available in 9 counties (e.g., Cuyahoga, Franklin); expanding via Healthy Aging Grants.

Benefits
Personal care (5-7 hours/day) Medical care Meals Transportation Respite Therapies

Medicare Savings Program (MSP)

Ohio Medicare Savings Program

Age 65+ or disabled
General OH resident, Medicare Part A/B.
Income Limits (2025) ~$2,510/month (QMB), ~$3,380/month (SLMB), ~$3,598/month (QI)—individual.
Asset Limits $9,430 (individual), $14,130 (couple).
OH

Three tiers; includes Extra Help for Part D; no waitlist.

Benefits
Covers Part B premiums ($174.70/month) Deductibles ($240/year) Copays (~20%)

Home Energy Assistance Program (HEAP)

Ohio HEAP

Age 60+ prioritized
General OH resident, low-income household.
Income Limits (2025) ~$3,970/month individual, 185% FPL
Asset Limits Not assessed; income-focused.
OH

Covers gas, electric, oil; emergency aid via Winter/Summer Crisis Programs.

Benefits
Heating/cooling aid ($300-$1,000/season) Emergency aid ($500 max)

Family Caregiver Support Program (FCSP)

Ohio Family Caregiver Support Program

Age
General Caregivers of 60+ needing care or 55+ caregivers of others; OH resident; functional needs (2+ ADLs).
Income Limits (2025) Prioritizes ~$24,980/year (individual); no strict cap.
Asset Limits Not assessed; need-based.
OH

12 AAAs; rural/low-income priority; volunteer respite option.

Benefits
Respite (4-6 hours/week or 5 days/year) Adult day care ($60/day) Training Supplies (~$500/year)

Senior Community Service Employment Program (SCSEP)

Ohio SCSEP

Age 55+
General unemployed, low-income, OH resident.
Income Limits (2025) ~$1,983/month 125% FPL
Asset Limits Not specified; income-focused.
OH

Priority for veterans, rural residents; AARP partnership.

Benefits
Paid training (~20 hours/week at ~$7.25/hour) Job placement

VA Aid and Attendance (A&A) and Housebound Benefits

Ohio VA Aid and Attendance/Housebound

Age 65+ or disabled veteran/spouse
General OH resident, wartime service, need for ADL help (A&A) or homebound.
Income Limits (2025) Net income < ~$1,984/month (veteran with dependent, A&A); pension offsets income.
Asset Limits ~$155,356 net worth limit
OH

High veteran demand; supports care in multiple settings.

Benefits
Cash (~$1,433-$2,642/month veteran, ~$951-$1,318 spouse) for care costs (e.g., in-home, assisted living)

Homestead Exemption

Ohio Homestead Exemption

Age 65+ (or disabled)
General OH resident, homeowner, low-income.
Income Limits (2025) ~$38,500/year individual, adjusted annually
Asset Limits Not assessed; home ownership required.
OH

Reduces taxable value by $25,000; applies to primary residence.

Benefits
Tax reduction (~$400-$800/year avg., varies by county)

Save the Dream Ohio (Homeowner Assistance Fund)

Ohio Save the Dream

Age 60+ prioritized
General OH resident, homeowner, hardship post-Jan 21, 2020.
Income Limits (2025) ~$147,600/year family of 4, 150% AMI; varies by county
Asset Limits Not assessed; hardship-focused.
OH

Covers delinquent mortgages, utilities, taxes; max $25,000 mortgage aid.

Benefits
Mortgage aid ($25,000 max) Utility/property tax aid ($5,000 avg.)

Places of interest near Scenic Pointe Nursing & Rehabilitation Center

Address 2.4 miles from city center Info Estimated distance in miles from Millersburg's city center to Scenic Pointe Nursing & Rehabilitation Center's address, calculated via Google Maps.

Calculate Travel Distance to Scenic Pointe Nursing & Rehabilitation Center

Add your location

Address

Staffing Data (Q2 2025)

This data corresponds to Q2 2025 and is based on CMS Payroll-Based Journal.

Total staff 143
Employees 127
Contractors 16
Staff to resident ratio 1.09:1
49% worse than Ohio average

Ohio average ratio: 2.14:1

Avg staff/day 53
Average shift 9.1 hours
12% better than Ohio average

Ohio average: 8.1 hours

Total staff hours (quarter) 44,094
Nursing staff breakdown
Registered Nurse

Manages medical care and health needs.

Total count 6
Average shift length Info Average shift length. Calculated as total hours divided by days worked and average staff per day. 9.5 hours

No contractors work on this role.

Licensed Practical Nurse

Assists with medical care and medications.

Total count 24
Average shift length Info Average shift length. Calculated as total hours divided by days worked and average staff per day. 11 hours

No contractors work on this role.

Certified Nursing Assistant

Helps with daily care and mobility.

Total count 62
Average shift length Info Average shift length. Calculated as total hours divided by days worked and average staff per day. 9.8 hours

No contractors work on this role.

Contractor staffing

Total hours from contractors

2.9%

1,290 contractor hours this quarter

Qualified Social Worker: 5 Physical Therapy Aide: 5 Speech Language Pathologist: 3 Physical Therapy Assistant: 2 Respiratory Therapy Technician: 1
Staff by category
Certified Nursing Assistant6206221,06591100%9.8
Licensed Practical Nurse240249,55191100%11
Clinical Nurse Specialist7073,2088593%7.5
Other Dietary Services Staff5052,2668593%8.1
Registered Nurse6061,91391100%9.5
Dental Services Staff3039616571%7.7
Nurse Aide in Training9097773437%7.4
RN Director of Nursing2026686470%7.7
Occupational Therapy Aide3035666470%7.8
Nurse Practitioner1014886167%8
Administrator1014806066%8
Dietitian1014685965%7.9
Speech Language Pathologist0334636571%5.8
Physical Therapy Aide0554106571%6.1
Mental Health Service Worker1013283842%8.6
Qualified Social Worker0551935763%3.3
Respiratory Therapy Technician0111254347%2.9
Physical Therapy Assistant022993943%2.5
Qualified Activities Professional1013578%5
Occupational Therapy Assistant1013167%5.2
62 Certified Nursing Assistant
% of Days 100%
24 Licensed Practical Nurse
% of Days 100%
7 Clinical Nurse Specialist
% of Days 93%
5 Other Dietary Services Staff
% of Days 93%
6 Registered Nurse
% of Days 100%
3 Dental Services Staff
% of Days 71%
9 Nurse Aide in Training
% of Days 37%
2 RN Director of Nursing
% of Days 70%
3 Occupational Therapy Aide
% of Days 70%
1 Nurse Practitioner
% of Days 67%
1 Administrator
% of Days 66%
1 Dietitian
% of Days 65%
3 Speech Language Pathologist
% of Days 71%
5 Physical Therapy Aide
% of Days 71%
1 Mental Health Service Worker
% of Days 42%
5 Qualified Social Worker
% of Days 63%
1 Respiratory Therapy Technician
% of Days 47%
2 Physical Therapy Assistant
% of Days 43%
1 Qualified Activities Professional
% of Days 8%
1 Occupational Therapy Assistant
% of Days 7%

Facility Characteristics

Source: CMS Long-Term Care Facility Characteristics (Data as of Jan 2026)

Total residents 131
Medicaid
101
77.1% of residents
Private pay or other
30
22.9% of residents
Programs & Services
Nurse Aide Training

State-approved Nurse Aide Training and Competency Evaluation Program on-site

Quality of care over time

These measures show how residents usually do over time at this home, based on health outcomes and preventive care.

High-risk clinical events score Info A composite score based on pressure ulcers, falls with injury, weight loss, walking ability decline, and activities of daily living decline. 1.5
74% better than Ohio average

Ohio average: 5.8

Functional decline score Info A composite score based on activities of daily living decline, walking ability decline, and incontinence. 5.8
54% better than Ohio average

Ohio average: 12.7

Long-stay resident measures
Need for Help with Daily Activities Increased Info Percent of long-stay residents whose need for help with daily activities has increased 1.6%
77% better than Ohio average

Ohio average: 6.8%

Walking Ability Worsened Info Percent of long-stay residents whose ability to move independently worsened 0.7%
93% better than Ohio average

Ohio average: 8.9%

Low Risk Residents with Bowel/Bladder Incontinence Info Percent of low risk long-stay residents who lose control of their bowels or bladder 15.3%
31% better than Ohio average

Ohio average: 22.0%

Falls with Major Injury Info Percent of long-stay residents experiencing one or more falls with major injury 3.4%
In line with Ohio average

Ohio average: 3.4%

High Risk Residents with Pressure Ulcers Info Percent of long-stay high risk residents with pressure ulcers 0.3%
92% better than Ohio average

Ohio average: 3.9%

Urinary Tract Infection Info Percent of long-stay residents with a urinary tract infection 0.0%
100% better than Ohio average

Ohio average: 0.5%

Lost Too Much Weight Info Percent of long-stay residents who lose too much weight 1.7%
72% better than Ohio average

Ohio average: 6.2%

Depressive Symptoms Info Percent of long-stay residents who have depressive symptoms 72.3%
201% worse than Ohio average

Ohio average: 24.0%

Pneumococcal Vaccine Info Percent of long-stay residents assessed and appropriately given the pneumococcal vaccine 98.1%
6% better than Ohio average

Ohio average: 92.4%

Influenza Vaccine Info Percent of long-stay residents assessed and appropriately given the seasonal influenza vaccine 100.0%
6% better than Ohio average

Ohio average: 94.5%

Hospitalizations per 1,000 days Info Number of hospitalizations per 1,000 long-stay resident days. 0.97
45% better than Ohio average

Ohio average: 1.77

ED visits per 1,000 days Info Number of outpatient emergency department visits per 1,000 long-stay resident days. 0.95
48% better than Ohio average

Ohio average: 1.83

Short-stay resident measures
Pneumococcal Vaccine Info Percent of short-stay residents assessed and appropriately given the pneumococcal vaccine 82.1%
5% better than Ohio average

Ohio average: 78.0%

Guides for Better Senior Living

Care Cost Calculator: See Prices in Your Area

Nursing Home Data Explorer

Don’t Wait Too Long: 7 Red Flag Signs Your Parent Needs Assisted Living Now

The True Cost of Assisted Living in 2025 – And How Families Are Paying For It

Understanding Senior Living Costs: Pricing Models, Discounts & Financial Assistance

Explore Open Rooms
1 Contact details
2 What type of senior care service are you looking for?
3 What budget do you have in mind for senior care?
4 How soon do you need to find care?
5 Additional details

Thank you for your interest!

Our team will be in touch shortly to help with next steps.