Explore Open Rooms

1 Contact details
2 What type of senior care service are you looking for?
3 What budget do you have in mind for senior care?
4 How soon do you need to find care?
5 Additional details

Thank you for your interest!

Our team will be in touch shortly to help with next steps.

Memory Care Home

Seacrest Rehabilitation and Nursing Center

Memory Care Home

Seacrest Rehabilitation and Nursing Center

1215 N Telegraph Rd, Monroe, MI 48162 View map
Overview of Seacrest Rehabilitation and Nursing Center

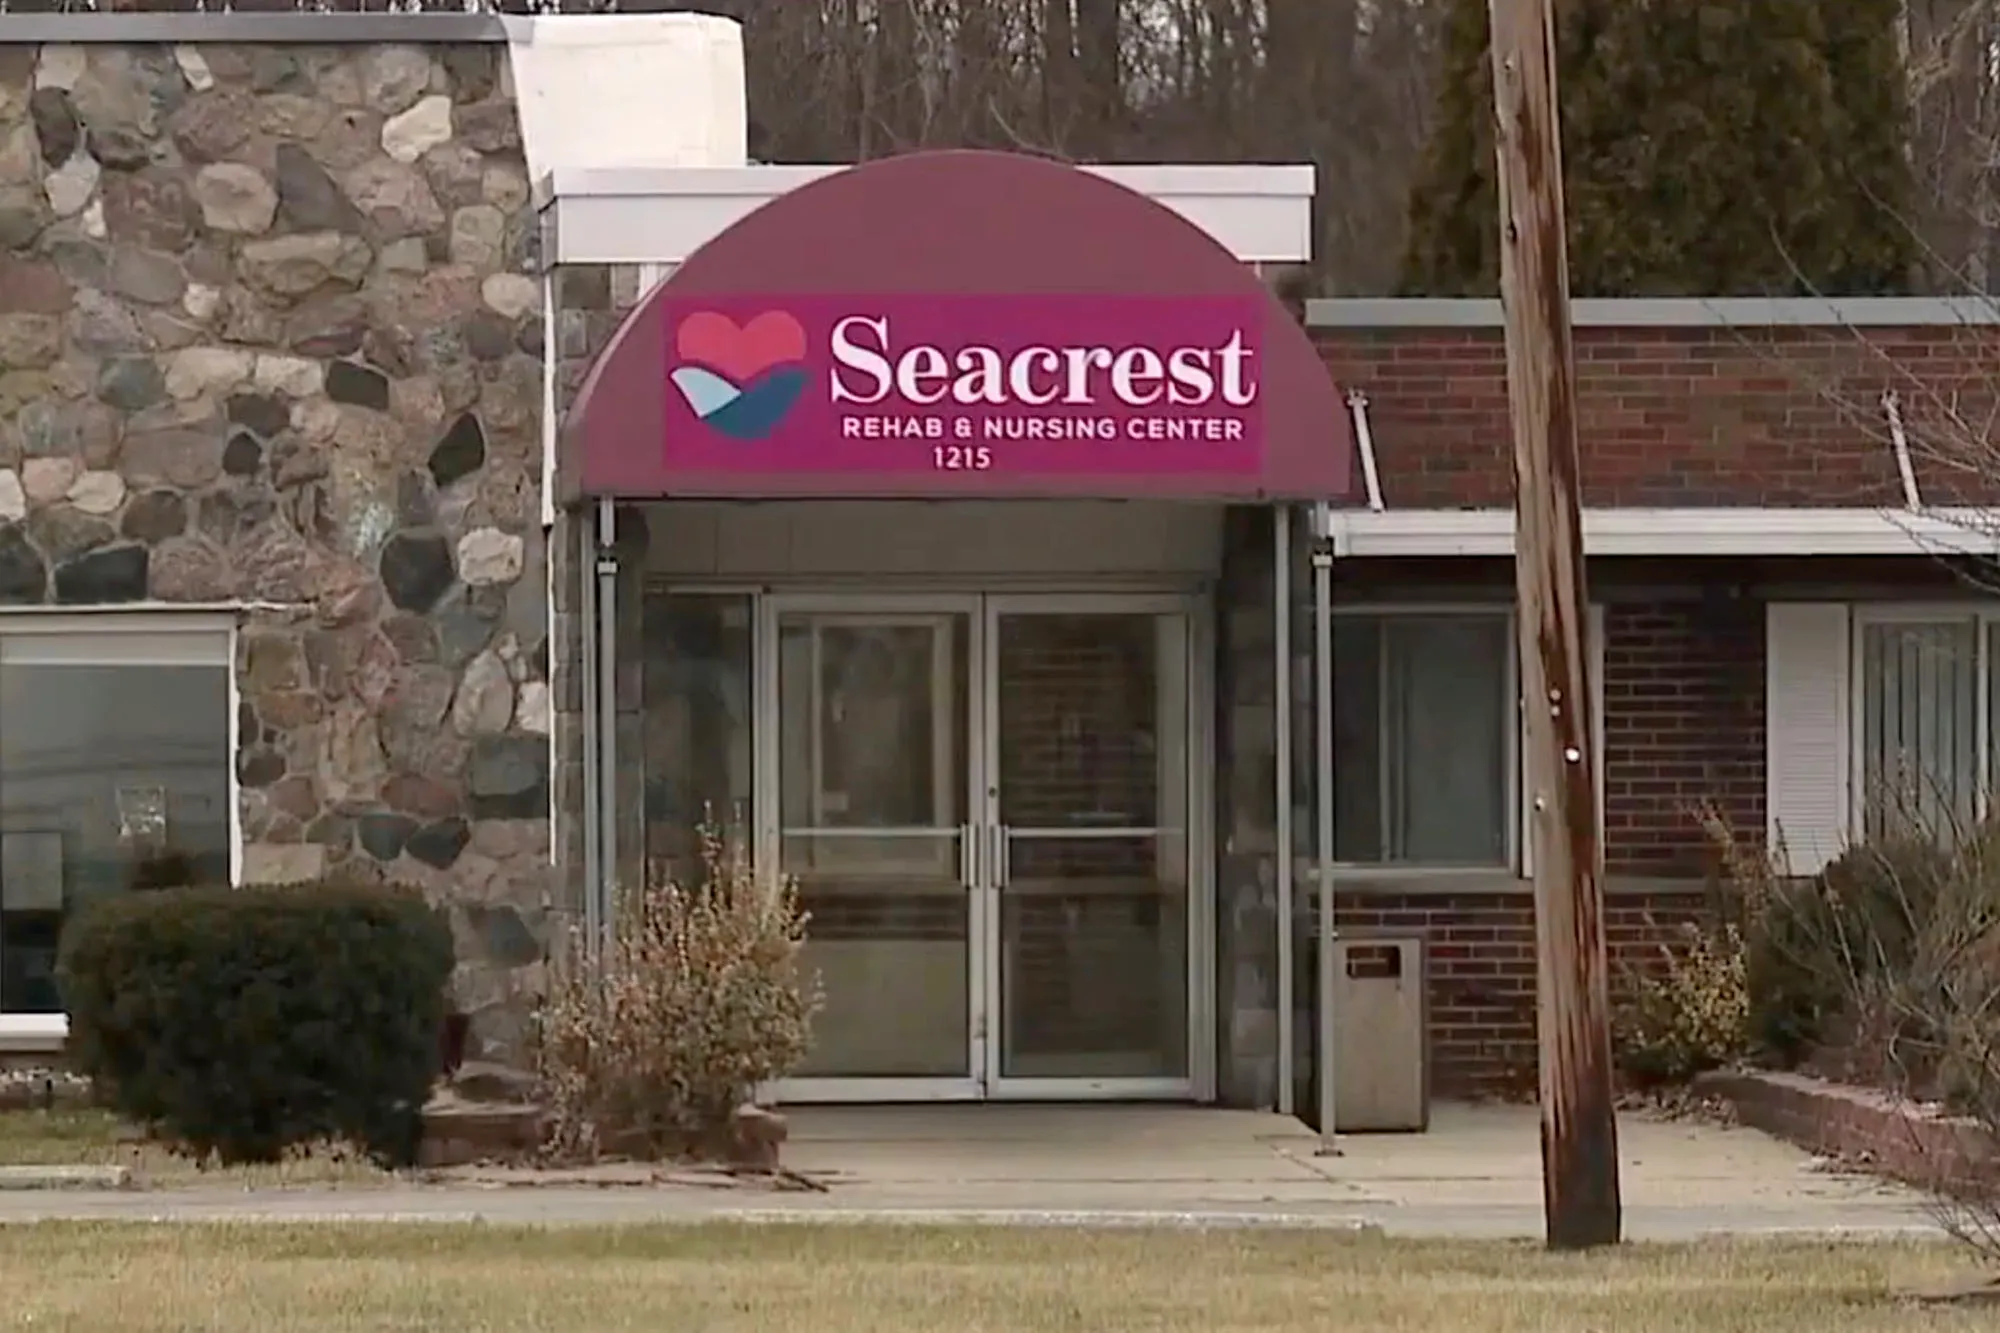
Nestled in Monroe, Michigan, Seacrest Rehab & Nursing Center offers a meticulous approach to selecting staff, recognizing that these individuals form the bedrock of the exceptional care they provide. These dedicated professionals go above and beyond, offering not just physical assistance but also emotional and spiritual support to residents. This holistic approach ensures that seniors receive comprehensive care, catering to their long-term needs, respite requirements, hospice support, and subacute rehabilitation.
Seacrest goes the extra mile by offering specialized services like an in-house dialysis unit, stroke rehabilitation, pain management, orthopedic rehab, wound care, and memory care. Their multifaceted approach addresses a wide range of conditions, providing families with the assurance that their loved ones are in capable hands. What truly sets this community apart is the genuine connections established between the compassionate staff and residents. These meaningful relationships create a warm, supportive atmosphere, making Seacrest Rehab & Nursing Center a trusted choice for families seeking a nursing home with memory care.

(734) 242-4848

Quality ratings

Measured by Centers for Medicare & Medicaid Services (CMS)

Overall rating Info The Overall CMS Rating combines results from health inspections, staffing levels and quality measures. Health inspections carry the most weight. Staffing and quality scores can increase or decrease the final rating based on performance compared to state and national standards.
4/5
Michigan average: 3.1/5
Health Inspection Info Based on the results of the facility's three most recent standard inspections and any complaint investigations. CMS reviews the number, scope, and severity of deficiencies, with more recent findings weighted more heavily.
4/5
Michigan average: 2.8/5
Staffing Info Measures average nursing staff hours per resident per day, including Registered Nurses (RNs) and total nursing staff. Ratings are adjusted based on the level of care residents require and are compared to state and national benchmarks.
2/5
Michigan average: 3.5/5
Quality Measures Info Based on clinical and physical health indicators reported to CMS, such as hospital readmissions, falls, pressure ulcers, and improvements in mobility. These measures reflect how well residents' health needs are being managed.
3/5
Michigan average: 3.8/5

Nursing care per resident

Info This shows how many total hours of nursing staff time are available per resident each day. Higher numbers usually mean more staff support.
3h 41m per day

This home provides 14% less nursing time per resident than the Michigan average.

Michigan average: 4h 18m per day

Staffing hours breakdown

Info Hours of care per resident per day, broken down by staff type. Data from CMS Medicare.
Staff type Facility State avg National avg
Registered Nurse (RN) Info Registered nurse hours per resident per day. 15m per day 46m per day 41m per day
Nurse Aide Info Nurse aide hours per resident per day. 2h 9m per day 2h 23m per day 2h 21m per day
Total Nursing (Weekend) Info Total number of nurse staff hours per resident per day on weekends. 3h 0m per day 3h 31m per day 3h 26m per day
Physical Therapist Info Physical therapist staff hours per resident per day. 3m per day 4m per day 4m per day
RN (Weekend) Info Registered nurse hours per resident per day on weekends. 7m per day 29m per day 29m per day

Capacity and availability

Medium-capacity home

Offers a balance of services and community atmosphere.

Total beds 150

This home usually has availability

Lower occupancy suggests more openings may be available.

Lower demand than the Michigan average
Occupancy rate 44.6%
Residents per day (avg) 88
Occupancy rate
44.6%
Residents per day (avg)
88

Who this home usually serves

TYPE OF STAY

Mix of rehab and long-term care

This home supports both short-term rehab and long-term care, with residents staying for a wide range of durations.

Breakdown by payment type

Medicare

33% of new residents, usually for short-term rehab.

Typical stay 1 - 2 months

Private pay

51% of new residents, often for short stays.

Typical stay 18 days

Medicaid

16% of new residents, often for long-term daily care.

Typical stay 2 years

Finances and operations

Privately-owned community
Operated by a business corporation.
Home revenue
$7.6M
Operating loss
-$1.1M
Privately-owned community Operated by a business corporation.
Home revenue
$7,632,932.00
Operating loss
$-1,056,349.00
Payroll costs Info The portion of the home's budget spent on staff, including nurses, caregivers, and other employees who support care and operations.
$3.8M
49.6% of revenue
Other operating costs Info All remaining costs needed to run the home, such as food, utilities, building maintenance, supplies and administrative expenses.
$4.9M
Total costs $8.7M
Contact Seacrest Rehabilitation and Nursing Center

Health Inspection History

Inspections
Total health inspections 4

Michigan average 6.5


Last Health inspection on Nov 2024

Total health citations 17

Michigan average 33.5

Citations per inspection
4.25

Michigan average 5.18


Health citations are formal notices following inspections when they fail to comply with safety and care standards.

13 of 17 citations resulted from standard inspections; 1 of 17 resulted from complaint investigations; and 3 of 17 came from combined inspections (standard and complaint).

Breakdown of citation severity (last 3 years)
Critical Health citations More info 0
100% better than Michigan average

Michigan average: 0.3


Serious Health citations More info 0
100% better than Michigan average

Michigan average: 1.9

0 critical citations More info Michigan average: 0.3

0 serious citations More info Michigan average: 1.9

17 moderate citations More info Michigan average: 30.8

0 minor citations More info Michigan average: 0.5
Citations history (last 3 years)
Environmental moderate citation Info Issues related to building safety, cleanliness, maintenance, and overall living conditions. Nov 15, 2024
Corrected

Nutrition moderate citation Info Issues related to food quality, meal service, and resident's nutritional needs. Nov 15, 2024
Corrected

Quality of Care moderate citation Info Issues related to how well residents receive appropriate treatment and support for their medical and daily care needs. Nov 15, 2024
Corrected

Care Planning moderate citation Info Issues related to creating and updating personalized care plans for residents based on their needs and conditions. Jun 18, 2024
Corrected

Compare Memory Care around Monroe The information below is reported by the Michigan Department of Licensing and Regulatory Affairs (LARA).

Seacrest Rehabilitation and Nursing Center
NH

Nursing Home Licensed facility providing 24/7 skilled nursing care for residents with complex, ongoing medical needs. Staffed by RNs, LPNs, and CNAs. Inspected and star-rated annually by CMS. Accepts Medicare (short-term rehab) and Medicaid (long-term care).

AL

Assisted Living A licensed, long-term care setting for seniors or individuals with disabilities who need help with daily activities — like bathing, dressing, and medication management — but not 24-hour skilled nursing. Offers housing, meals, and around-the-clock support while aiming to maximize resident independence.

Monroe
150
No
-
53
Elderly Solutions
AL

Assisted Living A licensed, long-term care setting for seniors or individuals with disabilities who need help with daily activities — like bathing, dressing, and medication management — but not 24-hour skilled nursing. Offers housing, meals, and around-the-clock support while aiming to maximize resident independence.

MC

Memory Care Secured, specialized care for people living with Alzheimer's or dementia. Staff trained in cognitive impairment, with higher staff-to-resident ratios and an environment designed to reduce confusion and wandering risk.

Monroe
6
No
A+
24
IHM Senior Living Community
AL

Assisted Living A licensed, long-term care setting for seniors or individuals with disabilities who need help with daily activities — like bathing, dressing, and medication management — but not 24-hour skilled nursing. Offers housing, meals, and around-the-clock support while aiming to maximize resident independence.

IL

Independent Living Lifestyle-focused communities for older adults offering dining, activities, and transportation with minimal personal care. Best for active, independent seniors who want community without medical support.

MC

Memory Care Secured, specialized care for people living with Alzheimer's or dementia. Staff trained in cognitive impairment, with higher staff-to-resident ratios and an environment designed to reduce confusion and wandering risk.

NH

Nursing Home Licensed facility providing 24/7 skilled nursing care for residents with complex, ongoing medical needs. Staffed by RNs, LPNs, and CNAs. Inspected and star-rated annually by CMS. Accepts Medicare (short-term rehab) and Medicaid (long-term care).

Monroe
117
No
-
40

Places of interest near Seacrest Rehabilitation and Nursing Center

Address 1.6 miles from city center — 15.88 miles to nearest hospital (Oakwood Southshore Medical Center Pth)

Address 1215 N Telegraph Rd, Monroe, MI 48162

Calculate Travel Distance to Seacrest Rehabilitation and Nursing Center

Add your location

Address

Staffing Data (Q2 2025)

This data corresponds to Q2 2025 and is based on CMS Payroll-Based Journal.

Total staff 104
Employees 88
Contractors 16
Staff to resident ratio 1.21:1
31% worse than Michigan average

Michigan average ratio: 1.75:1

Avg staff/day 42
Average shift 8.3 hours
5% better than Michigan average

Michigan average: 7.9 hours

Total staff hours (quarter) 31,593
Nursing staff breakdown
Registered Nurse

Manages medical care and health needs.

Total count 7
Average shift length Info Average shift length. Calculated as total hours divided by days worked and average staff per day. 9.7 hours

This role is partially covered by contractors.

Licensed Practical Nurse

Assists with medical care and medications.

Total count 20
Average shift length Info Average shift length. Calculated as total hours divided by days worked and average staff per day. 8.5 hours

No contractors work on this role.

Certified Nursing Assistant

Helps with daily care and mobility.

Total count 49
Average shift length Info Average shift length. Calculated as total hours divided by days worked and average staff per day. 8.9 hours

No contractors work on this role.

Contractor staffing

Total hours from contractors

6.9%

2,172 contractor hours this quarter

Physical Therapy Assistant: 3 Physical Therapy Aide: 3 Respiratory Therapy Technician: 3 Speech Language Pathologist: 2 Occupational Therapy Aide: 1 Medical Director: 1 Registered Nurse: 1 Qualified Social Worker: 1 Occupational Therapy Assistant: 1
Staff by category
Certified Nursing Assistant4904916,77091100%8.9
Licensed Practical Nurse200207,29391100%8.5
Other Dietary Services Staff8082,44791100%7.5
Registered Nurse6178737380%9.7
Occupational Therapy Aide2138076673%5.9
Speech Language Pathologist0225236268%8
Physical Therapy Assistant0334976774%7.3
Clinical Nurse Specialist1014956167%8.1
Respiratory Therapy Technician0334736268%7.2
Administrator1014485662%8
Physical Therapy Aide0334075965%6.9
Nurse Practitioner1013894853%8.1
Qualified Social Worker0111003943%2.6
Occupational Therapy Assistant011581011%5.8
Medical Director011131314%1
49 Certified Nursing Assistant
% of Days 100%
20 Licensed Practical Nurse
% of Days 100%
8 Other Dietary Services Staff
% of Days 100%
7 Registered Nurse
% of Days 80%
3 Occupational Therapy Aide
% of Days 73%
2 Speech Language Pathologist
% of Days 68%
3 Physical Therapy Assistant
% of Days 74%
1 Clinical Nurse Specialist
% of Days 67%
3 Respiratory Therapy Technician
% of Days 68%
1 Administrator
% of Days 62%
3 Physical Therapy Aide
% of Days 65%
1 Nurse Practitioner
% of Days 53%
1 Qualified Social Worker
% of Days 43%
1 Occupational Therapy Assistant
% of Days 11%
1 Medical Director
% of Days 14%

Facility Characteristics

Source: CMS Long-Term Care Facility Characteristics (Data as of Jan 2026)

Total census
86 residents
Residents by payment source
Medicare
3 residents (3.5%)
Medicaid
69 residents (80.2%)
Private pay or other
14 residents (16.3%)
Programs & Services
Residents' Group

Residents meet regularly to discuss policies, care quality, and activities

Family Member Group

Family members meet regularly to discuss policies, care quality, and activities

Active Family Council

Organized group of family members that meets regularly to discuss facility policies, resident care, and activities.

Active Resident Council

Organized group of residents that meets regularly to discuss facility policies, quality of life, and activities.

Quality of care over time

These measures show how residents usually do over time at this home, based on health outcomes and preventive care.

High-risk clinical events score Info A composite score based on pressure ulcers, falls with injury, weight loss, walking ability decline, and activities of daily living decline. 5.9
29% better than Michigan average

Michigan average: 8.4

Functional decline score Info A composite score based on activities of daily living decline, walking ability decline, and incontinence. 11.5
29% better than Michigan average

Michigan average: 16.3

Long-stay resident measures
Above average Michigan avg: 4.2 Info CMS star rating based on long-stay quality measure performance. 5 stars = significantly above average, 1 star = significantly below average.
Need for Help with Daily Activities Increased Info Percent of long-stay residents whose need for help with daily activities has increased 12.8%
In line with Michigan average

Michigan average: 12.5%

Walking Ability Worsened Info Percent of long-stay residents whose ability to move independently worsened 9.3%
39% better than Michigan average

Michigan average: 15.3%

Low Risk Residents with Bowel/Bladder Incontinence Info Percent of low risk long-stay residents who lose control of their bowels or bladder 12.5%
41% better than Michigan average

Michigan average: 21.0%

Falls with Major Injury Info Percent of long-stay residents experiencing one or more falls with major injury 3.2%
In line with Michigan average

Michigan average: 3.2%

High Risk Residents with Pressure Ulcers Info Percent of long-stay high risk residents with pressure ulcers 3.6%
37% better than Michigan average

Michigan average: 5.7%

Urinary Tract Infection Info Percent of long-stay residents with a urinary tract infection 0.3%
80% better than Michigan average

Michigan average: 1.7%

Lost Too Much Weight Info Percent of long-stay residents who lose too much weight 0.7%
87% better than Michigan average

Michigan average: 5.7%

Depressive Symptoms Info Percent of long-stay residents who have depressive symptoms 4.9%
27% worse than Michigan average

Michigan average: 3.9%

Antipsychotic Use Info Percent of long-stay residents who received an antipsychotic medication 25.2%
68% worse than Michigan average

Michigan average: 15.0%

Pneumococcal Vaccine Info Percent of long-stay residents assessed and appropriately given the pneumococcal vaccine 100.0%
5% better than Michigan average

Michigan average: 94.9%

Influenza Vaccine Info Percent of long-stay residents assessed and appropriately given the seasonal influenza vaccine 96.5%
In line with Michigan average

Michigan average: 95.0%

Hospitalizations per 1,000 days Info Number of hospitalizations per 1,000 long-stay resident days. 2.02
16% worse than Michigan average

Michigan average: 1.74

ED visits per 1,000 days Info Number of outpatient emergency department visits per 1,000 long-stay resident days. 4.13
168% worse than Michigan average

Michigan average: 1.54

Short-stay resident measures
Average Michigan avg: 3.1 Info CMS star rating based on short-stay quality measure performance. 5 stars = much above average, 1 star = much below average.
Pneumococcal Vaccine Info Percent of short-stay residents assessed and appropriately given the pneumococcal vaccine 99.1%
20% better than Michigan average

Michigan average: 82.5%

Antipsychotic medication increase Info Percent of short-stay residents who newly received an antipsychotic medication 0.0%
100% better than Michigan average

Michigan average: 1.4%

Influenza Vaccine Info Percent of short-stay residents assessed and appropriately given the seasonal influenza vaccine 94.8%
19% better than Michigan average

Michigan average: 79.5%

Re-hospitalized after SNF stay Info Percentage of short-stay residents who were re-hospitalized after their nursing home admission. 22.3%
8% better than Michigan average

Michigan average: 24.2%

Emergency department visits Info Percentage of short-stay residents who had an outpatient emergency department visit. 19.5%
70% worse than Michigan average

Michigan average: 11.5%

Falls with major injury Info Percentage of SNF residents who experience falls with major injury during their stay. 0.0%
100% better than Michigan average

Michigan average: 0.8%

Ability to care for self at discharge Info Percentage of residents at or above expected ability to care for themselves at discharge. 63.6%
19% better than Michigan average

Michigan average: 53.7%

Successful return to home or community Info Rate of successful return to home or community from a skilled nursing facility. 41.4%
18% worse than Michigan average

Michigan average: 50.6%

Guides for Better Senior Living

Care Cost Calculator: See Prices in Your Area

Nursing Home Data Explorer

Don’t Wait Too Long: 7 Red Flag Signs Your Parent Needs Assisted Living Now

The True Cost of Assisted Living in 2025 – And How Families Are Paying For It

Understanding Senior Living Costs: Pricing Models, Discounts & Financial Assistance

Financial Aid for Michigan Seniors

Get financial aid guidance

MI Choice Waiver

Michigan Medicaid MI Choice Waiver

Age 65+ or disabled, Michigan resident, Medicaid- eligible, nursing home-level care need.

~$2,829/month (300% FBR, individual).

$2,000 (individual), $3,000 (couple).

Delivered through regional waiver agents; waitlists possible.

Home Help Program

Michigan Home Help

Age 65+ or disabled, Michigan resident, Medicaid- eligible or low-income.

~$1,732/month (individual, Medicaid threshold).

$2,000 (individual).

Can hire family caregivers; less intensive than waiver.

Program of All-Inclusive Care for the Elderly (PACE)

Michigan PACE

Age 55+, Michigan resident, nursing home-level care need, safe with PACE support.

~$2,829/month (Medicaid-eligible); private pay option available.

$2,000 (individual), $3,000 (couple).

16 PACE centers (e.g., Ingham, Wayne counties); expanding slowly.

Medicare Savings Program (MSP)

Michigan Medicare Savings Program

Age 65+ or disabled, Michigan resident, Medicare Part A/B.

~$2,510/month (QMB), ~$3,380/month (SLMB), ~$3,598/month (QI)—individual.

$9,430 (individual), $14,130 (couple).

Three tiers; no waitlist; includes Extra Help for Part D.

National Family Caregiver Support Program (NFCSP) Respite

Michigan NFCSP Respite Care

Caregivers of 60+ needing care or 55+ caregivers of others; Michigan resident; functional needs (2+ ADLs).

Prioritizes ~$24,980/year (individual); no strict cap.

Not assessed; need-based.

16 AAAs; prioritizes low-income, rural caregivers.

Senior Community Service Employment Program (SCSEP)

Michigan SCSEP

Age 55+, unemployed, low-income, Michigan resident.

~$1,983/month (125% FPL).

Not specified; income-focused.

Priority for veterans, rural residents; Operation ABLE partnership.

VA Aid and Attendance (A&A) and Housebound Benefits

Michigan VA Aid and Attendance/Housebound

Age 65+ or disabled veteran/spouse, Michigan resident, wartime service, need for ADL help (A&A) or homebound.

Net income < ~$1,984/month (veteran with dependent, A&A); pension offsets income.

~$155,356 (net worth limit).

High veteran demand in urban/rural areas.