Occupancy rate
85%

We arrange tours, appointments, and even moving support so you don’t have to
Thank you for your interest!
Our team will be in touch shortly to help with next steps.
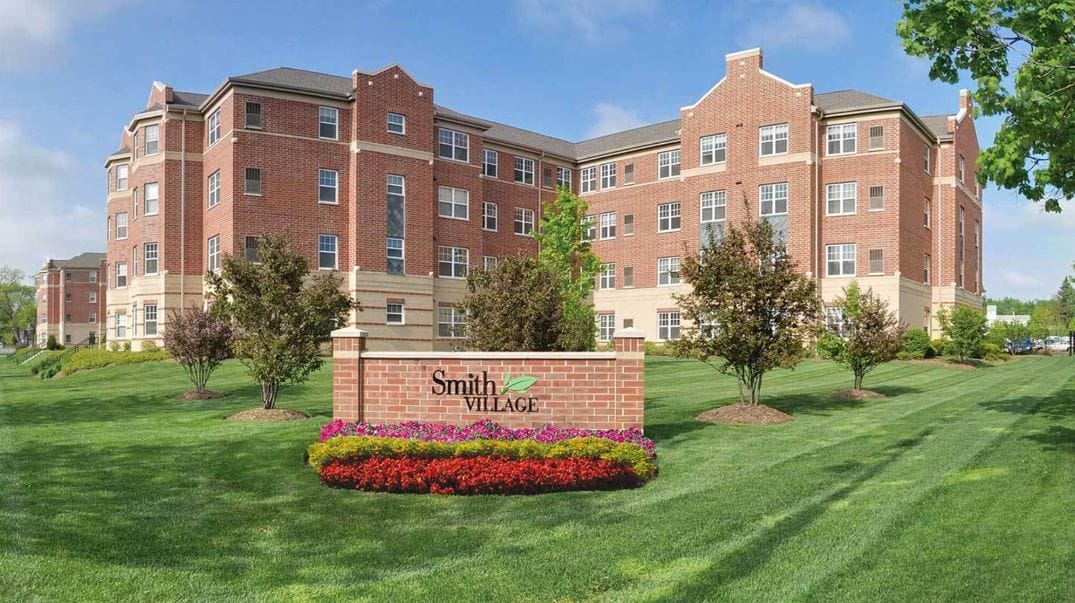

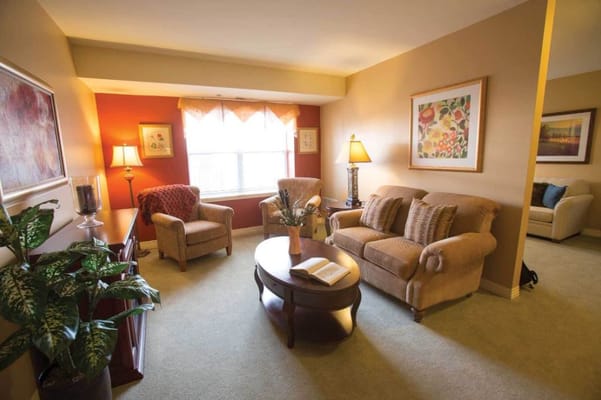
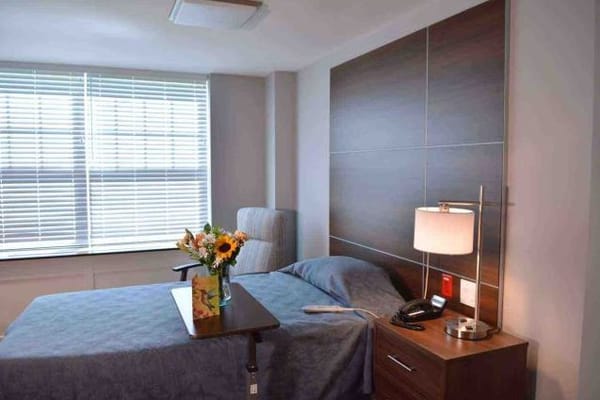
Enjoy a vibrant life without the demands and costs of home ownership with Smith Village, a classic senior living community in Cook County, Chicago, IL, that offers care continuum with their independent living, assisted living, memory care, and skilled nursing services. Make yourself at home in well-designed apartments with an array of one- or two-bedroom apartments to choose from–all featuring a kitchenette, full bathroom with walk-in shower, lots of closet space, and plenty of natural light. Residents never have to lift a finger with maintenance and housekeeping handled by the attentive team.
A licensed nursing team is available on-site any time of the day to ensure residents’ needs are met immediately. The community provides compassionate care services, including assistance with activities of daily living, medication administration, physical, speech, occupational and respiratory therapies, making sure residents have access to necessary care and support even as their needs evolve. A full calendar of recreational, social, cultural and educational programs foster social connection and lifelong learning opportunities, which help residents maintain their abilities while living a fulfilling life.
May offer a more intimate, personalized care environment.
Occupancy is moderate, suggesting balanced demand.
Most residents typically stay for a few weeks or months before returning home or moving on.
87% of new residents, usually for short-term rehab.
13% of new residents, often for short stays.
Smith Village is legally operated by The Washington And Jane Smith Community-beverly.
Key information about the people who lead and staff this community.
Housing Options: 1 Bed / 2 Bed
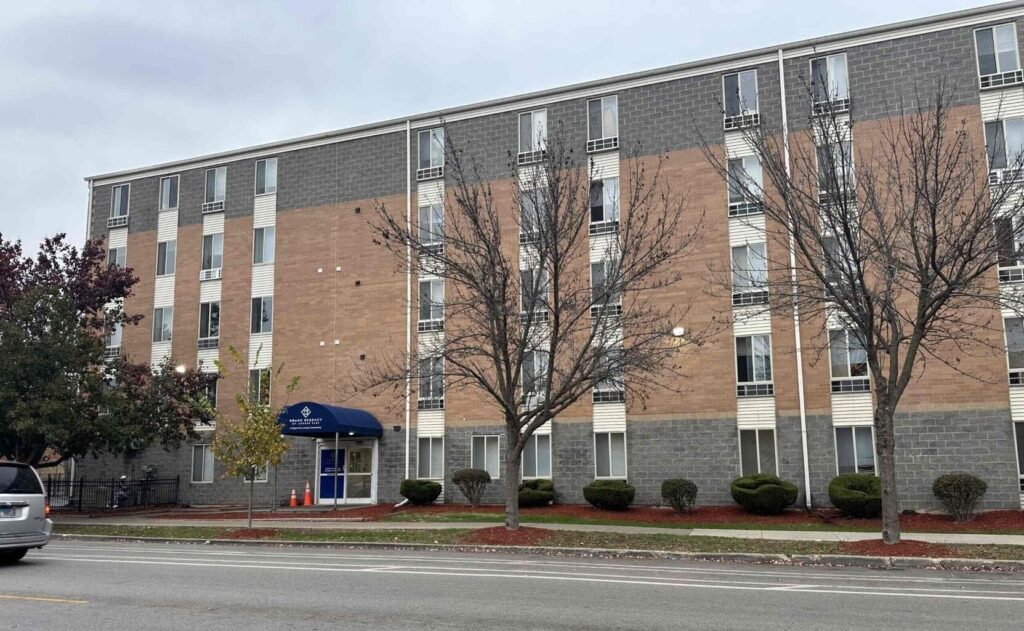
Building Type: Mid-rise
Transportation Services
Fitness and Recreation
In Illinois, the Department of Public Health, Office of Health Care Regulation conducts annual unannounced surveys to assess compliance with state and federal healthcare facility standards.
2 other visits
Deficiencies indicate regulatory issues. A higher number implies the facility had several areas requiring improvement.
Illinois average: 7 deficiencies
The most recent inspection on June 24, 2025, found the facility in compliance with Illinois Assisted Living and Shared Housing regulations and identified no deficiencies. Earlier inspections also showed no deficiencies, indicating consistent adherence to regulatory standards. There were no complaint investigations or enforcement actions listed in the available reports. The facility has maintained a clean record without citations or fines. This suggests a stable compliance history with no recent issues noted.
Illinois average 10.4
Last Health inspection on Feb 2025
Illinois average 36.8
Illinois average 3.68
Health citations are formal notices following inspections when they fail to comply with safety and care standards.
16 of 20 citations resulted from standard inspections; and 4 of 20 resulted from complaint investigations.
Illinois average: 0.7
Illinois average: 3.6
Data sourced from CMS Health Deficiencies reports. Citation severity codes range from A (least serious) to L (most serious). Immediate Jeopardy (J-L) citations indicate situations where the facility's noncompliance has placed residents at risk of death or serious harm.
Assisted Living A licensed, long-term care setting for seniors or individuals with disabilities who need help with daily activities — like bathing, dressing, and medication management — but not 24-hour skilled nursing. Offers housing, meals, and around-the-clock support while aiming to maximize resident independence.
Independent Living Lifestyle-focused communities for older adults offering dining, activities, and transportation with minimal personal care. Best for active, independent seniors who want community without medical support.
Memory Care Secured, specialized care for people living with Alzheimer's or dementia. Staff trained in cognitive impairment, with higher staff-to-resident ratios and an environment designed to reduce confusion and wandering risk.
Nursing Home Licensed facility providing 24/7 skilled nursing care for residents with complex, ongoing medical needs. Staffed by RNs, LPNs, and CNAs. Inspected and star-rated annually by CMS. Accepts Medicare (short-term rehab) and Medicaid (long-term care).
Memory Care Secured, specialized care for people living with Alzheimer's or dementia. Staff trained in cognitive impairment, with higher staff-to-resident ratios and an environment designed to reduce confusion and wandering risk.
Respite Care Short-term temporary care — days to weeks — to give family caregivers a break. Full care provided during the stay. Often used after hospitalization or to trial a facility before a permanent placement decision.
Memory Care Secured, specialized care for people living with Alzheimer's or dementia. Staff trained in cognitive impairment, with higher staff-to-resident ratios and an environment designed to reduce confusion and wandering risk.
Memory Care Secured, specialized care for people living with Alzheimer's or dementia. Staff trained in cognitive impairment, with higher staff-to-resident ratios and an environment designed to reduce confusion and wandering risk.
Assisted Living A licensed, long-term care setting for seniors or individuals with disabilities who need help with daily activities — like bathing, dressing, and medication management — but not 24-hour skilled nursing. Offers housing, meals, and around-the-clock support while aiming to maximize resident independence.
Independent Living Lifestyle-focused communities for older adults offering dining, activities, and transportation with minimal personal care. Best for active, independent seniors who want community without medical support.
Memory Care Secured, specialized care for people living with Alzheimer's or dementia. Staff trained in cognitive impairment, with higher staff-to-resident ratios and an environment designed to reduce confusion and wandering risk.
![]() 4.2 miles from city center
4.2 miles from city center
Add your location
This data corresponds to Q2 2025 and is based on CMS Payroll-Based Journal.
Illinois average ratio: 1.90:1
Illinois average: 7.6 hours
Manages medical care and health needs.
This role is partially covered by contractors.
Assists with medical care and medications.
This role is partially covered by contractors.
Helps with daily care and mobility.
This role is partially covered by contractors.
Total hours from contractors
9,301 contractor hours this quarter
| Certified Nursing Assistant | 64 | 106 | 170 | 21,756 | 91 | 100% | 7.1 |
| Registered Nurse | 11 | 27 | 38 | 4,883 | 91 | 100% | 7.6 |
| Other Dietary Services Staff | 11 | 0 | 11 | 4,208 | 91 | 100% | 7.3 |
| Physical Therapist | 15 | 0 | 15 | 3,653 | 91 | 100% | 6.3 |
| Licensed Practical Nurse | 5 | 35 | 40 | 2,840 | 91 | 100% | 8.7 |
| Clinical Nurse Specialist | 6 | 0 | 6 | 1,871 | 89 | 98% | 8.3 |
| RN Director of Nursing | 2 | 0 | 2 | 1,133 | 78 | 86% | 8.2 |
| Respiratory Therapy Technician | 0 | 3 | 3 | 752 | 66 | 73% | 6.6 |
| Physical Therapy Aide | 0 | 2 | 2 | 583 | 68 | 75% | 4.8 |
| Speech Language Pathologist | 0 | 4 | 4 | 514 | 74 | 81% | 4.1 |
| Nurse Practitioner | 1 | 0 | 1 | 473 | 63 | 69% | 7.5 |
| Administrator | 1 | 0 | 1 | 465 | 62 | 68% | 7.5 |
| Occupational Therapy Aide | 0 | 1 | 1 | 465 | 62 | 68% | 7.5 |
| Mental Health Service Worker | 1 | 0 | 1 | 396 | 53 | 58% | 7.5 |
| Physical Therapy Assistant | 0 | 2 | 2 | 301 | 63 | 69% | 4.7 |
| Dental Services Staff | 1 | 0 | 1 | 293 | 37 | 41% | 7.9 |
| Qualified Social Worker | 0 | 3 | 3 | 255 | 64 | 70% | 4 |
| Medical Director | 0 | 1 | 1 | 64 | 64 | 70% | 1 |
Source: CMS Long-Term Care Facility Characteristics (Data as of Jan 2026)
Residents meet regularly to discuss policies, care quality, and activities
Family members meet regularly to discuss policies, care quality, and activities
Part of a Continuing Care Retirement Community offering multiple care levels
Organized group of family members that meets regularly to discuss facility policies, resident care, and activities.
Organized group of residents that meets regularly to discuss facility policies, quality of life, and activities.
Data sourced from CMS Long-Term Care Facility Characteristics quarterly report. Payer mix reflects the current resident census by primary payment source.
These measures show how residents usually do over time at this home, based on health outcomes and preventive care.
Illinois average: 9.7
Illinois average: 18.6
Illinois average: 15.5%
Illinois average: 18.4%
Illinois average: 21.6%
Illinois average: 3.4%
Illinois average: 5.3%
Illinois average: 1.8%
Illinois average: 6.5%
Illinois average: 48.1%
Illinois average: 20.2%
Illinois average: 89.2%
Illinois average: 91.6%
Illinois average: 2.05
Illinois average: 2.25
Illinois average: 68.3%
Illinois average: 2.3%
Illinois average: 63.0%
Illinois average: 26.2%
Illinois average: 14.0%
Illinois average: 0.8%
Illinois average: 53.7%
Illinois average: 50.6%
Quality measures are calculated from Minimum Data Set (MDS) assessments. For most measures, lower percentages indicate better care quality.
Federal penalties imposed by CMS for regulatory violations, including civil money penalties (fines) and denials of payment for new Medicare/Medicaid admissions.
Source: CMS Penalties Database (Data as of Jan 2026)
Illinois average: $143K
Illinois average: 3.0
Illinois average: 1.1
Penalties are imposed by CMS for violations of federal nursing home regulations.
Last updated: Jan 2026
Historical financial and operational data for Smith Village based on CMS SNF Cost Reports.
Loading trend charts...
Care Cost Calculator: See Prices in Your Area
Nursing Home Data Explorer
Don’t Wait Too Long: 7 Red Flag Signs Your Parent Needs Assisted Living Now
The True Cost of Assisted Living in 2025 – And How Families Are Paying For It
Understanding Senior Living Costs: Pricing Models, Discounts & Financial Assistance

Touring a community? Use this expert-backed checklist to stay organized, ask the right questions, and find the perfect fit.
We'll send you a PDF version of the touring checklist.