

Total health inspections
4
California average 12.5
Last Health inspection on Apr 2025

We arrange tours, appointments, and even moving support so you don’t have to
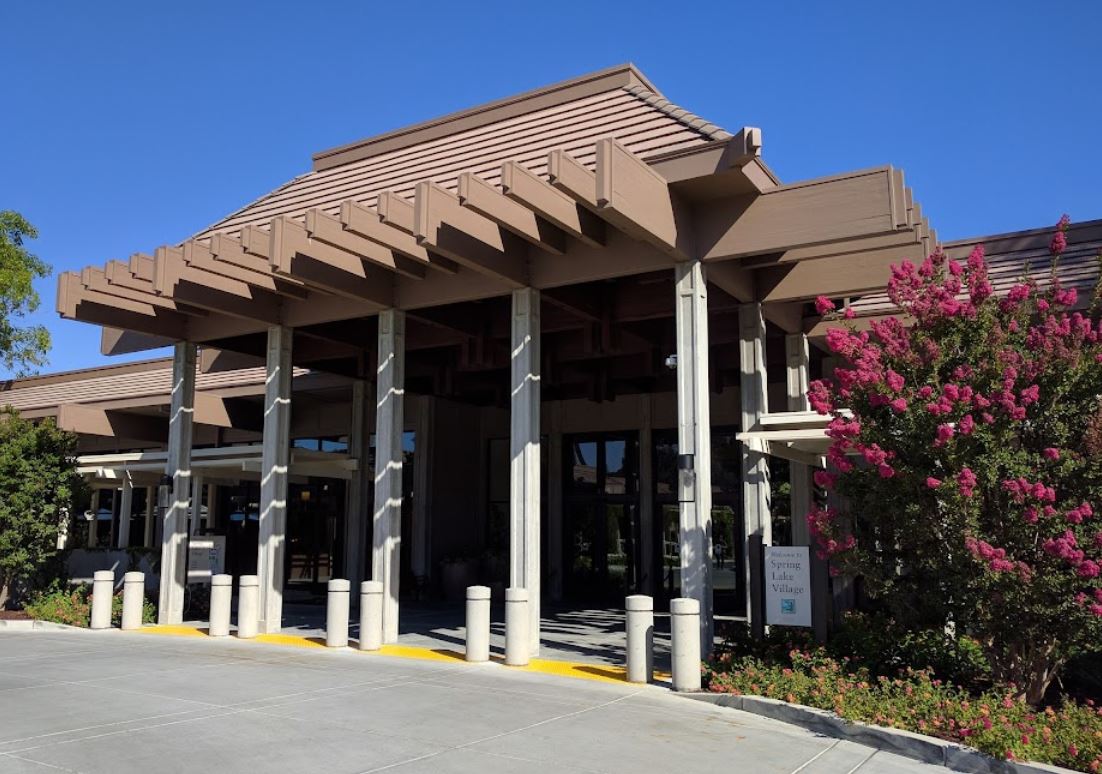

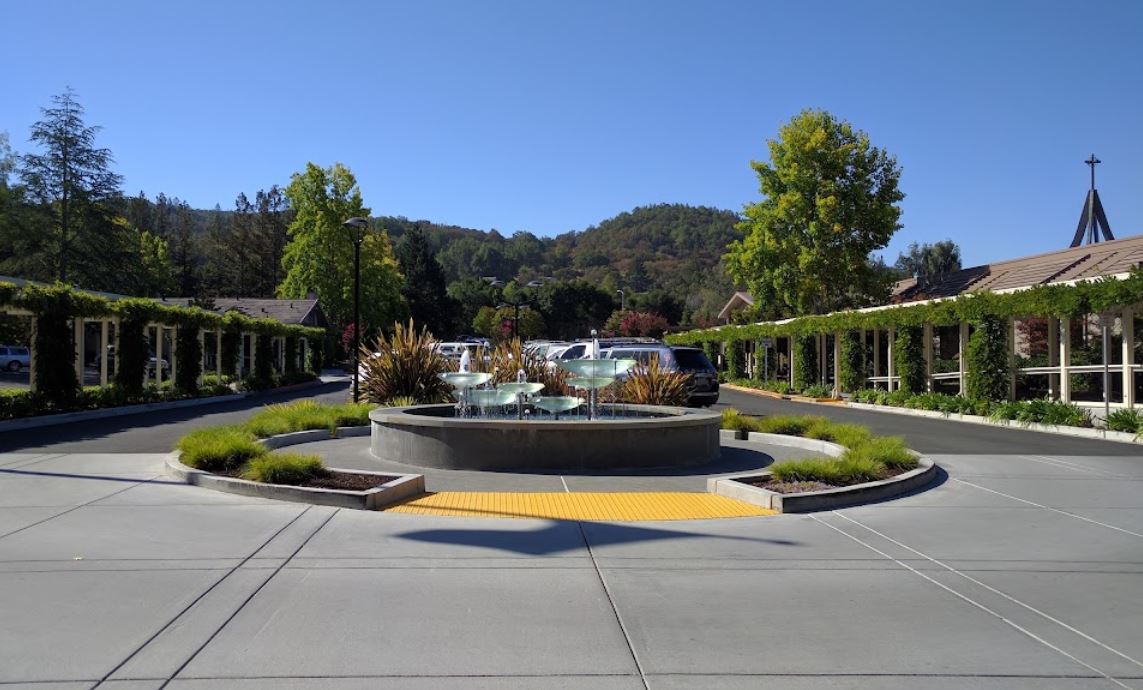
Spring Lake Village is a natural retreat and life plan community in the vibrant setting of Santa Rosa, CA, embodying the essence of a beautiful place to call home. Rooted in the values of active living and positive aging, the community nestled in beautiful Sonoma County offers a dynamic lifestyle surrounded by parks, vineyards, and the tranquility of Santa Rosa Creek. Residents appreciate the diverse array of activities, classes, and intellectual pursuits, fostering a sense of community engagement since 2014.
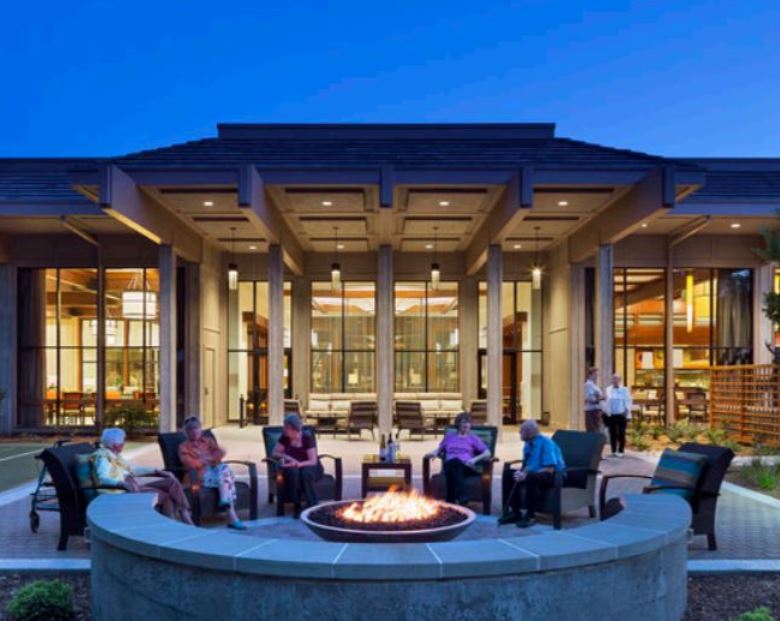
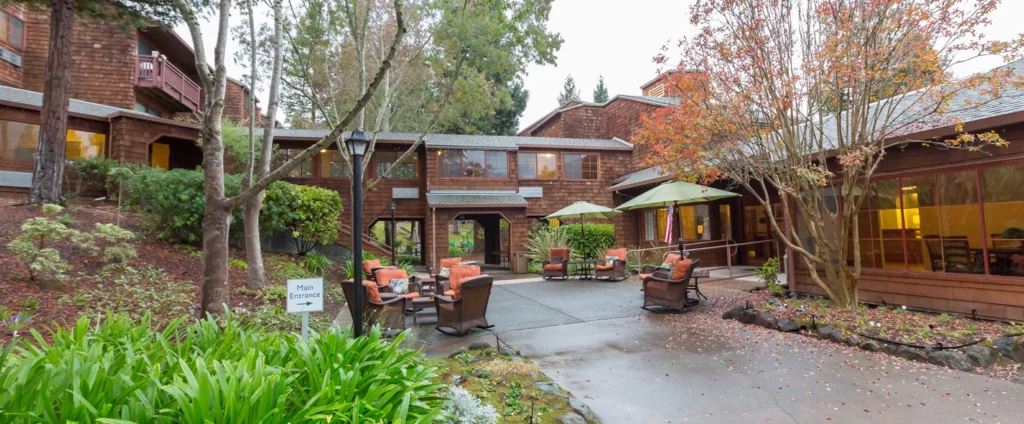
The community boasts a range of amenities and facilities, creating an enriching environment for residents. From the expansive fitness center, indoor pool, and art studios to the theatre, library, and Creekside Lounge, Spring Lake Village offers a comprehensive array of spaces for residents to explore and enjoy. The commitment to well-being extends to services that cater to varying healthcare needs, including independent living, assisted living, skilled nursing care, memory care, and outpatient rehabilitation. The dining experience is a delight, featuring locally sourced meals served in friendly dining rooms or the Village Bistro, accommodating special diets, and offering personalized nutrition consultation. With an award-winning wellness program encompassing physical, mental, and spiritual fitness, Spring Lake Village ensures residents have abundant opportunities for holistic well-being.
 Official CMS rating based on health inspections, staffing and quality measures.
Official CMS rating based on deficiencies found during state health inspections.
Official CMS rating based on nurse staffing hours per resident per day.
Official CMS rating based on clinical outcomes for residents.
Average daily nursing hours per resident (adjusted for acuity). Higher values indicate more nursing time per resident.
Official CMS rating based on health inspections, staffing and quality measures.
Official CMS rating based on deficiencies found during state health inspections.
Official CMS rating based on nurse staffing hours per resident per day.
Official CMS rating based on clinical outcomes for residents.
Average daily nursing hours per resident (adjusted for acuity). Higher values indicate more nursing time per resident.
May provide extensive amenities, services and programs.
Occupancy is moderate, suggesting balanced demand.
Most residents typically stay for a few weeks or months before returning home or moving on.
67% of new residents, usually for short-term rehab.
33% of new residents, often for short stays.
The portion of the home's budget spent on staff, including nurses, caregivers, and other employees who support care and operations.
All remaining costs needed to run the home, such as food, utilities, building maintenance, supplies and administrative expenses.
Spring Lake Village is legally operated by FRONT PORCH COMMUNITIES AND SERVICES.
In California, the Department of Social Services (for assisted living facilities) and the Department of Public Health (for nursing homes) conduct inspections to ensure resident safety and regulatory compliance.
6 total complaint visits
3 other visits
Other visits include regulatory visits that are not routine inspections or complaint investigations, such as administrative check-ins, follow-up reviews, or licensing-related visits.
Investigations can have many visits.
Citations indicate regulatory violations. A higher number implies the facility had several areas requiring improvement.
A violation that poses an immediate risk to resident health or safety, or represents a substantial failure to comply with licensing requirements.
A violation that does not pose an immediate risk to resident health or safety but requires correction to remain in compliance.
Deficiencies indicate regulatory issues. A higher number implies the facility had several areas requiring improvement.
Most inspections found no deficiencies, with several complaint investigations determined to be unsubstantiated. The facility’s most recent report from October 2, 2025, had no deficiencies and addressed a physical abuse incident outside its licensing jurisdiction. The main issues identified in prior inspections involved safety risks from unlocked cleaning carts and missing evacuation chairs reported in August 2024, both considered immediate health and safety concerns. Other findings included minor technical violations such as expired staff certifications and unlocked medication carts, which were promptly addressed. The overall trend shows improvement, with recent reports consistently clean and no enforcement actions or fines listed in the available reports.
Assisted Living For seniors needing help with daily tasks but not full-time nursing.
Assisted Living For seniors needing help with daily tasks but not full-time nursing.
Home Care
Assisted Living For seniors needing help with daily tasks but not full-time nursing.
Nursing Home 24/7 care needed
Assisted Living For seniors needing help with daily tasks but not full-time nursing.
Independent Living For self-sufficient seniors seeking community and minimal assistance.
Memory Care Specialized care for those with Memory Loss, Alzheimer's, or dementia, ensuring safety and support.
Assisted Living For seniors needing help with daily tasks but not full-time nursing.
 Brookdale Chanate
  Brookdale at Home Santa Rosa
 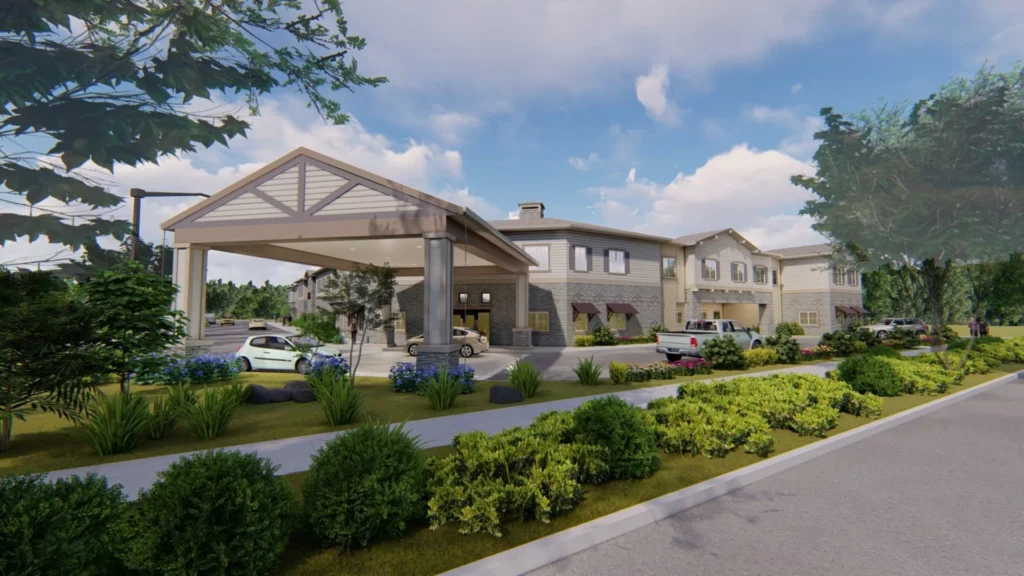 The Lodge at Piner Road
  Spring Lake Village
  Silva Board and Care
![]() 4.6 miles from city center — 1.51 miles to nearest hospital (Annadel Medical Group - Hoen Family Practice)
4.6 miles from city center — 1.51 miles to nearest hospital (Annadel Medical Group - Hoen Family Practice)
![]() 5555 Montgomery Dr, Santa Rosa, CA 95409
5555 Montgomery Dr, Santa Rosa, CA 95409
Add your location
Source: CMS Payroll-Based Journal (Q2 2025)
| Role ⓘ | Count ⓘ | Avg Shift (hrs) ⓘ | Uses Contractors? ⓘ |
|---|---|---|---|
| Registered Nurse | 19 | 8.4 | Yes |
| Licensed Practical Nurse | 18 | 9.1 | Yes |
| Certified Nursing Assistant | 40 | 7.8 | No |
| Role ⓘ | Employees ⓘ | Contractors ⓘ | Total Staff ⓘ | Total Hours ⓘ | Days Worked ⓘ | % of Days ⓘ | Avg Shift (hrs) ⓘ |
|---|---|---|---|---|---|---|---|
| Certified Nursing Assistant | 40 | 0 | 40 | 12,195 | 91 | 100% | 7.8 |
| Licensed Practical Nurse | 15 | 3 | 18 | 4,996 | 91 | 100% | 9.1 |
| Registered Nurse | 11 | 8 | 19 | 2,383 | 91 | 100% | 8.4 |
| Clinical Nurse Specialist | 2 | 0 | 2 | 1,039 | 75 | 82% | 7.7 |
| RN Director of Nursing | 2 | 0 | 2 | 810 | 64 | 70% | 8 |
| Administrator | 2 | 0 | 2 | 714 | 82 | 90% | 7.7 |
| Respiratory Therapy Technician | 0 | 2 | 2 | 535 | 61 | 67% | 7.2 |
| Nurse Practitioner | 1 | 0 | 1 | 512 | 64 | 70% | 8 |
| Mental Health Service Worker | 1 | 0 | 1 | 504 | 63 | 69% | 8 |
| Dietitian | 1 | 0 | 1 | 456 | 57 | 63% | 8 |
| Dental Services Staff | 1 | 0 | 1 | 390 | 52 | 57% | 7.5 |
| Speech Language Pathologist | 0 | 3 | 3 | 365 | 66 | 73% | 5.4 |
| Occupational Therapy Aide | 0 | 2 | 2 | 362 | 58 | 64% | 6.2 |
| Physical Therapy Aide | 0 | 3 | 3 | 281 | 52 | 57% | 4.8 |
| Physical Therapy Assistant | 0 | 7 | 7 | 259 | 53 | 58% | 3.8 |
| Qualified Social Worker | 0 | 4 | 4 | 61 | 34 | 37% | 1.8 |
| Occupational Therapy Assistant | 0 | 5 | 5 | 40 | 7 | 8% | 5.7 |
| Medical Director | 0 | 1 | 1 | 25 | 17 | 19% | 1.5 |
California average 12.5
Last Health inspection on Apr 2025
Health citations are formal notices following inspections when they fail to comply with safety and care standards.
28 of 29 citations resulted from standard inspections; and 1 of 29 resulted from complaint investigations.
California average: 0.4
California average: 1
Data sourced from CMS Health Deficiencies reports. Citation severity codes range from A (least serious) to L (most serious). Immediate Jeopardy (J-L) citations indicate situations where the facility's noncompliance has placed residents at risk of death or serious harm.
Source: CMS Long-Term Care Facility Characteristics (Data as of Jan 2026)
Active councils help families stay involved in care decisions and facility operations.
These measures show how residents usually do over time at this home, based on health outcomes and preventive care.
California average: 6.6
California average: 11.3
California average: 11.1%
California average: 12.0%
California average: 11.3%
California average: 1.7%
California average: 5.0%
California average: 1.2%
California average: 4.2%
California average: 6.7%
California average: 10.1%
California average: 98.5%
California average: 98.2%
California average: 94.0%
California average: 1.5%
California average: 93.2%
Quality measures are calculated from Minimum Data Set (MDS) assessments. For most measures, lower percentages indicate better care quality.
Federal penalties imposed by CMS for regulatory violations, including civil money penalties (fines) and denials of payment for new Medicare/Medicaid admissions.
Source: CMS Penalties Database (Data as of Jan 2026)
California average: $55K
California average: 2.4
California average: 0.5
Penalties are imposed by CMS for violations of federal nursing home regulations.
Last updated: Jan 2026
Historical financial and operational data for Spring Lake Village based on CMS SNF Cost Reports.
Loading trend charts...
Care Cost Calculator: See Prices in Your Area
Nursing Home Data Explorer
Don’t Wait Too Long: 7 Red Flag Signs Your Parent Needs Assisted Living Now
The True Cost of Assisted Living in 2025 – And How Families Are Paying For It
Understanding Senior Living Costs: Pricing Models, Discounts & Financial Assistance
We help families find affordable senior communities and unlock same day discounts, Medicaid, and Medicare options tailored to your needs.
Contact us Today
Touring a community? Use this expert-backed checklist to stay organized, ask the right questions, and find the perfect fit.
We'll send you a PDF version of the touring checklist.


