Spring Lake Village
Nursing Home · Santa Rosa, CA
CMS overall rating Info The Overall CMS Rating is scored from 1 to 5 stars and combines results from health inspections, staffing levels, and quality measures. Health inspections carry the most weight. Staffing and quality scores can increase or decrease the final rating based on performance compared to state and national standards.

Spring Lake Village

Nursing Home · Santa Rosa, CA
CMS overall rating Info The Overall CMS Rating is scored from 1 to 5 stars and combines results from health inspections, staffing levels, and quality measures. Health inspections carry the most weight. Staffing and quality scores can increase or decrease the final rating based on performance compared to state and national standards.
Calculator: See prices in your area
Spring Lake Village accepts Medicare and private pay.

Overview of Spring Lake Village

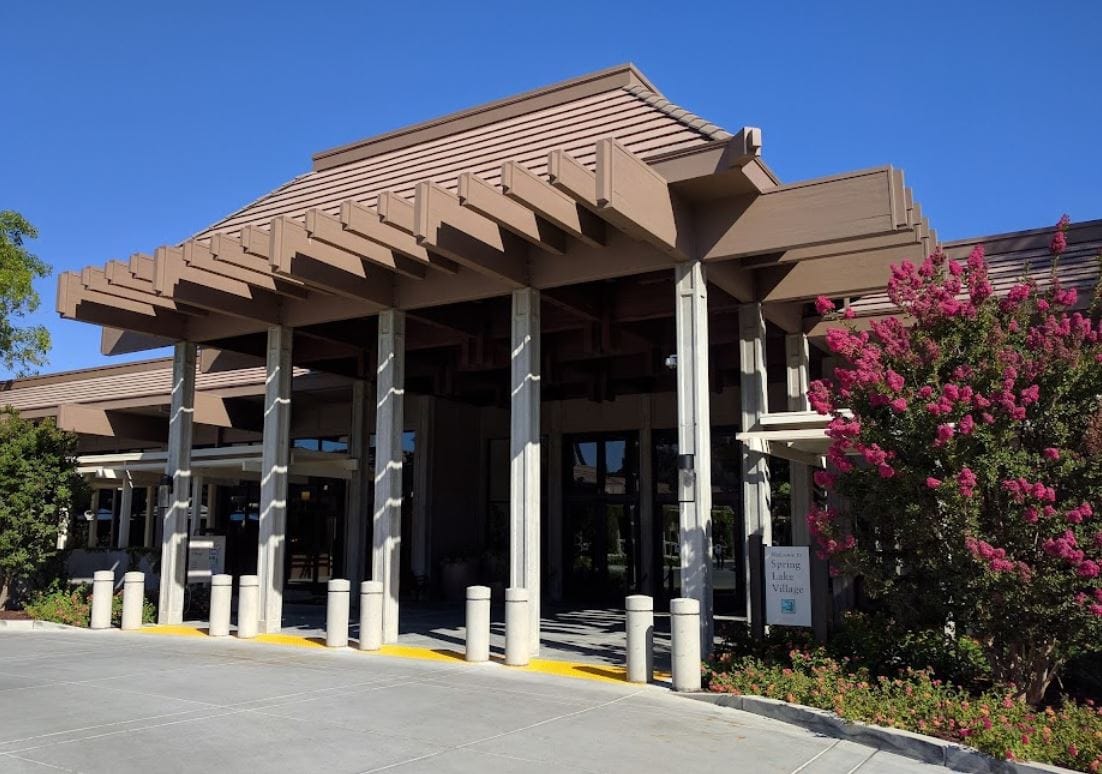
Spring Lake Village is a natural retreat and life plan community in the vibrant setting of Santa Rosa, CA, embodying the essence of a beautiful place to call home. Rooted in the values of active living and positive aging, the community nestled in beautiful Sonoma County offers a dynamic lifestyle surrounded by parks, vineyards, and the tranquility of Santa Rosa Creek. Residents appreciate the diverse array of activities, classes, and intellectual pursuits, fostering a sense of community engagement since 2014.

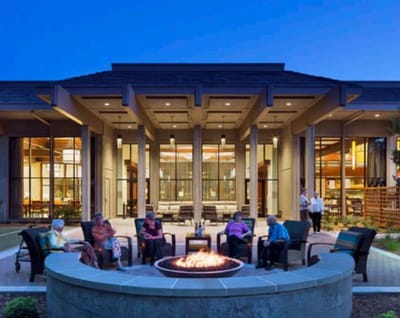
The community boasts a range of amenities and facilities, creating an enriching environment for residents. From the expansive fitness center, indoor pool, and art studios to the theatre, library, and Creekside Lounge, Spring Lake Village offers a comprehensive array of spaces for residents to explore and enjoy. The commitment to well-being extends to services that cater to varying healthcare needs, including independent living, assisted living, skilled nursing care, memory care, and outpatient rehabilitation. The dining experience is a delight, featuring locally sourced meals served in friendly dining rooms or the Village Bistro, accommodating special diets, and offering personalized nutrition consultation. With an award-winning wellness program encompassing physical, mental, and spiritual fitness, Spring Lake Village ensures residents have abundant opportunities for holistic well-being.

(707) 538-8400

Quality ratings

Measured by Centers for Medicare & Medicaid Services (CMS)

Overall rating Info The Overall CMS Rating combines results from health inspections, staffing levels and quality measures. Health inspections carry the most weight. Staffing and quality scores can increase or decrease the final rating based on performance compared to state and national standards.
▲ 38.9% Above CA avg. ▲ 38.9% Above CA avg.Click the badge to see the full State ranking.Click here to see the full State ranking.
Health Inspection Info Based on the results of the facility's three most recent standard inspections and any complaint investigations. CMS reviews the number, scope, and severity of deficiencies, with more recent findings weighted more heavily.
▼ 4.8% Below CA avg. ▼ 4.8% Below CA avg.Click the badge to see the full State ranking.Click here to see the full State ranking.
Staffing Info Measures average nursing staff hours per resident per day, including Registered Nurses (RNs) and total nursing staff. Ratings are adjusted based on the level of care residents require and are compared to state and national benchmarks.
▲ 44.9% Above CA avg. ▲ 44.9% Above CA avg.Click the badge to see the full State ranking.Click here to see the full State ranking.
Quality Measures Info Based on clinical and physical health indicators reported to CMS, such as hospital readmissions, falls, pressure ulcers, and improvements in mobility. These measures reflect how well residents' health needs are being managed.
▲ 17.4% Above CA avg. ▲ 17.4% Above CA avg.Click the badge to see the full State ranking.Click here to see the full State ranking.

Staffing hours breakdown

Info Daily nursing hours per resident by staff type, reported to CMS. Higher is generally better — compare this facility to state and national averages to see where staffing stands.

Hours per resident per day — compared to California state averages

Total nursing care / resident Info This home is ranked 14th out of 346 homes in California. Total adjusted nursing hours per resident per day, combining RN, LPN, and aide time. CMS adjusts this for case-mix so facilities can be fairly compared.
5h 57m per day
Rank #14 / 346Nurse hours — State benchmarkedThis home is ranked 14th out of 346 homes in California. Shows adjusted nurse hours per resident per day benchmarked to the California average, with a ranking across 346 California SNFs. More hours mean more direct care. The national average is about 3.5 hrs; below 3.0 is a red flag.Click the rank badge to see the full State ranking.Click here to see the full State ranking.
This facility California avg (4h 23m per day)
vs California avg
+36%

0 of 6 metrics below state avg

Standout metric Registered Nurse (RN) is +72% above state avg
Staff typeHours / Day / Residentvs state avg
Registered Nurse (RN) Info RNs hold the highest nursing license and can assess residents, interpret test results, and direct care plans. More RN hours per day often signals stronger clinical oversight and faster response to health changes. 1h 7m per day ▲ 72% State avg: 39m per day · National avg: 41m per day
LPN / LVN Info Licensed Practical Nurses (LPNs) or Licensed Vocational Nurses (LVNs) deliver routine hands-on care — medication administration, wound dressing, and monitoring vital signs. They work under RN supervision and make up a large share of daily bedside care. 1h 18m per day ▲ 7% State avg: 1h 13m per day · National avg: 52m per day
Nurse Aide Info Certified Nurse Aides (CNAs) provide the most direct day-to-day assistance: bathing, dressing, feeding, and mobility. Nurse aide hours are typically the largest staffing category and directly affect residents' quality of life. 2h 48m per day ▲ 6% State avg: 2h 38m per day · National avg: 2h 20m per day
Total Nursing (Weekend) Info Combined nursing hours (RN + LPN + Nurse Aide) per resident per day on weekends. Staffing often drops on weekends — this figure reveals whether the facility maintains adequate coverage outside of weekday hours. 4h 36m per day ▲ 13% State avg: 4h 5m per day · National avg: 3h 26m per day
Physical Therapist Info Hours per resident per day provided by licensed Physical Therapists (PTs) or PT Assistants. PT services help residents recover mobility after injury or illness and are especially important for post-acute (short-stay) rehabilitation. 6m per day ▲ 20% State avg: 5m per day · National avg: 4m per day
RN (Weekend) Info Registered nurse hours specifically on weekends. Facilities sometimes reduce RN presence on Saturdays and Sundays — a low weekend RN figure compared to weekday hours can indicate reduced clinical oversight when most administrative staff are absent. 51m per day ▲ 70% State avg: 30m per day · National avg: 28m per day

Capacity and availability

Avg. Length of Stay
114 days
Bed community size
679-bed community Rank #5 / 360Bed count — State benchmarkedThis home is ranked 5th out of 360 homes in California. Shows this facility's certified or reported bed count compared to other California SNFs. Larger communities may offer more amenities, programs, and on-site services for residents and families.Click the rank badge to see the full State ranking.Click here to see the full State ranking.
A large-scale community that may provide a wide range of amenities, services, and structured programs.
Years in operation
32 years in operation Rank #19 / 131Years in operation — State benchmarkedThis home is ranked 19th out of 131 homes in California. Shows how long this facility has been in operation compared to other California SNFs. Longer operating histories may benefit residents, families, and staff.Click the rank badge to see the full State ranking.Click here to see the full State ranking.
A longer operating history, which may indicate experience navigating regulations and delivering ongoing care.
Walk Score
Walk Score: 13 / 100 Rank #339 / 359Walk Score — State benchmarkedThis home is ranked 339th out of 359 homes in California. Shows how walkable this facility's neighborhood is compared to the average Walk Score across California SNFs. Higher scores benefit residents, families, and staff.Click the rank badge to see the full State ranking.Click here to see the full State ranking.
Car-dependent. Most errands require a car, with limited nearby walkable options.
BBB Rating
BBB Rating: A+ (Not Accredited)
An independent rating from the Better Business Bureau based on factors such as complaint history, transparency, and business practices.
How BBB ratings work

About this community

Occupancy

Occupancy rate
3%
Rank #349 / 351Occupancy rate — State benchmarkedThis home is ranked 349th out of 351 homes in California. Shows this facility's occupancy rate versus the California average, with its Statewide rank out of 351. Higher occupancy signals strong local demand and financial stability.Click the rank badge to see the full State ranking.Click here to see the full State ranking.
Lower than the California average: 72.8%
Occupied beds
20 / 679
Average residents per home in California 87 per day

License Details

Facility TypeRcfe-continuing Care Retirement Community
StatusLicensed
IssuanceAugust 7, 1993
CountySonoma
CMS Certification Number555268

Ownership & Operating Entity

Spring Lake Village is legally operated by Front Porch Communities And Services, and administrated by Ferdinand Buot.

Contact Spring Lake Village

Inspection History

In California, the Department of Social Services (for assisted living facilities) and the Department of Public Health (for nursing homes) conduct inspections to ensure resident safety and regulatory compliance.

Inspection Scorecard Info This scorecard compares key inspection, citation, and complaint metrics at this facility against the California state average. Metrics rated ≥15% worse than average are highlighted in red; those ≥15% better are highlighted in green.

Since 2020 vs. California state average
Overall vs. CA average 1 Worse Metrics worse than California average:
• Official inspections (25% above)
9 Better Metrics better than California average:
• Total citations (80% below)
• Serious citations (Type A) (33% below)
• Moderate citations (Type B) (100% below)
• Citations per year (82% below)
• Citations per inspection (97% below)
• Total visits (13% below)
• Complaint visits (54% below)
• Other visits (57% below)
• Complaint investigations (50% below)
Latest Inspection October 2, 2025 Complaint Investigation

Citations Info Citations are formal regulatory issues recorded during state inspections.

This FacilityCA Averagevs. CA Avg
Total citations Info Formal regulatory issues recorded by inspectors across all inspection types. 210 This facility has 80% fewer total citations than a typical California nursing home (2 vs. CA avg 10).↓ 80% better
Serious citations (Type A) Info Violations that pose an immediate risk to resident health or safety. Type A citations are the most serious and typically require prompt corrective action. 23 This facility has 33% fewer serious citations (type a) than a typical California nursing home (2 vs. CA avg 3).↓ 33% better
Moderate citations (Type B) Info Violations that do not pose an immediate risk but still represent a departure from required care or operational standards. 04 This facility has 100% fewer moderate citations (type b) than a typical California nursing home (0 vs. CA avg 4).↓ 100% better
Citations per year Info Average citations per year since 2020. 0.31.7 This facility has 82% fewer citations per year than a typical California nursing home (0.3 vs. CA avg 1.7).↓ 82% better
Citations per inspection Info Average citations per inspection. 0.13.3 This facility has 97% fewer citations per inspection than a typical California nursing home (0.1 vs. CA avg 3.3).↓ 97% better

Inspections & Visits Info State inspections evaluate whether the facility meets health and safety standards.

This FacilityCA Averagevs. CA Avg
Total visits Info Combined count of complaint visits, other regulatory visits, and official scheduled inspections. 1416 This facility has 13% fewer total visits than a typical California nursing home (14 vs. CA avg 16).↓ 13% better
Complaint visits Info On-site visits triggered by formal complaints filed by residents, families, or staff. 613 This facility has 54% fewer complaint visits than a typical California nursing home (6 vs. CA avg 13).↓ 54% better
Other visits Info Regulatory visits that are neither routine inspections nor complaint investigations — administrative check-ins, follow-up reviews, licensing-related visits. 37 This facility has 57% fewer other visits than a typical California nursing home (3 vs. CA avg 7).↓ 57% better
Official inspections Info Routine, scheduled inspections conducted by state regulators to evaluate whether the facility meets federal and state standards. 54 This facility has 25% more official inspections than a typical California nursing home (5 vs. CA avg 4).↑ 25% worse
Complaint investigations Info On-site investigations triggered by complaints filed with California regulators. 510 This facility has 50% fewer complaint investigations than a typical California nursing home (5 vs. CA avg 10).↓ 50% better

Inspection Reports Summary Info An editor-reviewed summary of the themes and findings across this facility's recent inspection reports.

This facility’s inspection record is mostly clean, with no deficiencies found in its two most recent inspections on October 2, 2025, and July 29, 2025. Past citations included two safety-related deficiencies in August 2024 involving unlocked cleaning carts and missing evacuation chairs, but these issues have not recurred. Several complaint investigations between 2024 and 2025 were unsubstantiated, including allegations of mold, medication refusal, and fraudulent billing, showing consistent resolution without citations.

Read the full inspection reports for this facility, including detailed findings and corrective actions.

Show Inspection Reports

Health Inspection History

Inspections Since 2020
Total health inspections 4

California average 12.5


Last Health inspection on Apr 2025

Total health citations
29 Rank #103 / 354Health citations — State benchmarkedThis home is ranked 103rd out of 354 homes in California. Shows this facility's total health deficiency citations benchmarked to the California State average, with a ranking across all 354 CA SNFs. Lower citation counts earn a better rank.Click the rank badge to see the full State ranking.Click here to see the full State ranking.

California average 50.2

Citations per inspection
7.25 Rank #330 / 354Citations per inspection — State benchmarkedThis home is ranked 330th out of 354 homes in California. Shows average deficiency citations per CMS inspection for this facility versus the California mean across 354 SNFs with citation data. Lower is better.Click the rank badge to see the full State ranking.Click here to see the full State ranking.

California average 4.65


Health citations are formal notices following inspections when they fail to comply with safety and care standards.

28 of 29 citations resulted from standard inspections; and 1 of 29 resulted from complaint investigations.

Breakdown of citation severity (last 6 years)
Critical Health citations
0
100% better than California average

California average: 0.4


Serious Health citations
0
100% better than California average

California average: 1

0 critical citations California average: 0.4

0 serious citations California average: 1

29 moderate citations California average: 47.2

0 minor citations California average: 1.5
Citations history (last 6 years)
Abuse/Neglect moderate citation Apr 15, 2025
Corrected

Infection Control moderate citation Feb 13, 2025
Corrected

Infection Control moderate citation Feb 13, 2025
Corrected

Nutrition moderate citation Feb 13, 2025
Corrected

Staffing Data

Reporting period: October 1 – December 31, 2025 (Q4 2025). Source: CMS Payroll-Based Journal report.

Total staff 97
Employees 75
Contractors 22
Staff to resident ratio 2.06:1
2063730% better than California average
California average ratio: 0.00:1 California average ratio: 0.00:1See full California ranking
Avg staff/day 35
Average shift 7.7 hours
0% compared with California average
California average: 7.7 hours California average shift: 7.7 hoursSee full California ranking
Total staff hours (quarter) 24,916

Nursing staff breakdown

Q4 2025 · Oct 1 – Dec 31 More info This data comes from the CMS Payroll-Based Journal report covering October 1 – December 31, 2025.
Registered Nurse

Manages medical care and health needs.

Total count 13
Average shift length Info Average shift length. Calculated as total hours divided by days worked and average staff per day. 8.4 hours

No contractors work on this role.

Licensed Practical Nurse

Assists with medical care and medications.

Total count 10
Average shift length Info Average shift length. Calculated as total hours divided by days worked and average staff per day. 8.9 hours

No contractors work on this role.

Certified Nursing Assistant

Helps with daily care and mobility.

Total count 43
Average shift length Info Average shift length. Calculated as total hours divided by days worked and average staff per day. 7.7 hours

This role is partially covered by contractors.

Contractor staffing

Q4 2025 · Oct 1 – Dec 31 More info This data comes from the CMS Payroll-Based Journal report covering October 1 – December 31, 2025.

Total hours from contractors

7.9%

1,976 contractor hours this quarter

Physical Therapy Assistant: 5 Occupational Therapy Assistant: 4 Certified Nursing Assistant: 3 Physical Therapy Aide: 3 Respiratory Therapy Technician: 3 Medical Director: 1 Speech Language Pathologist: 1 Occupational Therapy Aide: 1 Qualified Social Worker: 1

Staff by category

Q4 2025 · Oct 1 – Dec 31 More info This data comes from the CMS Payroll-Based Journal report covering October 1 – December 31, 2025.
Certified Nursing Assistant4034311,69092100%7.7
Licensed Practical Nurse100104,39992100%8.9
Registered Nurse130132,98792100%8.4
Clinical Nurse Specialist3031,0127582%7.5
Administrator2027508795%7.6
RN Director of Nursing2026116470%8
Nurse Practitioner2025525661%8
Mental Health Service Worker1015046368%8
Occupational Therapy Aide0114605863%7.9
Dietitian1014565762%8
Physical Therapy Assistant0554426571%6.3
Respiratory Therapy Technician0333825661%6.6
Speech Language Pathologist0112445358%4.6
Physical Therapy Aide0332164953%4.2
Dental Services Staff101991314%7.6
Occupational Therapy Assistant0445289%6.4
Qualified Social Worker011342527%1.4
Medical Director011281921%1.5
43 Certified Nursing Assistant
% of Days 100%
10 Licensed Practical Nurse
% of Days 100%
13 Registered Nurse
% of Days 100%
3 Clinical Nurse Specialist
% of Days 82%
2 Administrator
% of Days 95%
2 RN Director of Nursing
% of Days 70%
2 Nurse Practitioner
% of Days 61%
1 Mental Health Service Worker
% of Days 68%
1 Occupational Therapy Aide
% of Days 63%
1 Dietitian
% of Days 62%
5 Physical Therapy Assistant
% of Days 71%
3 Respiratory Therapy Technician
% of Days 61%
1 Speech Language Pathologist
% of Days 58%
3 Physical Therapy Aide
% of Days 53%
1 Dental Services Staff
% of Days 14%
4 Occupational Therapy Assistant
% of Days 9%
1 Qualified Social Worker
% of Days 27%
1 Medical Director
% of Days 21%

Penalties and fines

Federal penalties imposed by CMS for regulatory violations, including civil money penalties (fines) and denials of payment for new Medicare/Medicaid admissions.

Source: CMS Penalties Database (Data as of Jan 2026)

Total fines amount $45K Rank #298 / 354Federal fines — State benchmarkedThis home is ranked 298th out of 354 homes in California. Shows this facility's cumulative CMS federal fine dollars versus the California average among facilities with fines, and where it ranks among 354 skilled nursing facilities in the pool. Lower total dollars mean a better rank.Click the rank badge to see the full State ranking.Click here to see the full State ranking.
18% lower than California average

California average: $55K

Number of fines 1
58% fewer fines than California average

California average: 2.4

Payment Denials Info Serious action where Medicare and/or Medicaid temporarily stops payments for new residents until issues are fixed. 1
102% more payment denials than California average

California average: 0.5

Fines amount comparison
This facility $45K
California average $55K

No penalties in the past 3 years

No civil money penalties or payment denials were reported in the last 3 years.

Quality of care over time

These measures show how residents usually do over time at this home, based on health outcomes and preventive care.

High-risk clinical events score Info A composite score based on pressure ulcers, falls with injury, weight loss, walking ability decline, and activities of daily living decline. 8.5
28% worse than California average

California average: 6.6

Functional decline score Info A composite score based on activities of daily living decline, walking ability decline, and incontinence. 17.8
57% worse than California average

California average: 11.3

Long-stay resident measures
Significantly above average California avg: 4.2 Info CMS star rating based on long-stay quality measure performance. 5 stars = significantly above average, 1 star = significantly below average.
Need for Help with Daily Activities Increased Info Percent of long-stay residents whose need for help with daily activities has increased 11.8%
6% worse than California average

California average: 11.1%

Walking Ability Worsened Info Percent of long-stay residents whose ability to move independently worsened 16.9%
41% worse than California average

California average: 12.0%

Low Risk Residents with Bowel/Bladder Incontinence Info Percent of low risk long-stay residents who lose control of their bowels or bladder 24.7%
119% worse than California average

California average: 11.3%

Falls with Major Injury Info Percent of long-stay residents experiencing one or more falls with major injury 3.9%
133% worse than California average

California average: 1.7%

High Risk Residents with Pressure Ulcers Info Percent of long-stay high risk residents with pressure ulcers 8.1%
63% worse than California average

California average: 5.0%

Urinary Tract Infection Info Percent of long-stay residents with a urinary tract infection 0.0%
100% better than California average

California average: 1.2%

Lost Too Much Weight Info Percent of long-stay residents who lose too much weight 1.9%
55% better than California average

California average: 4.2%

Depressive Symptoms Info Percent of long-stay residents who have depressive symptoms 0.8%
88% better than California average

California average: 6.7%

Antipsychotic Use Info Percent of long-stay residents who received an antipsychotic medication 13.2%
31% worse than California average

California average: 10.1%

Pneumococcal Vaccine Info Percent of long-stay residents assessed and appropriately given the pneumococcal vaccine 98.5%
In line with California average

California average: 98.5%

Influenza Vaccine Info Percent of long-stay residents assessed and appropriately given the seasonal influenza vaccine 91.7%
7% worse than California average

California average: 98.2%

Hospitalizations per 1,000 days Info Number of hospitalizations per 1,000 long-stay resident days. 0.81
64% better than California average

California average: 2.25

ED visits per 1,000 days Info Number of outpatient emergency department visits per 1,000 long-stay resident days. 0.37
77% better than California average

California average: 1.59

Short-stay resident measures
Significantly above average California avg: 3.5 Info CMS star rating based on short-stay quality measure performance. 5 stars = much above average, 1 star = much below average.
Pneumococcal Vaccine Info Percent of short-stay residents assessed and appropriately given the pneumococcal vaccine 90.2%
In line with California average

California average: 94.0%

Antipsychotic medication increase Info Percent of short-stay residents who newly received an antipsychotic medication 1.7%
20% worse than California average

California average: 1.5%

Influenza Vaccine Info Percent of short-stay residents assessed and appropriately given the seasonal influenza vaccine 84.2%
10% worse than California average

California average: 93.2%

Re-hospitalized after SNF stay Info Percentage of short-stay residents who were re-hospitalized after their nursing home admission. 18.5%
20% better than California average

California average: 23.2%

Emergency department visits Info Percentage of short-stay residents who had an outpatient emergency department visit. 6.7%
40% better than California average

California average: 11.2%

Falls with major injury Info Percentage of SNF residents who experience falls with major injury during their stay. 1.6%
106% worse than California average

California average: 0.8%

Ability to care for self at discharge Info Percentage of residents at or above expected ability to care for themselves at discharge. 74.1%
38% better than California average

California average: 53.7%

Successful return to home or community Info Rate of successful return to home or community from a skilled nursing facility. 64.2%
27% better than California average

California average: 50.6%

Breakdown by payment type

Medicare

67% of new residents, usually for short-term rehab.

Typical stay 25 days

Private pay

33% of new residents, often for short stays.

Typical stay 1 - 2 years

Facility Characteristics

Source: CMS Long-Term Care Facility Characteristics (Data as of Jan 2026)

Total residents 47
Medicare
13
27.7% of residents
Private pay or other
34
72.3% of residents
Programs & Services
Residents Group

Residents meet regularly to discuss policies, care quality, and activities

CCRC

Part of a Continuing Care Retirement Community offering multiple care levels

Active Resident Council

Organized group of residents that meets regularly to discuss facility policies, quality of life, and activities.

Finances and operations

Voluntary non-profit community
Home revenue
$46.3M
Surplus of revenue
$1.2M
Voluntary non-profit community
Home revenue
$46.3M Rank #11 / 347Revenue — State benchmarkedThis home is ranked 11th out of 347 homes in California. Shows this facility's annual revenue compared to the California SNF average. Higher revenue generally means more resources for staffing and capital — read alongside Payroll %.Click the rank badge to see the full State ranking.Click here to see the full State ranking.
Surplus of revenue
$1.2M
Payroll costs Info The portion of the home's budget spent on staff, including nurses, caregivers, and other employees who support care and operations. Rank #27 / 347Payroll — State benchmarkedThis home is ranked 27th out of 347 homes in California. Shows total annual staff payroll benchmarked to the California average. Higher payroll investment relative to peers often signals better staffing and less reliance on cheaper contract labor.Click the rank badge to see the full State ranking.Click here to see the full State ranking.
$14.8M
32% of revenue Rank #325 / 347Payroll % — State benchmarkedThis home is ranked 325th out of 347 homes in California. Shows payroll as a percentage of revenue versus the California average. Well-run California SNFs typically land around 56–67% — the top third Statewide. Below 25% may signal understaffing or heavy agency use — read with Staffing ratings.Click the rank badge to see the full State ranking.Click here to see the full State ranking.
Other operating costs Info All remaining costs needed to run the home, such as food, utilities, building maintenance, supplies and administrative expenses.
$30.2M
Total costs $45.0M

Who this home usually serves

TYPE OF STAY

Mostly short-term rehab stays

Most residents typically stay for a few weeks or months before returning home or moving on.

Places of interest near Spring Lake Village

Address 4.6 miles from city center Info Estimated distance in miles from Santa Rosa's city center to Spring Lake Village's address, calculated via Google Maps. — 1.51 miles to nearest hospital (Annadel Medical Group - Hoen Family Practice)

Calculate Travel Distance to Spring Lake Village

Add your location

Address

Financial Assistance for
Nursing Home in California

Spring Lake Village is located in Santa Rosa, California.
Here are the financial assistance programs available to residents in California.

Get Financial aid guidance

Multipurpose Senior Services Program

MSSP (Medi-Cal Waiver)

Age 65+
General California resident, Medi-Cal eligible, nursing home risk.
Income Limits (2025) ~$2,829/month 300% FBR, individual
Asset Limits $2,000 (individual), $3,000 (couple).
CA

County-managed; waitlists possible.

Benefits
In-home support (4-6 hours/day) Respite care (14 days/year) Meals (~$6/meal) Transportation (8 trips/month) Care management

In-Home Supportive Services (IHSS)

California IHSS

Age 65+
General California resident, Medicaid-eligible or low-income.
Income Limits ~$1,732/month individual, Medi-Cal threshold
Asset Limits $2,000 individual
CA

Can hire family as caregivers.

Benefits
Personal care (up to 283 hours/month) Homemaker services Respite (varies)

Multipurpose Senior Services Program (MSSP)

CA MSSP

Age 65+
General California resident, Medi-Cal-eligible, nursing home-eligible but community-capable.
Income Limits ~$2,829/month 300% FBR, individual
Asset Limits $2,000 individual
CA

Available in 38 counties; waitlists common.

Benefits
Case management Respite care (up to 10 days/year) Minor home mods (avg. $500) Adult day care (~$50/day)

Property Tax Postponement Program (PTP)

CA PTP

Age 62+
General California resident, own and live in home, 40% equity.
Income Limits (2025) ~$51,500/year household, adjusted annually
Asset Limits Equity-based; no strict asset cap.
CA

Deferred taxes accrue interest (5% as of 2024); repaid upon sale/death.

Benefits
Property tax deferral (avg. $1,000-$3,000/year, varies by county)

Assisted Living Waiver (ALW)

CA ALW

Age 65+ or disabled
General California resident, Medi-Cal-eligible, nursing home-eligible.
Income Limits ~$2,829/month 300% FBR, individual
Asset Limits $2,000 individual
CA

Available in 15 counties (e.g., LA, Sacramento); waitlists common.

Benefits
Personal care in ALFs (5-7 hours/day) Medication management Social services

California CARES Program

CA CARES

Age
General Caregivers of California residents 60+ needing help with 3+ daily activities; no caregiver age limit.
Income Limits No strict limit; cost-sharing above ~$2,500/month threshold.
Asset Limits Not applicable; need-based.
CA

High demand in urban areas; complements IHSS respite.

Benefits
Respite care (up to 10 days/year) Counseling (4-6 sessions/year) Training (2-3 workshops/year) Supplies (~$200/year)

Frequently Asked Questions about Spring Lake Village

What neighborhood is Spring Lake Village in?

Spring Lake Village is in the Melita neighborhood of Santa Rosa.

Who is the owner of Spring Lake Village?

The legal owner and operator of Spring Lake Village is Front Porch Communities And Services.

Is Spring Lake Village in a walkable area?

Spring Lake Village has a walk score of 13. Car-dependent. Most errands require a car, with limited nearby walkable options.

What is the occupancy rate at Spring Lake Village?

Spring Lake Village's occupancy is 3%.

Who is the administrator of Spring Lake Village?

Ferdinand Buot is the administrator of Spring Lake Village.

How many beds does Spring Lake Village have?

Spring Lake Village has 679 beds.

Has Spring Lake Village had any recent deficiencies or citations?

Spring Lake Village has had 2 recently reported deficiencies.

Guides for Better Senior Living

Care Cost Calculator: See Prices in Your Area

Nursing Home Data Explorer

Don’t Wait Too Long: 7 Red Flag Signs Your Parent Needs Assisted Living Now

The True Cost of Assisted Living in 2025 – And How Families Are Paying For It

Understanding Senior Living Costs: Pricing Models, Discounts & Financial Assistance

Explore Open Rooms
1 Contact details
2 What type of senior care service are you looking for?
3 What budget do you have in mind for senior care?
4 How soon do you need to find care?
5 Additional details

Thank you for your interest!

Our team will be in touch shortly to help with next steps.