Explore Open Rooms

1 Contact details
2 What type of senior care service are you looking for?
3 What budget do you have in mind for senior care?
4 How soon do you need to find care?
5 Additional details

Thank you for your interest!

Our team will be in touch shortly to help with next steps.

Care Home in Cook County

CMS overall rating Info The Overall CMS Rating combines results from health inspections, staffing levels and quality measures. Health inspections carry the most weight. Staffing and quality scores can increase or decrease the final rating based on performance compared to state and national standards.

St Joseph Home For the Elderly

80 W Northwest Hwy, Palatine, IL 60067 View map
Overview of St Joseph Home for the Elderly

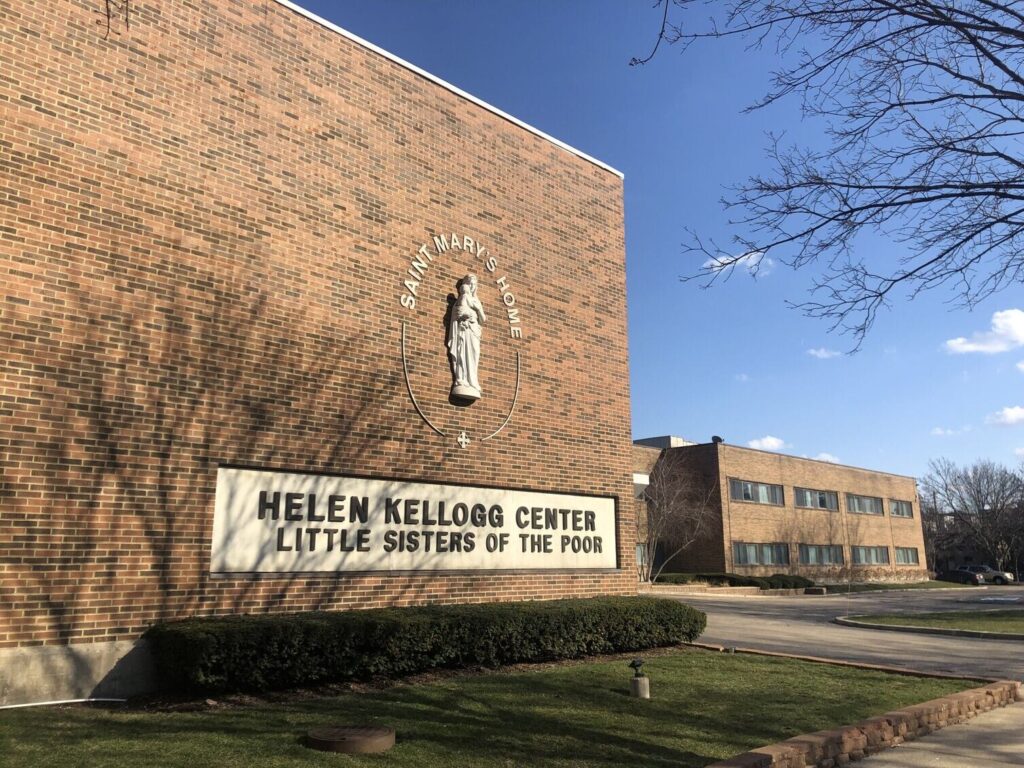
With over 177 years of experience, St Joseph Home for the Elderly is a well-established community in Palatine, IL designed for independent living and assisted living. The community provides a team of loving and excellent caregivers that offer assistance with daily activities like personal care and medication management. Here, residents enjoy the comfort of cozy accommodations set in a loving and supportive environment.

They encourage an active lifestyle with their wide array of enriching activities, pastoral programs, and volunteering opportunities. Here, residents are provided with the best care possible while also having emotional and spiritual enrichment. As a community founded on a genuine commitment to helping those in need, St Joseph Home for the Elderly ensures its residents are well-cared for in an environment that genuinely cares for them.

(847) 358-5700

Quality ratings

Measured by Centers for Medicare & Medicaid Services (CMS)

Overall rating Info The Overall CMS Rating combines results from health inspections, staffing levels and quality measures. Health inspections carry the most weight. Staffing and quality scores can increase or decrease the final rating based on performance compared to state and national standards.
5/5
Illinois average: 2.5/5
Health Inspection Info Based on the results of the facility's three most recent standard inspections and any complaint investigations. CMS reviews the number, scope, and severity of deficiencies, with more recent findings weighted more heavily.
5/5
Illinois average: 2.8/5
Staffing Info Measures average nursing staff hours per resident per day, including Registered Nurses (RNs) and total nursing staff. Ratings are adjusted based on the level of care residents require and are compared to state and national benchmarks.
5/5
Illinois average: 2.1/5
Quality Measures Info Based on clinical and physical health indicators reported to CMS, such as hospital readmissions, falls, pressure ulcers, and improvements in mobility. These measures reflect how well residents' health needs are being managed.
4/5
Illinois average: 2.8/5

Nursing care per resident

Info This shows how many total hours of nursing staff time are available per resident each day. Higher numbers usually mean more staff support.
7h 26m per day

This home provides 140% more nursing time per resident than the Illinois average.

Illinois average: 3h 6m per day

Capacity and availability

Smaller home

May offer a more intimate, personalized care environment.

Total beds 51

This home usually has availability

Lower occupancy suggests more openings may be available.

Lower demand than the Illinois average
Occupancy rate 53.2%
Residents per day (avg) 31
Occupancy rate
53.2%
Residents per day (avg)
31

What does this home offer?

Housing options icon

Housing Options: Private / Semi-Private Rooms

Building type icon
Building type icon

Building Type: 3-story

Dining services icon

Dining Services

Recreational activities icon

Recreational Activities

Housekeeping icon
Housekeeping icon

Housekeeping Services

Types of Care at St Joseph Home For the Elderly

Care Home Assisted Living Independent Living Hospice Care
Contact St Joseph Home For the Elderly

Health Inspection History

Inspections
Total health inspections 1

Illinois average 10.4


Last Health inspection on Nov 2024

Total health citations 5

Illinois average 36.8

Citations per inspection
5

Illinois average 3.68


Health citations are formal notices following inspections when they fail to comply with safety and care standards.

All 5 citations resulted from standard inspections.

Breakdown of citation severity (last 3 years)
Critical Health citations More info 0
100% better than Illinois average

Illinois average: 0.7


Serious Health citations More info 0
100% better than Illinois average

Illinois average: 3.6

0 critical citations More info Illinois average: 0.7

0 serious citations More info Illinois average: 3.6

5 moderate citations More info Illinois average: 32

0 minor citations More info Illinois average: 0.5
Citations history (last 3 years)
Infection Control moderate citation Info Issues related to preventing and controlling infections, including hygiene practices and safety protocols. Nov 15, 2024
Corrected

Nutrition moderate citation Info Issues related to food quality, meal service, and resident's nutritional needs. Nov 15, 2024
Corrected

Pharmacy moderate citation Info Issues related to medication management, including how drugs are stored, administered, and monitored. Nov 15, 2024
Corrected

Pharmacy moderate citation Info Issues related to medication management, including how drugs are stored, administered, and monitored. Nov 15, 2024
Corrected

Compare Care Homes around Cook County The information below is reported by the Illinois Department of Public Health, Office of Health Care Regulation.

Filter by care type
Little Sisters of the Poor St. Mary’s Home
NH

Nursing Home Licensed facility providing 24/7 skilled nursing care for residents with complex, ongoing medical needs. Staffed by RNs, LPNs, and CNAs. Inspected and star-rated annually by CMS. Accepts Medicare (short-term rehab) and Medicaid (long-term care).

AL

Assisted Living A licensed, long-term care setting for seniors or individuals with disabilities who need help with daily activities — like bathing, dressing, and medication management — but not 24-hour skilled nursing. Offers housing, meals, and around-the-clock support while aiming to maximize resident independence.

CH

Care Homes

HC

Home Care Professional care delivered in the person's own home — from companionship and errands to skilled nursing and therapy. Allows seniors to age in place. Medicare covers skilled home health when medically necessary.

IL

Independent Living Lifestyle-focused communities for older adults offering dining, activities, and transportation with minimal personal care. Best for active, independent seniors who want community without medical support.

Chicago (Lincoln Park)
76
No
93
-
Private / Semi-Private Rooms
The Indigo at Elmhurst
CH

Care Homes

MC

Memory Care Secured, specialized care for people living with Alzheimer's or dementia. Staff trained in cognitive impairment, with higher staff-to-resident ratios and an environment designed to reduce confusion and wandering risk.

RC

Respite Care Short-term temporary care — days to weeks — to give family caregivers a break. Full care provided during the stay. Often used after hospitalization or to trial a facility before a permanent placement decision.

Elmhurst
72
No
28
Jaybird Senior Living Inc
Studio
St Joseph Home For the Elderly
NH

Nursing Home Licensed facility providing 24/7 skilled nursing care for residents with complex, ongoing medical needs. Staffed by RNs, LPNs, and CNAs. Inspected and star-rated annually by CMS. Accepts Medicare (short-term rehab) and Medicaid (long-term care).

AL

Assisted Living A licensed, long-term care setting for seniors or individuals with disabilities who need help with daily activities — like bathing, dressing, and medication management — but not 24-hour skilled nursing. Offers housing, meals, and around-the-clock support while aiming to maximize resident independence.

CH

Care Homes

HC

Home Care Professional care delivered in the person's own home — from companionship and errands to skilled nursing and therapy. Allows seniors to age in place. Medicare covers skilled home health when medically necessary.

IL

Independent Living Lifestyle-focused communities for older adults offering dining, activities, and transportation with minimal personal care. Best for active, independent seniors who want community without medical support.

Palatine
51
No
69
-
Private / Semi-Private Rooms
WaveBridge Senior Care Home
AL

Assisted Living A licensed, long-term care setting for seniors or individuals with disabilities who need help with daily activities — like bathing, dressing, and medication management — but not 24-hour skilled nursing. Offers housing, meals, and around-the-clock support while aiming to maximize resident independence.

CH

Care Homes

MC

Memory Care Secured, specialized care for people living with Alzheimer's or dementia. Staff trained in cognitive impairment, with higher staff-to-resident ratios and an environment designed to reduce confusion and wandering risk.

Crete
-
No
10
-
Private / Shared Rooms

Places of interest near St Joseph Home For the Elderly

Address 1.3 miles from city center

Address 80 W Northwest Hwy, Palatine, IL 60067

Calculate Travel Distance to St Joseph Home For the Elderly

Add your location

Address

Staffing Data (Q2 2025)

This data corresponds to Q2 2025 and is based on CMS Payroll-Based Journal.

Total staff 76
Employees 59
Contractors 17
Staff to resident ratio 2.45:1
29% better than Illinois average

Illinois average ratio: 1.90:1

Avg staff/day 27
Average shift 7.2 hours
5% worse than Illinois average

Illinois average: 7.6 hours

Total staff hours (quarter) 17,738
Nursing staff breakdown
Registered Nurse

Manages medical care and health needs.

Total count 21
Average shift length Info Average shift length. Calculated as total hours divided by days worked and average staff per day. 7.1 hours

This role is partially covered by contractors.

Licensed Practical Nurse

Assists with medical care and medications.

Total count 11
Average shift length Info Average shift length. Calculated as total hours divided by days worked and average staff per day. 6.7 hours

This role is partially covered by contractors.

Certified Nursing Assistant

Helps with daily care and mobility.

Total count 32
Average shift length Info Average shift length. Calculated as total hours divided by days worked and average staff per day. 7.4 hours

This role is partially covered by contractors.

Contractor staffing

Total hours from contractors

5.2%

917 contractor hours this quarter

Registered Nurse: 9 Certified Nursing Assistant: 2 Licensed Practical Nurse: 2 Other Dietary Services Staff: 2 Occupational Therapy Aide: 1 Medical Director: 1
Staff by category
Certified Nursing Assistant302329,49691100%7.4
Registered Nurse129212,38491100%7.1
Licensed Practical Nurse92112,30391100%6.7
Other Dietary Services Staff0226178695%4.7
Dietitian1015036470%7.9
Administrator1014725965%8
Nurse Practitioner1014445864%7.7
RN Director of Nursing1014435864%7.6
Clinical Nurse Specialist1014195459%7.8
Therapeutic Recreation Specialist2023754549%8.2
Dental Services Staff1012273943%5.8
Occupational Therapy Aide011472022%2.4
Medical Director0111033%3.2
32 Certified Nursing Assistant
% of Days 100%
21 Registered Nurse
% of Days 100%
11 Licensed Practical Nurse
% of Days 100%
2 Other Dietary Services Staff
% of Days 95%
1 Dietitian
% of Days 70%
1 Administrator
% of Days 65%
1 Nurse Practitioner
% of Days 64%
1 RN Director of Nursing
% of Days 64%
1 Clinical Nurse Specialist
% of Days 59%
2 Therapeutic Recreation Specialist
% of Days 49%
1 Dental Services Staff
% of Days 43%
1 Occupational Therapy Aide
% of Days 22%
1 Medical Director
% of Days 3%

Facility Characteristics

Source: CMS Long-Term Care Facility Characteristics (Data as of Jan 2026)

Total census
31 residents
Residents by payment source
Medicare
2 residents (6.5%)
Medicaid
27 residents (87.1%)
Private pay or other
2 residents (6.5%)
Programs & Services
Residents' Group

Residents meet regularly to discuss policies, care quality, and activities

Active Resident Council

Organized group of residents that meets regularly to discuss facility policies, quality of life, and activities.

Quality of care over time

These measures show how residents usually do over time at this home, based on health outcomes and preventive care.

High-risk clinical events score Info A composite score based on pressure ulcers, falls with injury, weight loss, walking ability decline, and activities of daily living decline. 4.6
52% better than Illinois average

Illinois average: 9.7

Functional decline score Info A composite score based on activities of daily living decline, walking ability decline, and incontinence. 12.3
34% better than Illinois average

Illinois average: 18.6

Long-stay resident measures
Need for Help with Daily Activities Increased Info Percent of long-stay residents whose need for help with daily activities has increased 9.7%
38% better than Illinois average

Illinois average: 15.5%

Walking Ability Worsened Info Percent of long-stay residents whose ability to move independently worsened 4.9%
73% better than Illinois average

Illinois average: 18.4%

Low Risk Residents with Bowel/Bladder Incontinence Info Percent of low risk long-stay residents who lose control of their bowels or bladder 22.4%
In line with Illinois average

Illinois average: 21.6%

Falls with Major Injury Info Percent of long-stay residents experiencing one or more falls with major injury 2.4%
28% better than Illinois average

Illinois average: 3.4%

High Risk Residents with Pressure Ulcers Info Percent of long-stay high risk residents with pressure ulcers 2.7%
50% better than Illinois average

Illinois average: 5.3%

Urinary Tract Infection Info Percent of long-stay residents with a urinary tract infection 0.9%
53% better than Illinois average

Illinois average: 1.8%

Lost Too Much Weight Info Percent of long-stay residents who lose too much weight 3.6%
45% better than Illinois average

Illinois average: 6.5%

Depressive Symptoms Info Percent of long-stay residents who have depressive symptoms 5.0%
90% better than Illinois average

Illinois average: 48.1%

Antipsychotic Use Info Percent of long-stay residents who received an antipsychotic medication 16.3%
20% better than Illinois average

Illinois average: 20.2%

Pneumococcal Vaccine Info Percent of long-stay residents assessed and appropriately given the pneumococcal vaccine 100.0%
12% better than Illinois average

Illinois average: 89.2%

Influenza Vaccine Info Percent of long-stay residents assessed and appropriately given the seasonal influenza vaccine 100.0%
9% better than Illinois average

Illinois average: 91.6%

Guides for Better Senior Living

Care Cost Calculator: See Prices in Your Area

Nursing Home Data Explorer

Don’t Wait Too Long: 7 Red Flag Signs Your Parent Needs Assisted Living Now

The True Cost of Assisted Living in 2025 – And How Families Are Paying For It

Understanding Senior Living Costs: Pricing Models, Discounts & Financial Assistance

Financial Aid for Illinois Seniors

Get financial aid guidance

Community Care Program

Illinois CCP

Age 60+, Illinois resident, at risk of nursing home placement.

~$1,215/month (individual).

$17,500 (individual, excludes home, car).

High demand in urban areas; waitlists possible.

Illinois Respite Program

IL Respite (via NFCSP)

Caregiver of someone 60+ (or with dementia), Illinois resident.

No strict limit; prioritizes low-income.

Not applicable.

Limited slots; urban/rural balance.

Supportive Living Program (SLP)

Illinois Medicaid Supportive Living Program

Age 65+ or 22-64 with disability, Illinois resident, Medicaid-eligible, needs moderate assistance (not nursing home-level).

~$2,829/month (300% FBR, individual); QIT allowed.

$2,000 (individual), $3,000 (couple) (excludes home, car).

~200 SLP sites statewide; room/board not covered.

Persons Who Are Elderly Waiver

Illinois Medicaid Elderly Waiver

Age 65+, Illinois resident, Medicaid-eligible, nursing home-level care need.

~$2,829/month (300% FBR, individual).

$2,000 (individual), $3,000 (couple).

Part of HealthChoice Illinois; consumer-directed options available.

Medicare Savings Program (MSP)

Illinois Medicare Savings Program

Age 65+ or disabled, Illinois resident, Medicare Part A/B.

~$2,510/month (QMB), ~$3,380/month (SLMB), ~$3,598/month (QI)—individual.

$9,430 (individual), $14,130 (couple).

Three tiers; no waitlist.

Senior Community Service Employment Program (SCSEP)

Illinois SCSEP

Age 55+, unemployed, low-income, Illinois resident.

~$1,983/month (125% FPL).

Not specified; income-focused.

Priority for veterans, rural residents.

Optional State Supplementation (OSS)

Illinois Optional State Supplementation

Age 65+ or disabled, Illinois resident, in approved facility, SSI recipient or low-income.

~$1,004/month (including SSI).

$2,000 (individual), $3,000 (couple).

~$50-$500/month based on facility type.

VA Aid and Attendance (A&A) and Housebound Benefits

Illinois VA Aid and Attendance/Housebound

Age 65+ or disabled veteran/spouse, Illinois resident, wartime service, need for ADL help (A&A) or homebound.

Net income < ~$1,984/month (veteran with dependent, A&A); pension offsets income.

~$155,356 (net worth limit).

High veteran demand in urban/rural areas.