St Joseph Home For the Elderly
Nursing Home, Assisted Living, Care Home, Hospice Care & Independent Living · Palatine, IL
CMS overall rating Info CMS (the Centers for Medicare & Medicaid Services) is the federal agency that rates nursing home quality. Its Overall Rating runs from 1 to 5 stars, combining health inspections, staffing, and quality measures, with inspections weighted most heavily.

St Joseph Home For the Elderly

Nursing Home, Assisted Living, Care Home, Hospice Care & Independent Living · Palatine, IL
CMS overall rating Info CMS (the Centers for Medicare & Medicaid Services) is the federal agency that rates nursing home quality. Its Overall Rating runs from 1 to 5 stars, combining health inspections, staffing, and quality measures, with inspections weighted most heavily.

Overview of St Joseph Home for the Elderly

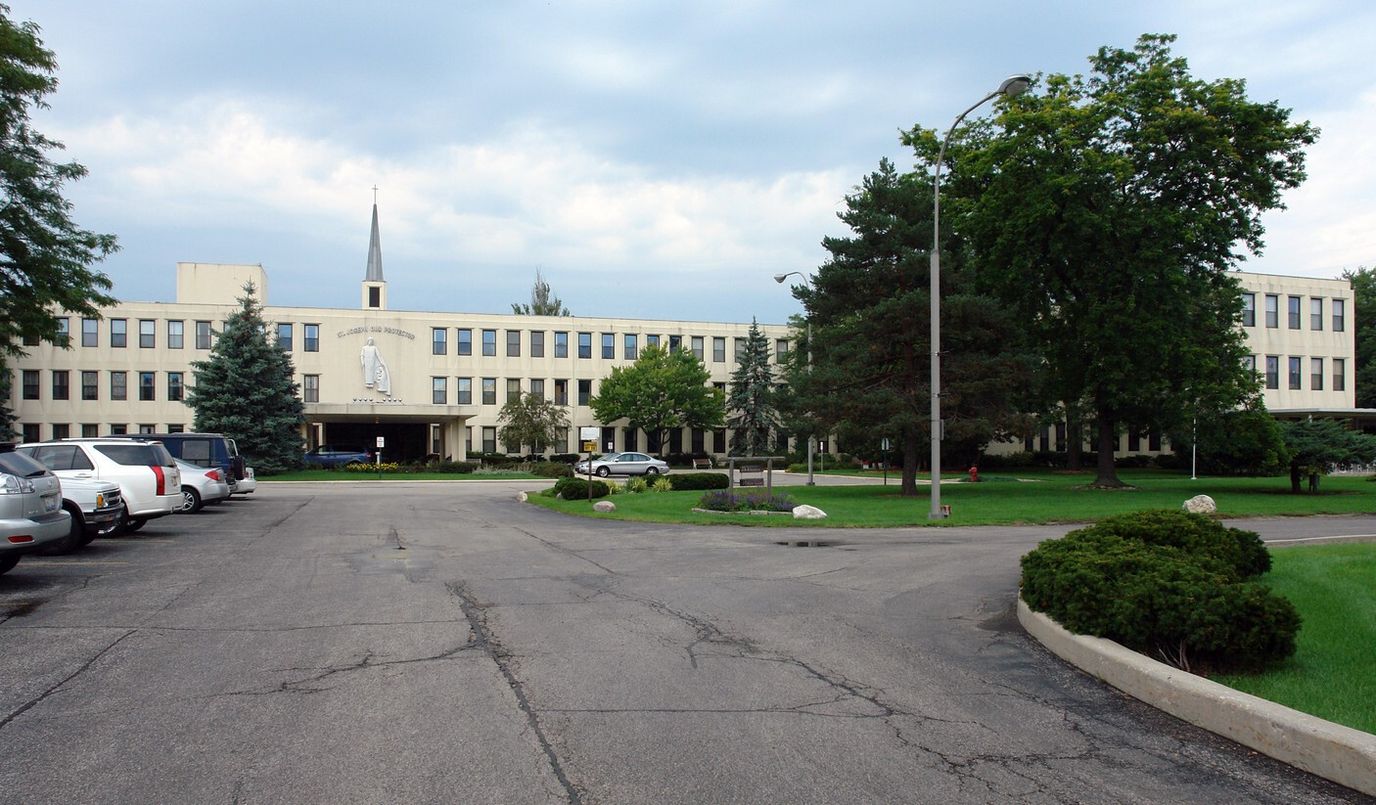
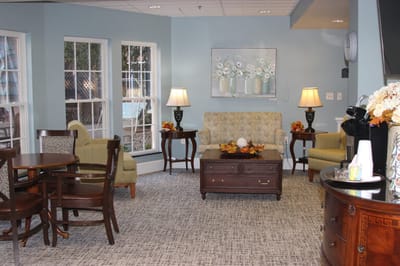
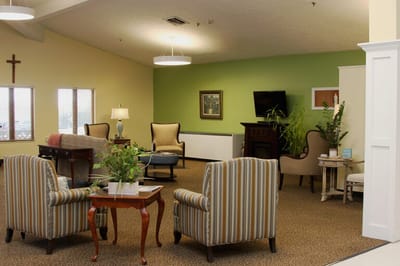
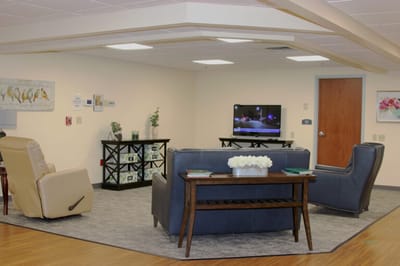
With over 177 years of experience, St Joseph Home for the Elderly is a well-established community in Palatine, IL designed for independent living and assisted living. The community provides a team of loving and excellent caregivers that offer assistance with daily activities like personal care and medication management. Here, residents enjoy the comfort of cozy accommodations set in a loving and supportive environment.

They encourage an active lifestyle with their wide array of enriching activities, pastoral programs, and volunteering opportunities. Here, residents are provided with the best care possible while also having emotional and spiritual enrichment. As a community founded on a genuine commitment to helping those in need, St Joseph Home for the Elderly ensures its residents are well-cared for in an environment that genuinely cares for them.

Quality ratings

Measured by Centers for Medicare & Medicaid Services (CMS)

Overall rating Info The Overall CMS Rating combines results from health inspections, staffing levels and quality measures. Health inspections carry the most weight. Staffing and quality scores can increase or decrease the final rating based on performance compared to state and national standards.
▲ 98.4% Above IL avg. ▲ 98.4% Above IL avg.IL average: 2.5Click the badge to see the full State ranking.Click here to see the full State ranking.
Health Inspection Info Based on the results of the facility's three most recent standard inspections and any complaint investigations. CMS reviews the number, scope, and severity of deficiencies, with more recent findings weighted more heavily.
▲ 80.1% Above IL avg. ▲ 80.1% Above IL avg.IL average: 2.8Click the badge to see the full State ranking.Click here to see the full State ranking.
Staffing Info Measures average nursing staff hours per resident per day, including Registered Nurses (RNs) and total nursing staff. Ratings are adjusted based on the level of care residents require and are compared to state and national benchmarks.
▲ 133.9% Above IL avg. ▲ 133.9% Above IL avg.IL average: 2.1Click the badge to see the full State ranking.Click here to see the full State ranking.
Quality Measures Info Based on clinical and physical health indicators reported to CMS, such as hospital readmissions, falls, pressure ulcers, and improvements in mobility. These measures reflect how well residents' health needs are being managed.
▲ 42.1% Above IL avg. ▲ 42.1% Above IL avg.IL average: 2.8Click the badge to see the full State ranking.Click here to see the full State ranking.

Staffing hours breakdown

Info Daily nursing hours per resident by staff type, reported to CMS. Higher is generally better — compare this facility to state and national averages to see where staffing stands.

Hours per resident per day — compared to Illinois state averages

Total nursing care / resident Info This home is ranked 1st out of 172 homes in Illinois for nurse hours. Total adjusted nursing hours per resident per day, combining RN, LPN, and aide time. CMS adjusts this for case-mix so facilities can be fairly compared.
7h 26m per day
Rank #1 / 172Nurse hours — State benchmarkedThis home is ranked 1st out of 172 homes in Illinois. Shows adjusted nurse hours per resident per day benchmarked to the Illinois average, with a ranking across 172 Illinois facilities. More hours mean more direct care. The national average is about 3.5 hrs; below 3.0 is a red flag.Rankings are based only on facilities in Illinois that report data for that category. Facilities without available data are excluded from the ranking.Click the rank badge to see the full State ranking.Click here to see the full State ranking.
This facility Illinois avg (3h 6m per day)
vs Illinois avg
+140%

1 of 6 metrics below state avg

Standout metric LPN / LVN is +92% above state avg
Staff typeHours / Day / Residentvs state avg
Registered Nurse (RN) Info RNs hold the highest nursing license and can assess residents, interpret test results, and direct care plans. More RN hours per day often signals stronger clinical oversight and faster response to health changes. 59m per day ▲ 35% State avg: 44m per day · National avg: 41m per day
LPN / LVN Info Licensed Practical Nurses (LPNs) or Licensed Vocational Nurses (LVNs) deliver routine hands-on care — medication administration, wound dressing, and monitoring vital signs. They work under RN supervision and make up a large share of daily bedside care. 1h 13m per day ▲ 92% State avg: 38m per day · National avg: 52m per day
Nurse Aide Info Certified Nurse Aides (CNAs) provide the most direct day-to-day assistance: bathing, dressing, feeding, and mobility. Nurse aide hours are typically the largest staffing category and directly affect residents' quality of life. 3h 33m per day ▲ 67% State avg: 2h 8m per day · National avg: 2h 21m per day
Weekend Total Nursing Info Combined nursing hours (RN + LPN + Nurse Aide) per resident per day on weekends. Staffing often drops on weekends — this figure reveals whether the facility maintains adequate coverage outside of weekday hours. 5h 2m per day ▲ 63% State avg: 3h 5m per day · National avg: 3h 26m per day
Physical Therapist Info Hours per resident per day provided by licensed Physical Therapists (PTs) or PT Assistants. PT services help residents recover mobility after injury or illness and are especially important for post-acute (short-stay) rehabilitation. 0m per day ▼ 100% State avg: 3m per day · National avg: 4m per day
Weekend RN Info Registered nurse hours specifically on weekends. Facilities sometimes reduce RN presence on Saturdays and Sundays — a low weekend RN figure compared to weekday hours can indicate reduced clinical oversight when most administrative staff are absent. 42m per day ▲ 23% State avg: 34m per day · National avg: 29m per day

Capacity and availability

This home usually has availability

Lower occupancy than the Illinois average: 69.3%
Occupancy rate
53.2% Rank #176 / 204Occupancy rate — State benchmarkedThis home is ranked 176th out of 204 homes in Illinois. Shows this facility's occupancy rate versus the Illinois average, with its Statewide rank out of 204. Higher occupancy signals strong local demand and financial stability.Rankings are based only on facilities in Illinois that report data for that category. Facilities without available data are excluded from the ranking.Click the rank badge to see the full State ranking.Click here to see the full State ranking.
Bed community size
49-bed community Rank #301 / 426Bed count — State benchmarkedThis home is ranked 301st out of 426 homes in Illinois. Shows this facility's certified or reported bed count compared to other Illinois facilities. Larger communities may offer more amenities, programs, and on-site services for residents and families.Rankings are based only on facilities in Illinois that report data for that category. Facilities without available data are excluded from the ranking.Click the rank badge to see the full State ranking.Click here to see the full State ranking.
A moderately sized community that may balance personal attention with shared amenities and social activities.
Walk Score
Walk Score: 69 / 100 Rank #159 / 648Walk Score — State benchmarkedThis home is ranked 159th out of 648 homes in Illinois. Shows how walkable this facility's neighborhood is compared to the average Walk Score across Illinois facilities. Higher scores benefit residents, families, and staff.Rankings are based only on facilities in Illinois that report data for that category. Facilities without available data are excluded from the ranking.Click the rank badge to see the full State ranking.Click here to see the full State ranking.
Moderately walkable. Some errands can be accomplished on foot, with a mix of nearby amenities.

Safety & Compliance

Secured Perimeter
Emergency SystemsYes

Therapy & Rehabilitation

2 services
Rehabilitation Services
Short-Term Rehab

Amenities & Lifestyle

Transportation
Wellness Programphysical therapy, occupational therapy, speech therapy
Specific ProgramsWellness Center, Long-Term Living
Religious Services

Contact St Joseph Home For the Elderly

Staffing Data

Reporting period: October 1 – December 31, 2025 (Q4 2025). Source: CMS Payroll-Based Journal report.

Total staff 65
Employees 57
Contractors 8
Staff to resident ratio 2.10 : 1
17% more staff per resident than Illinois average
Illinois average ratio: 1.80 : 1 Illinois average ratio: 1.80 : 1See full Illinois ranking
Avg staff/day 27
Average shift 7.3 hours
0% compared with Illinois average
Illinois average: 7.6 hours Illinois average shift: 7.6 hoursSee full Illinois ranking
Total staff hours (quarter) 18,147

Nursing staff breakdown

Q4 2025 · Oct 1 – Dec 31 More info This data comes from the CMS Payroll-Based Journal report covering October 1 – December 31, 2025.
Registered Nurse

Manages medical care and health needs.

RN Staff Info 15 total: 11 full-time employees and 4 contractors. 15
Average shift length Info Average shift length. Calculated as total hours divided by days worked and average staff per day. 7.1 hours
Licensed Practical Nurse

Assists with medical care and medications.

LPN Staff Info All 9 LPN Staff are full-time employees. No contractors work on this role. 9
Average shift length Info Average shift length. Calculated as total hours divided by days worked and average staff per day. 6.7 hours
Certified Nursing Assistant

Helps with daily care and mobility.

CNA Staff Info All 29 CNA Staff are full-time employees. No contractors work on this role. 29
Average shift length Info Average shift length. Calculated as total hours divided by days worked and average staff per day. 7.2 hours

Contractor staffing

Q4 2025 · Oct 1 – Dec 31 More info This data comes from the CMS Payroll-Based Journal report covering October 1 – December 31, 2025.

Total hours from contractors

4.2%

765 contractor hours this quarter

Registered Nurse: 4 Nurse Practitioner: 1 Other Dietary Services Staff: 1 Occupational Therapy Aide: 1 Medical Director: 1

Staff by category

Q4 2025 · Oct 1 – Dec 31 More info This data comes from the CMS Payroll-Based Journal report covering October 1 – December 31, 2025.
Certified Nursing Assistant2902910,07592100%7.2
Licensed Practical Nurse9092,56492100%6.7
Registered Nurse114152,00892100%7.1
RN Director of Nursing2028847177%8.1
Administrator1014806065%8
Nurse Practitioner1124415560%8
Dietitian1013874852%8.1
Therapeutic Recreation Specialist1013744549%8.3
Clinical Nurse Specialist1013624751%7.7
Other Dietary Services Staff0113265054%6.5
Dental Services Staff1011933538%5.5
Occupational Therapy Aide011451921%2.3
Medical Director0111033%3.4
29 Certified Nursing Assistant
% of Days 100%
9 Licensed Practical Nurse
% of Days 100%
15 Registered Nurse
% of Days 100%
2 RN Director of Nursing
% of Days 77%
1 Administrator
% of Days 65%
2 Nurse Practitioner
% of Days 60%
1 Dietitian
% of Days 52%
1 Therapeutic Recreation Specialist
% of Days 49%
1 Clinical Nurse Specialist
% of Days 51%
1 Other Dietary Services Staff
% of Days 54%
1 Dental Services Staff
% of Days 38%
1 Occupational Therapy Aide
% of Days 21%
1 Medical Director
% of Days 3%

Penalties and fines

Federal penalties imposed by CMS for regulatory violations, including civil money penalties (fines) and denials of payment for new Medicare/Medicaid admissions.

Source: CMS Penalties Database

No penalties in the past 3 years

No civil money penalties or payment denials were reported in the last 3 years.

Quality of care over time

These measures show how residents usually do over time at this home, based on health outcomes and preventive care.

High-risk clinical events score Info A composite score based on pressure ulcers, falls with injury, weight loss, walking ability decline, and activities of daily living decline. 4.6
52% better than Illinois average

Illinois average: 9.7

Functional decline score Info A composite score based on activities of daily living decline, walking ability decline, and incontinence. 12.3
34% better than Illinois average

Illinois average: 18.6

Long-stay resident measures
Above average Illinois avg: 3.6 Info CMS star rating based on long-stay quality measure performance. 5 stars = significantly above average, 1 star = significantly below average.
Need for Help with Daily Activities Increased Info Percent of long-stay residents whose need for help with daily activities has increased 9.7%
38% better than Illinois average

Illinois average: 15.5%

Walking Ability Worsened Info Percent of long-stay residents whose ability to move independently worsened 4.9%
73% better than Illinois average

Illinois average: 18.4%

Low Risk Residents with Bowel/Bladder Incontinence Info Percent of low risk long-stay residents who lose control of their bowels or bladder 22.4%
In line with Illinois average

Illinois average: 21.6%

Falls with Major Injury Info Percent of long-stay residents experiencing one or more falls with major injury 2.4%
28% better than Illinois average

Illinois average: 3.4%

High Risk Residents with Pressure Ulcers Info Percent of long-stay high risk residents with pressure ulcers 2.7%
50% better than Illinois average

Illinois average: 5.3%

Urinary Tract Infection Info Percent of long-stay residents with a urinary tract infection 0.9%
53% better than Illinois average

Illinois average: 1.8%

Lost Too Much Weight Info Percent of long-stay residents who lose too much weight 3.6%
45% better than Illinois average

Illinois average: 6.5%

Depressive Symptoms Info Percent of long-stay residents who have depressive symptoms 5.0%
90% better than Illinois average

Illinois average: 48.1%

Antipsychotic Use Info Percent of long-stay residents who received an antipsychotic medication 16.3%
20% better than Illinois average

Illinois average: 20.2%

Pneumococcal Vaccine Info Percent of long-stay residents assessed and appropriately given the pneumococcal vaccine 100.0%
12% better than Illinois average

Illinois average: 89.2%

Influenza Vaccine Info Percent of long-stay residents assessed and appropriately given the seasonal influenza vaccine 100.0%
9% better than Illinois average

Illinois average: 91.6%

Hospitalizations per 1,000 days Info Number of hospitalizations per 1,000 long-stay resident days. 3.64
78% worse than Illinois average

Illinois average: 2.05

ED visits per 1,000 days Info Number of outpatient emergency department visits per 1,000 long-stay resident days. 3.28
46% worse than Illinois average

Illinois average: 2.25

Facility Characteristics

Source: CMS Long-Term Care Facility Characteristics (Data as of Jan 2026)

Total residents 31
Medicare
2
6.5% of residents
Medicaid
27
87.1% of residents
Private pay or other
2
6.5% of residents
Programs & Services
Residents Group

Residents meet regularly to discuss policies, care quality, and activities

Active Resident Council

Organized group of residents that meets regularly to discuss facility policies, quality of life, and activities.

What does this home offer?

Housing options icon

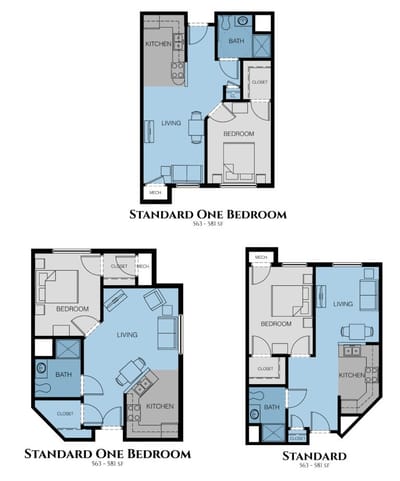
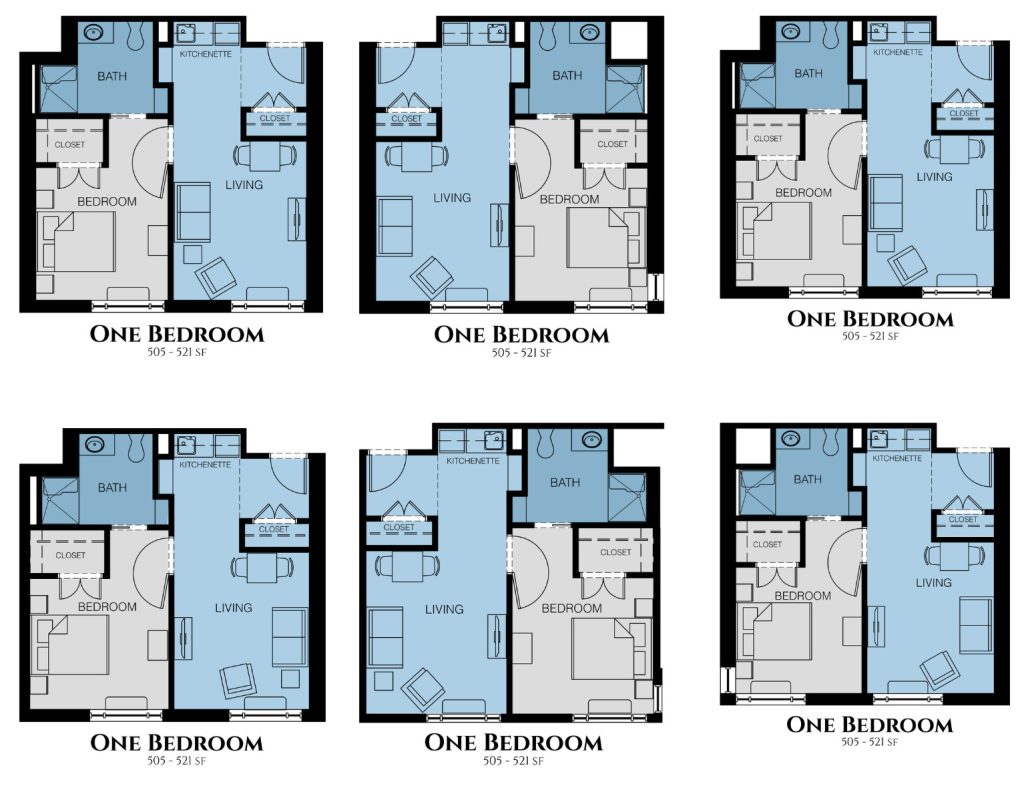
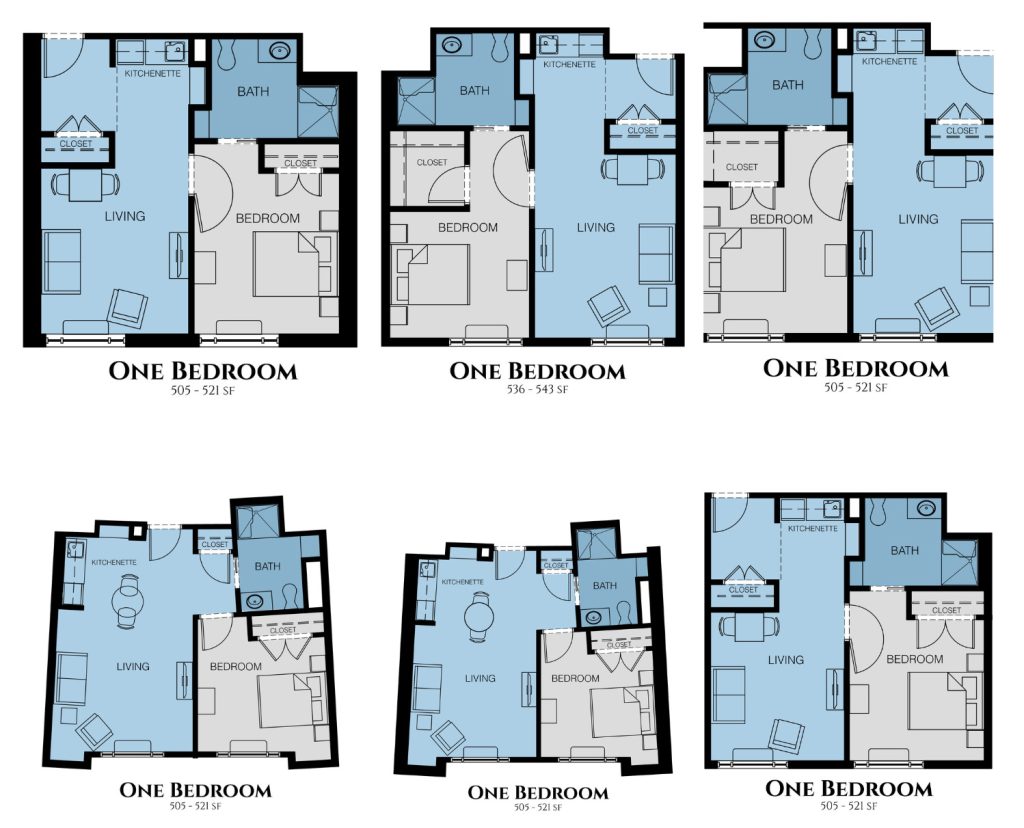
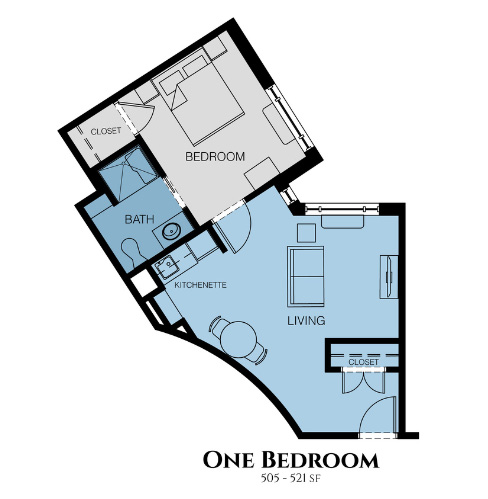
Housing Options: Private / Semi-Private Rooms

Building type icon
Building type icon

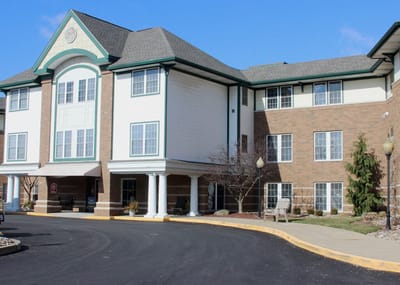
Building Type: 3-story

Recreational activities icon

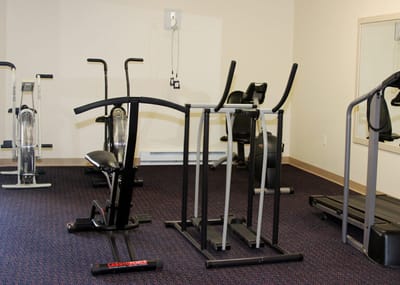
Recreational Activities

Housekeeping icon
Housekeeping icon

Housekeeping Services

Living Spaces & Floor Plans for St Joseph Home For the Elderly

Places of interest near St Joseph Home For the Elderly

Address 1.3 miles from city center Info Estimated distance in miles from Palatine's city center to St Joseph Home For the Elderly's address, calculated via Google Maps.

Calculate Travel Distance to St Joseph Home For the Elderly

Add your location

Address

Compare Nursing Homes around Cook County

The information below is reported by the Illinois Department of Public Health, Office of Health Care Regulation.

3 facilities compared · CMS & IL Dept. of Health data

St Joseph Home For the Elderly
NH
AL
CH
HC
IL
Palatine
49
Facility 49
IL AVG 86
Rank #301 / 426
53.2%
Facility 53.2%
IL AVG 69.3%
Rank #176 / 204
-23%
7.43
Facility 7.43
IL AVG 3.10
Rank #1 / 172
+63%+140%
$0
Facility $0
IL AVG $151.3k
Rank #1 / 173
5
Facility 5
IL AVG 36.8
Rank #3 / 172
5.0
Facility 5.0
IL AVG 3.7
Rank #148 / 172
-31-
69
Facility 69
IL AVG 51
Rank #159 / 648
Veronica Cantu---146189
Little Sisters of the Poor St. Mary’s Home
NH
AL
CH
HC
IL
Chicago (Lincoln Park)
76
Facility 76
IL AVG 86
Rank #195 / 426
58.3%
Facility 58.3%
IL AVG 69.3%
Rank #157 / 204
-16%
5.12
Facility 5.12
IL AVG 3.10
Rank #17 / 172
+37%+65%
$9.1k
Facility $9.1k
IL AVG $151.3k
Rank #72 / 173
21
Facility 21
IL AVG 36.8
Rank #45 / 172
5.3
Facility 5.3
IL AVG 3.7
Rank #154 / 172
145-
93
Facility 93
IL AVG 51
Rank #23 / 648
Claire Mccanless---146185
Celebrate Senior Living Niles
NH
AL
IL
MC
RC
Niles (North Newark Avenue)
59
Facility 59
IL AVG 86
Rank #268 / 426
89.7%
Facility 89.7%
IL AVG 69.3%
Rank #35 / 204
+29%
3.54
Facility 3.54
IL AVG 3.10
Rank #54 / 172
-1%+14%
$29.8k
Facility $29.8k
IL AVG $151.3k
Rank #99 / 173
9
Facility 9
IL AVG 36.8
Rank #11 / 172
1.8
Facility 1.8
IL AVG 3.7
Rank #6 / 172
249A+
60
Facility 60
IL AVG 51
Rank #233 / 648
Elevate Housing Foundation
$8.5M
Facility $8.5M
IL AVG $12.2M
Rank #122 / 171
$5.4M
Facility $5.4M
IL AVG $4.8M
Rank #126 / 171
63.3%
Facility 63.3%
IL AVG 44.3%
Rank #81 / 171
146176

Financial Assistance for
Nursing Home in Illinois

St Joseph Home For the Elderly is located in Palatine, Illinois.
Here are the financial assistance programs available to residents in Illinois.

Get Financial aid guidance

Community Care Program

Illinois CCP

Age 60+
General Illinois resident, at risk of nursing home placement.
Income Limits (2025) ~$1,215/month individual
Asset Limits $17,500 individual, excludes home, car
IL

High demand in urban areas; waitlists possible.

Benefits
In-home care (3-5 hours/day) Adult day services ($65/day) Emergency home response systems ($30/month)

Illinois Respite Program

IL Respite (via NFCSP)

Age Caregiver of someone 60+ (or with dementia)
General Illinois resident.
Income Limits No strict limit; prioritizes low-income.
Asset Limits Not applicable.
IL

Limited slots; urban/rural balance.

Benefits
In-home respite (4-6 hours/day) Adult day care (~$65/day) Short-term facility care (up to 5 days)

Supportive Living Program (SLP)

Illinois Medicaid Supportive Living Program

Age 65+ or 22-64 with disability
General Illinois resident, Medicaid-eligible, needs moderate assistance (not nursing home-level).
Income Limits (2025) ~$2,829/month (300% FBR, individual); QIT allowed.
Asset Limits $2,000 (individual), $3,000 (couple) (excludes home, car).
IL

~200 SLP sites statewide; room/board not covered.

Benefits
Personal care (5-7 hours/day, e.g., bathing, mobility) Meals Housekeeping Medication management Respite (~240 hours/year)

Persons Who Are Elderly Waiver

Illinois Medicaid Elderly Waiver

Age 65+
General Illinois resident, Medicaid-eligible, nursing home-level care need.
Income Limits (2025) ~$2,829/month 300% FBR, individual
Asset Limits $2,000 (individual), $3,000 (couple).
IL

Part of HealthChoice Illinois; consumer-directed options available.

Benefits
Personal care (5-7 hours/day, e.g., dressing, eating) Homemaker Adult day care (~$60/day) Respite (240 hours/year) Home mods ($1,000 avg.)

Medicare Savings Program (MSP)

Illinois Medicare Savings Program

Age 65+ or disabled
General Illinois resident, Medicare Part A/B.
Income Limits (2025) ~$2,510/month (QMB), ~$3,380/month (SLMB), ~$3,598/month (QI)—individual.
Asset Limits $9,430 (individual), $14,130 (couple).
IL

Three tiers; no waitlist.

Benefits
Covers Part B premiums ($174.70/month) Deductibles ($240/year) Copays (~20%)

Optional State Supplementation (OSS)

Illinois Optional State Supplementation

Age 65+ or disabled
General Illinois resident, in approved facility, SSI recipient or low-income.
Income Limits (2025) ~$1,004/month including SSI
Asset Limits $2,000 (individual), $3,000 (couple).
IL

~$50-$500/month based on facility type.

Benefits
Cash (~$50-$500/month) for room/board in personal care homes or SLFs

VA Aid and Attendance (A&A) and Housebound Benefits

Illinois VA Aid and Attendance/Housebound

Age 65+ or disabled veteran/spouse
General Illinois resident, wartime service, need for ADL help (A&A) or homebound.
Income Limits (2025) Net income < ~$1,984/month (veteran with dependent, A&A); pension offsets income.
Asset Limits ~$155,356 net worth limit
IL

High veteran demand in urban/rural areas.

Benefits
Cash (~$1,433-$2,642/month veteran, ~$951-$1,318 spouse) for care costs (e.g., in-home, assisted living)

Frequently Asked Questions about St Joseph Home For the Elderly

Is St Joseph Home For the Elderly in a walkable area?

St Joseph Home For the Elderly has a walk score of 69. Moderately walkable. Some errands can be accomplished on foot, with a mix of nearby amenities.

What is the occupancy rate at St Joseph Home For the Elderly?

St Joseph Home For the Elderly's occupancy is 53.2%.

Does St Joseph Home For the Elderly have different floorplan options?

Yes — see the floorplan options available at St Joseph Home For the Elderly on this page.

Does St Joseph Home For the Elderly operate as a for-profit or non-profit?

St Joseph Home For the Elderly is registered as a non-profit.

Are there photos of St Joseph Home For the Elderly?

Yes — there are 17 photos of St Joseph Home For the Elderly in the photo gallery on this page.

What is the address of St Joseph Home For the Elderly?

St Joseph Home For the Elderly is located at 80 W Northwest Hwy, Palatine, IL 60067.

What is the phone number of St Joseph Home For the Elderly?

(847) 358-5700 will put you in contact with the team at St Joseph Home For the Elderly.

Guides for Better Senior Living

Care Cost Calculator: See Prices in Your Area

Nursing Home Data Explorer

Don’t Wait Too Long: 7 Red Flag Signs Your Parent Needs Assisted Living Now

The True Cost of Assisted Living in 2025 – And How Families Are Paying For It

Understanding Senior Living Costs: Pricing Models, Discounts & Financial Assistance