Tallmadge Health and Rehab

Nursing Home
Overview of Tallmadge Health and Rehab

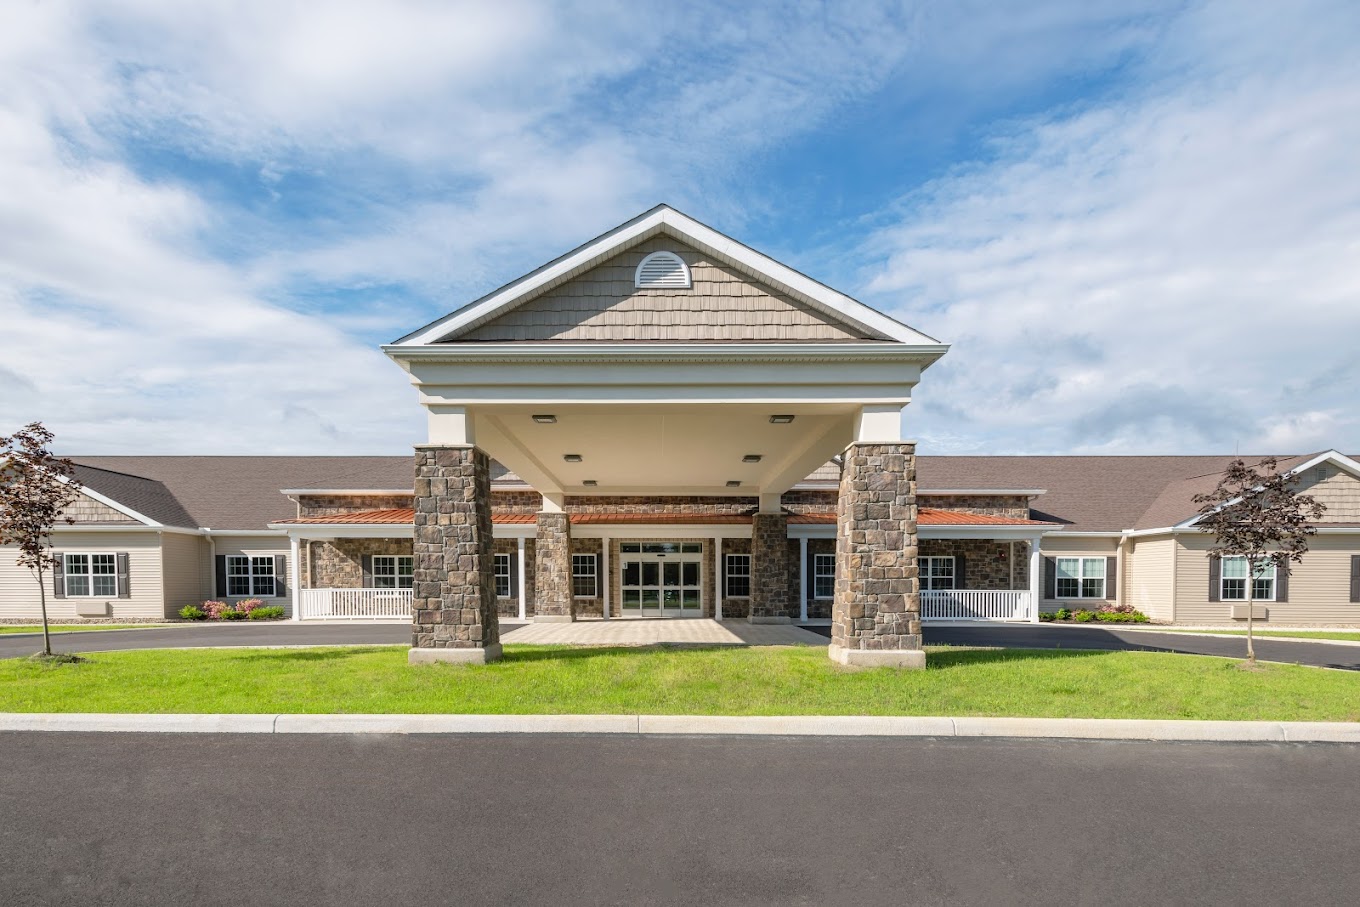
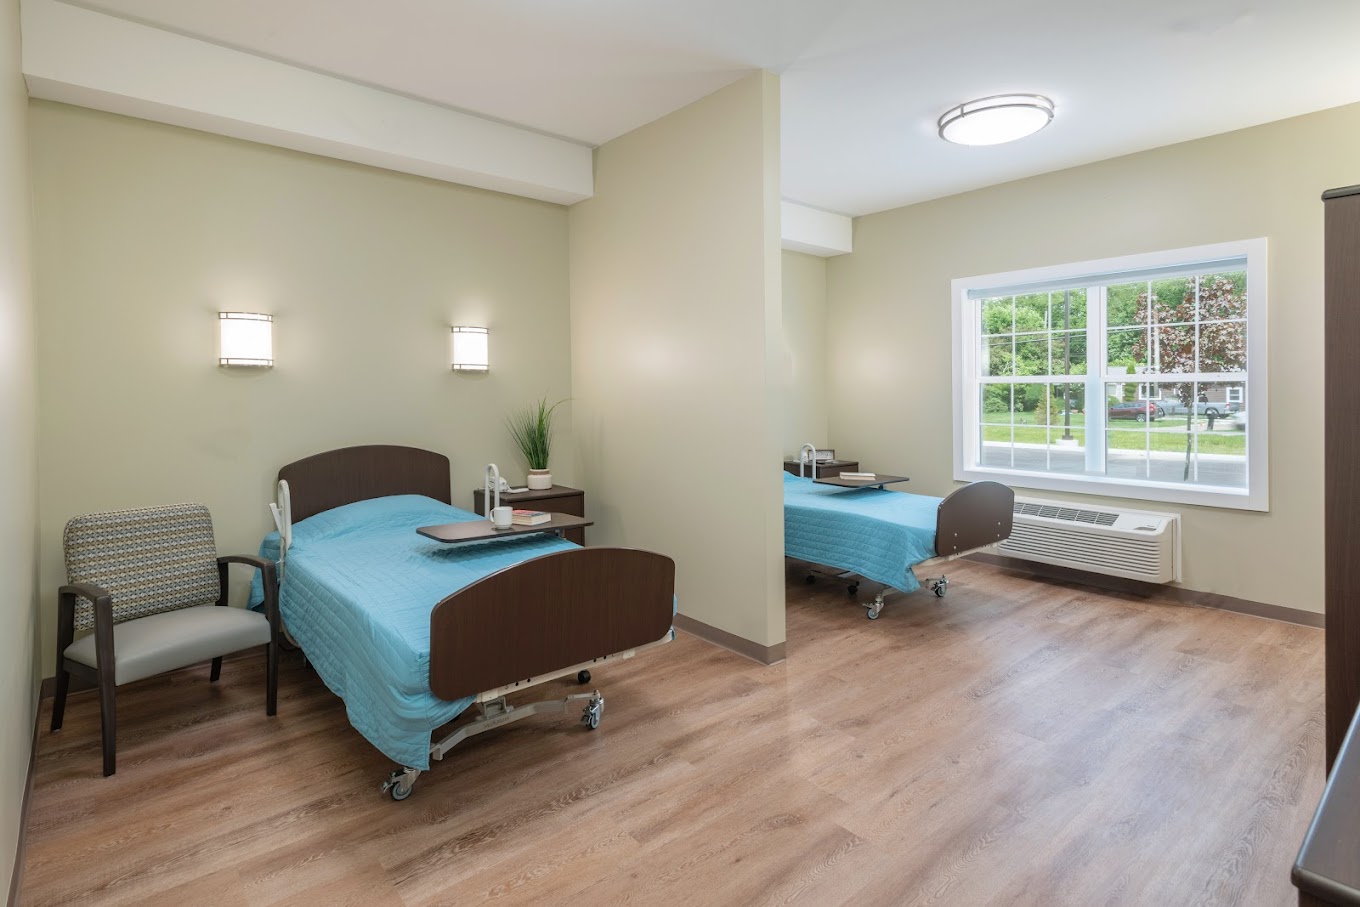
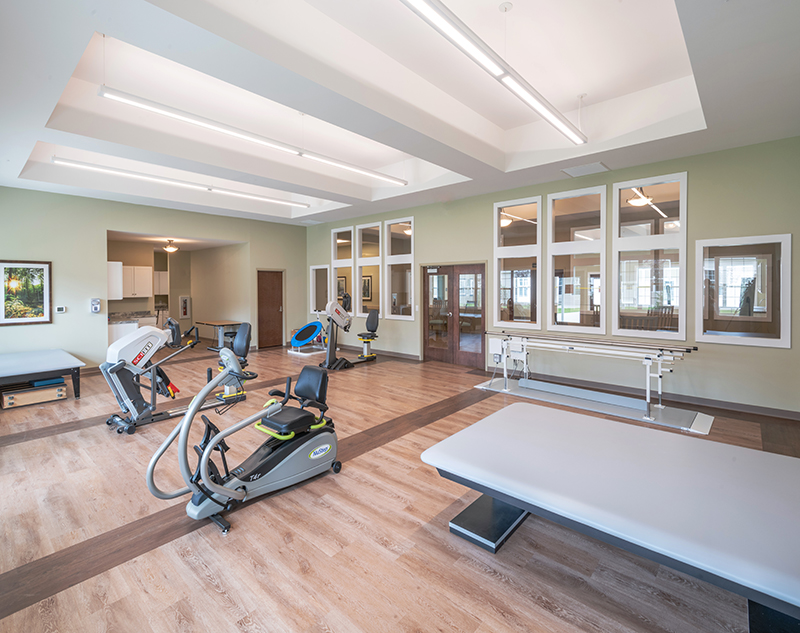
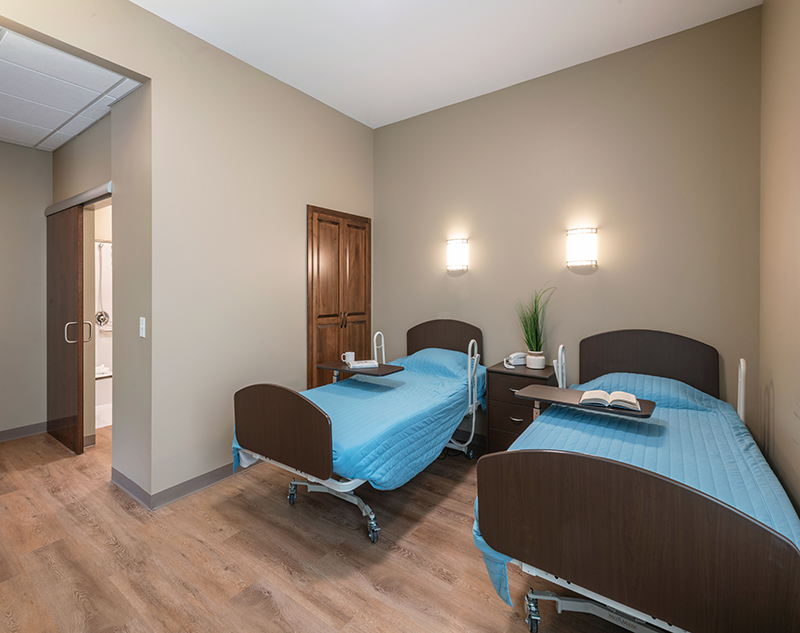
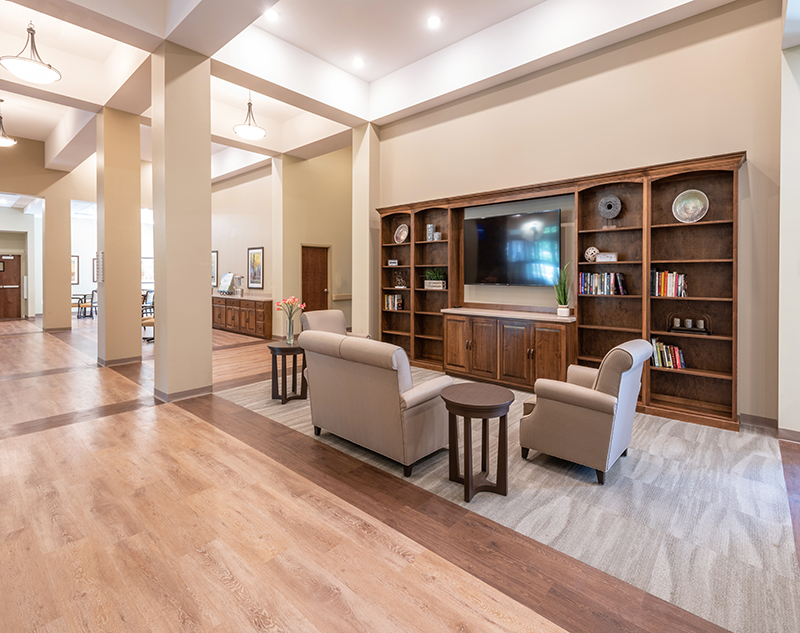
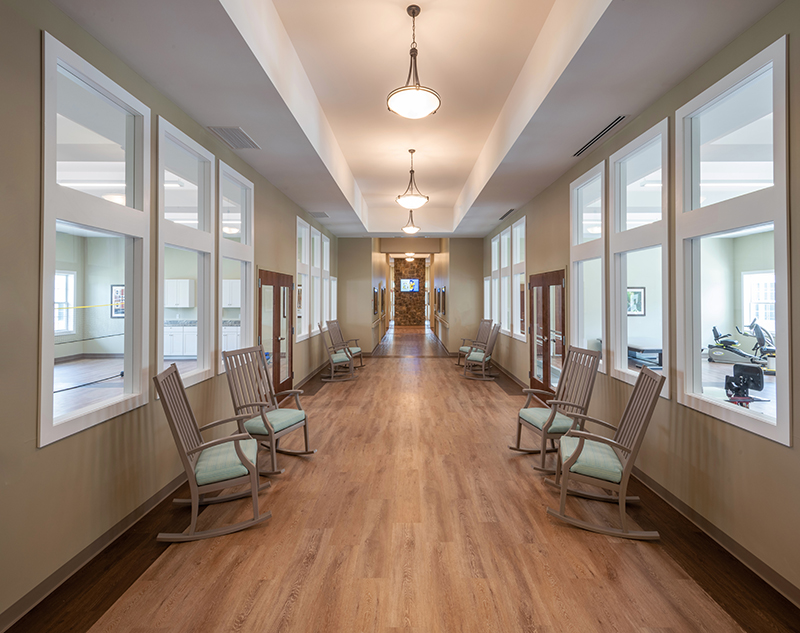
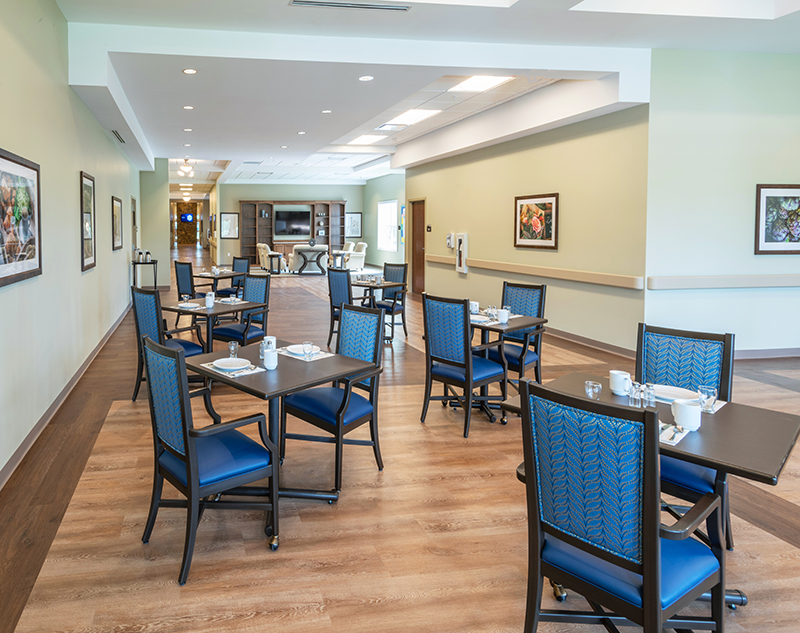
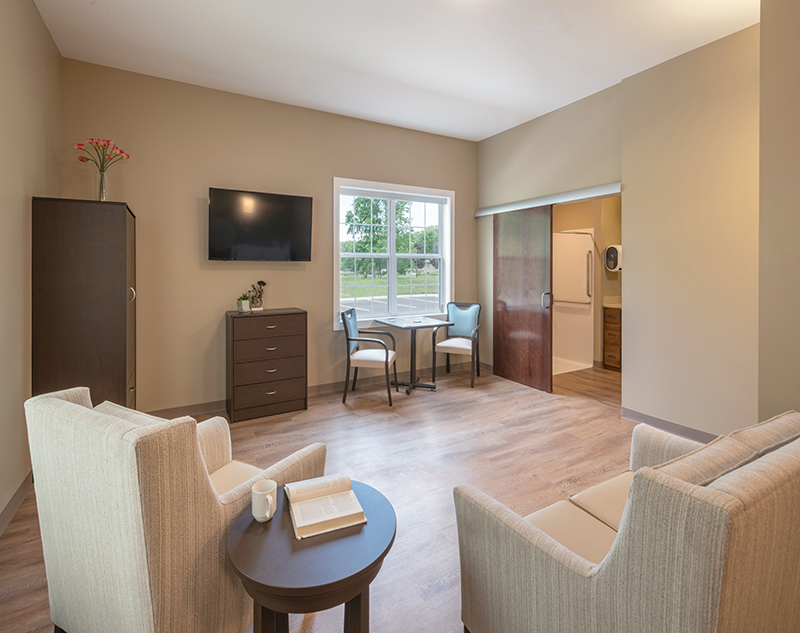
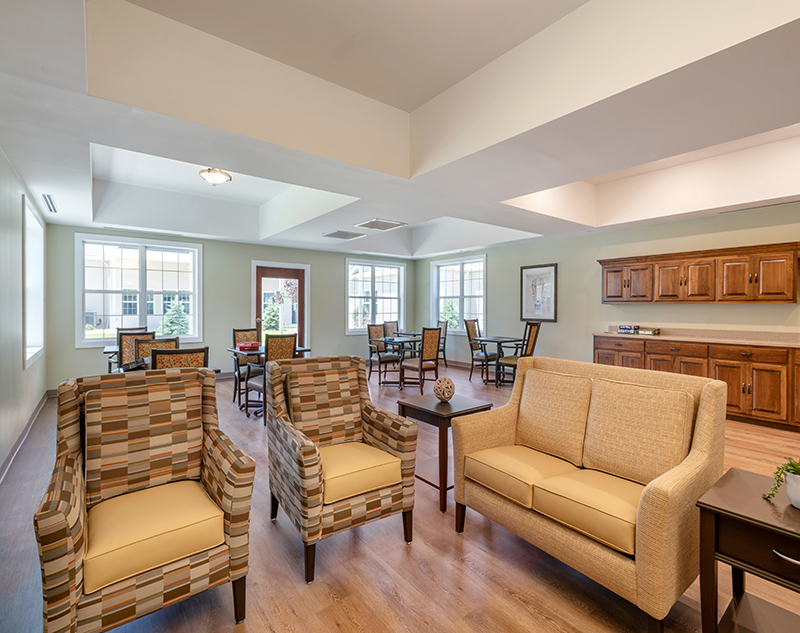
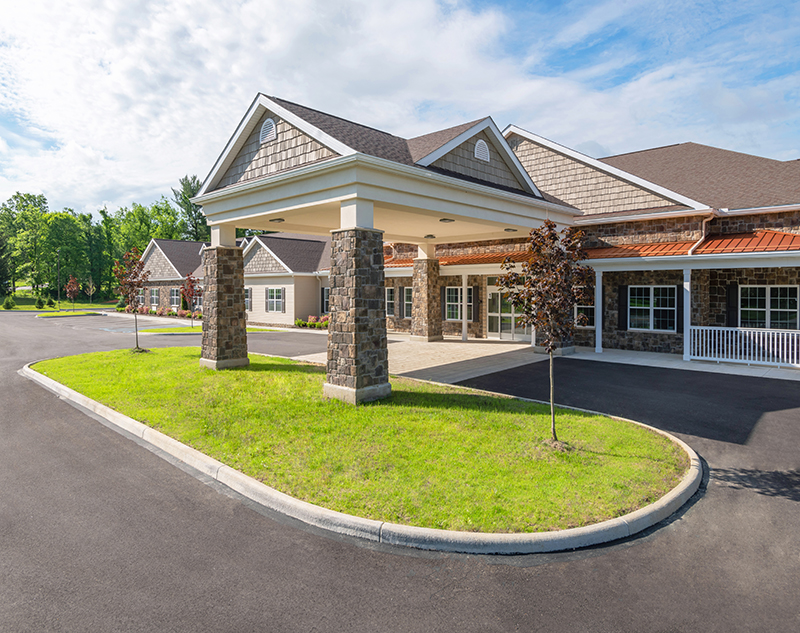
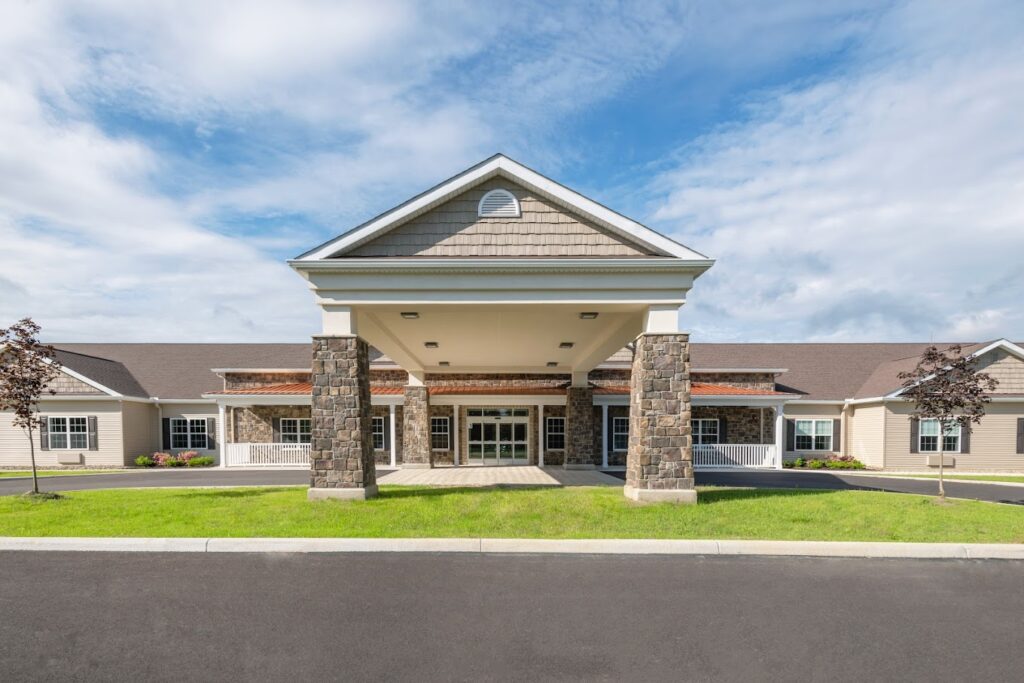
Tallmadge Health and Rehab is a senior rehabilitation center located in the charming city of Tallmadge, OH, close to Tallmadge Circle and Six Corners’ restaurants, parks, and shopping. Established in 2021, this 90-bed facility offers compassionate care with a focus on specialized senior rehabilitation, skilled nursing, assisted living, personal care, and long-term care services. Here, residents can enjoy private and semi-private room choices, each thoughtfully designed to support safety and comfort.

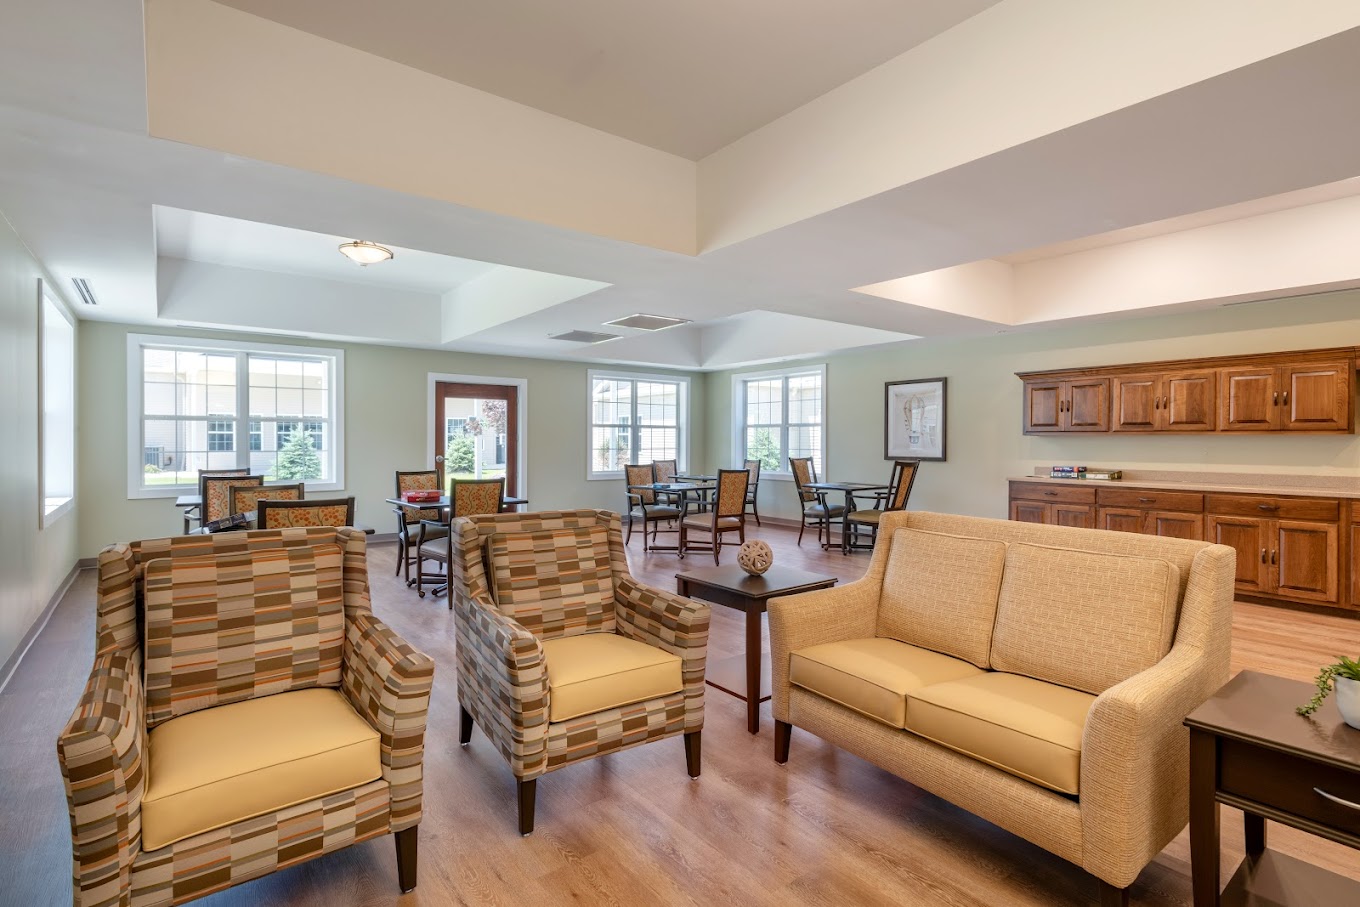
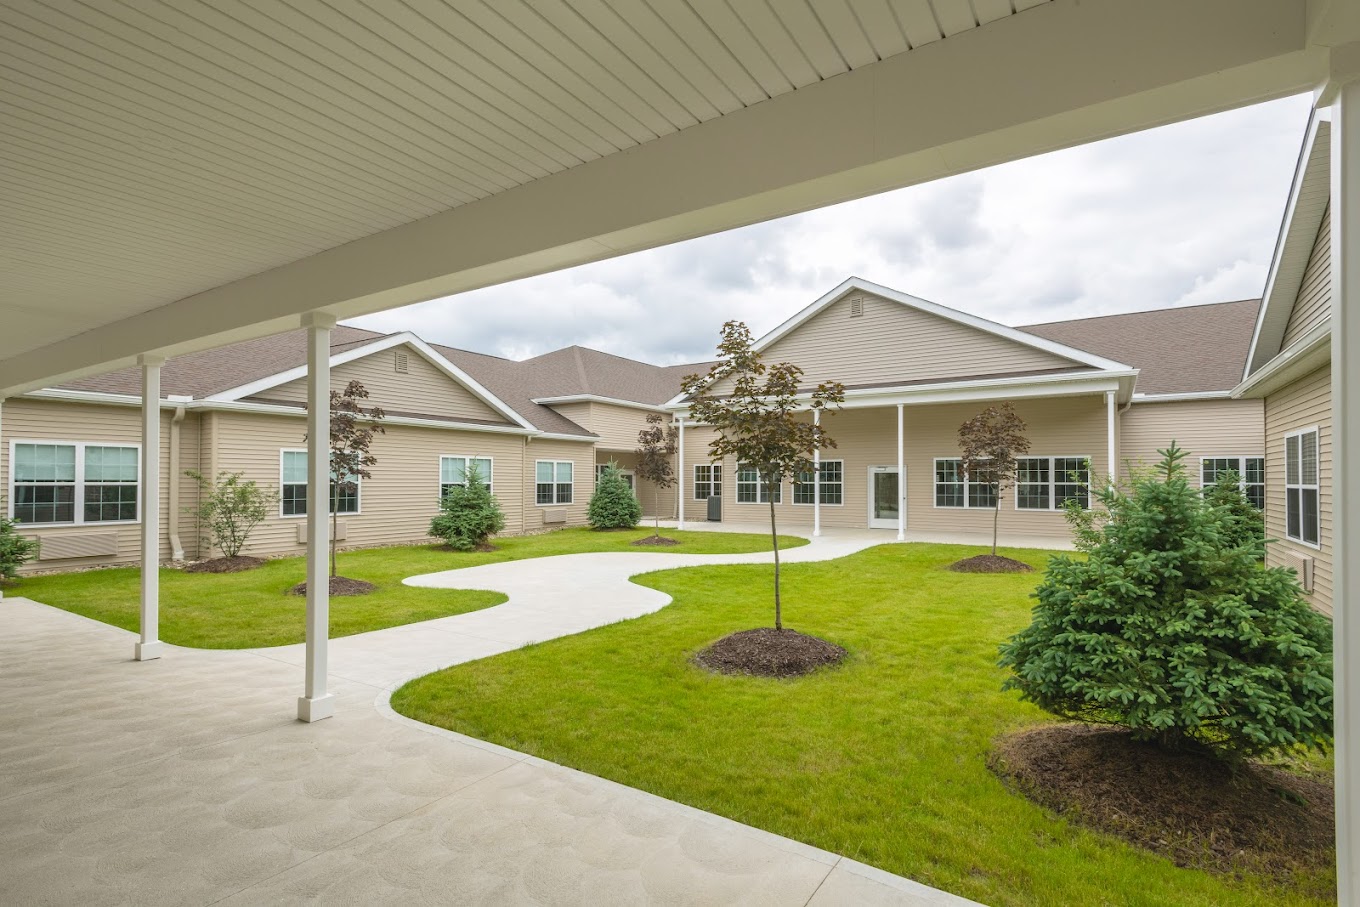
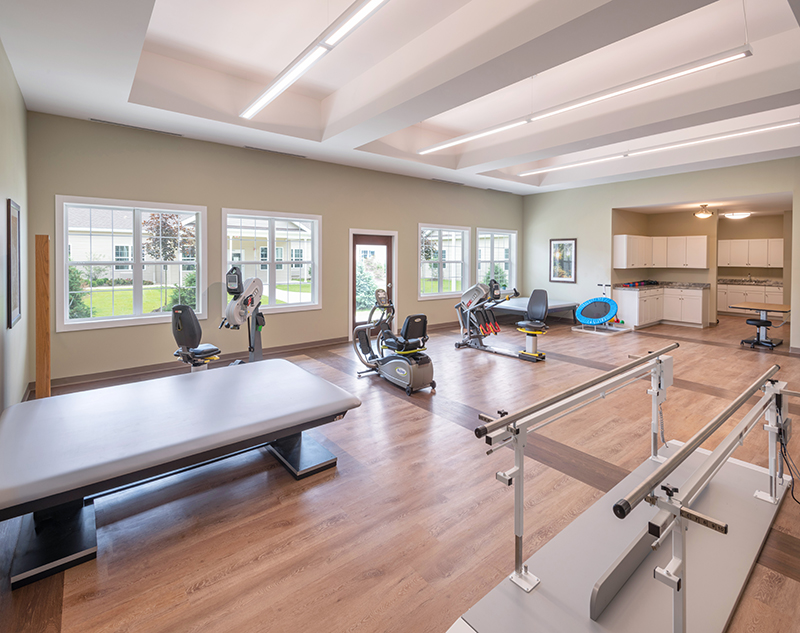
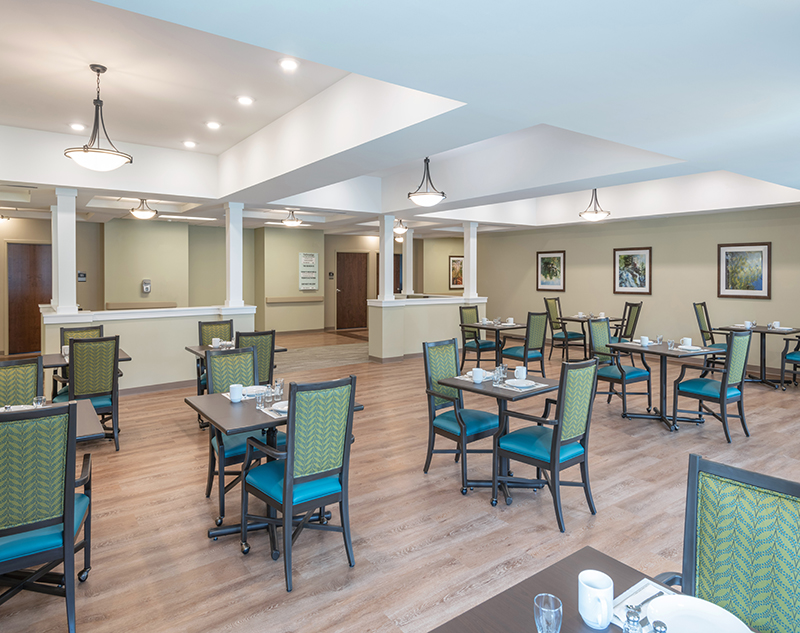
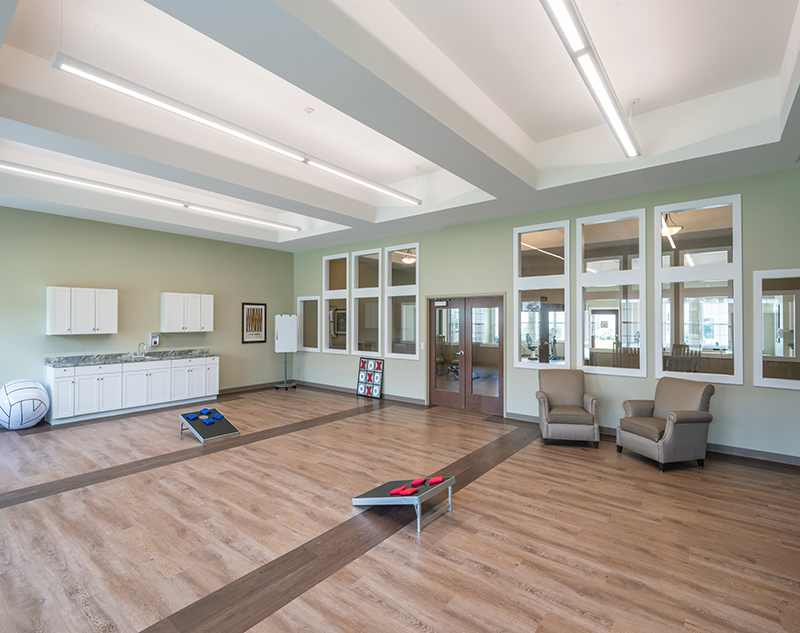
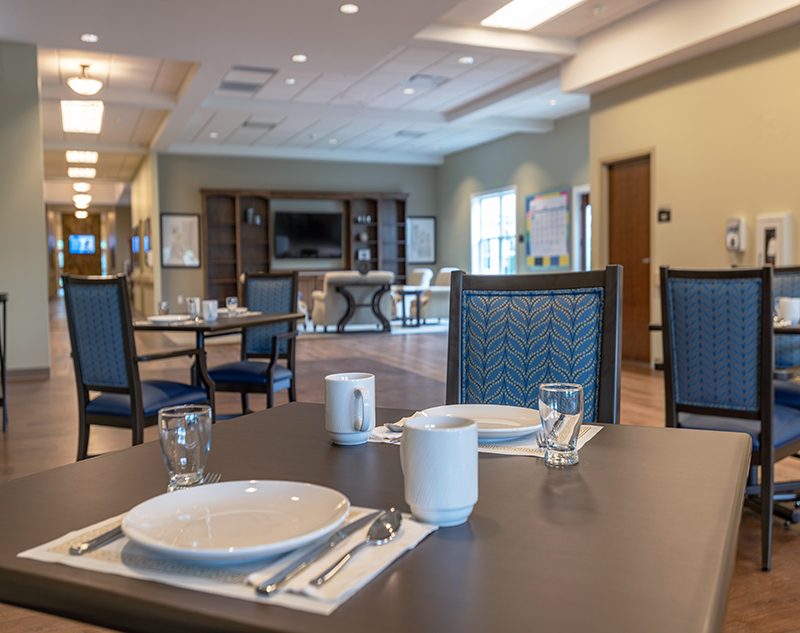
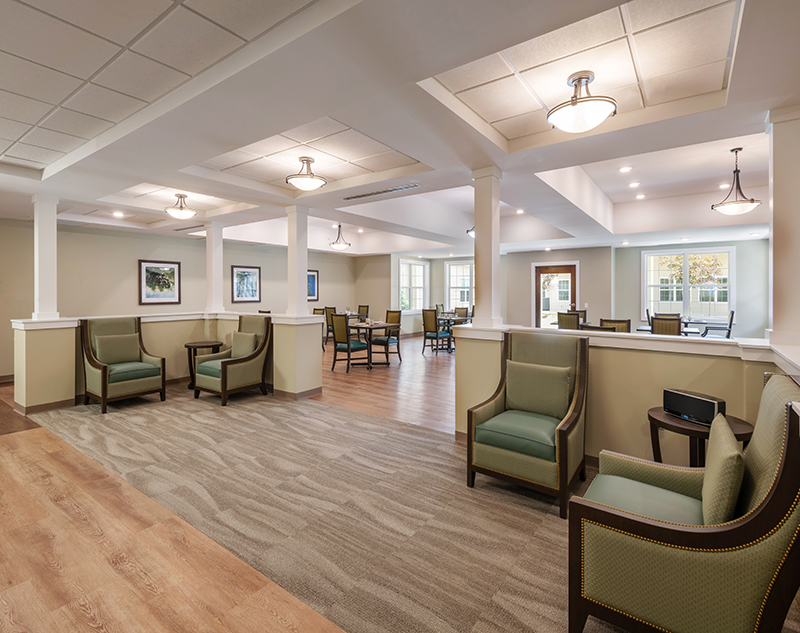
The Tallmadge team is dedicated to holistic resident well-being, providing 24-hour skilled nursing and specialty rehabilitation services, including physical, occupational, and speech therapy. Residents can savor the beautiful outdoor patios or unwind in community activity spaces, engaging in diverse recreational and therapeutic options. With a mission centered on achieving positive outcomes, Tallmadge Health and Rehab creates a supportive environment where residents feel truly at home.

(234) 274-1888

Quality ratings

Measured by Centers for Medicare & Medicaid Services (CMS)

Overall rating Info Official CMS rating based on health inspections, staffing and quality measures.
3/5
Ohio average: 3.2/5
Health Inspection Info Official CMS rating based on deficiencies found during state health inspections.
2/5
Ohio average: 2.8/5
Staffing Info Official CMS rating based on nurse staffing hours per resident per day.
2/5
Ohio average: 2.4/5
Quality Measures Info Official CMS rating based on clinical outcomes for residents.
5/5
Ohio average: 4.4/5

Nursing care per resident

Info Average daily nursing hours per resident (adjusted for acuity). Higher values indicate more nursing time per resident.
3h 21m per day

This home provides 6% less nursing time per resident than the state average.

Ohio average: 3h 32m per day

Staffing hours breakdown

Info Hours of care per resident per day, broken down by staff type. Data from CMS Medicare.
Staff type Facility State avg National avg
Registered Nurse (RN) Info Registered nurse hours per resident per day. 44m per day 38m per day 41m per day
LPN / LVN Info Licensed Practical Nurse / Licensed Vocational Nurse hours per resident per day. 58m per day 58m per day 52m per day
Nurse Aide Info Nurse aide hours per resident per day. 2h 12m per day 2h 8m per day 2h 21m per day
Total Nursing (Weekend) Info Total number of nurse staff hours per resident per day on weekends. 3h 30m per day 3h 17m per day 3h 26m per day
Physical Therapist Info Physical therapist staff hours per resident per day. 6m per day 3m per day 4m per day
RN (Weekend) Info Registered nurse hours per resident per day on weekends. 23m per day 25m per day 29m per day

Capacity and availability

This home usually has limited availability

Occupancy is moderate, suggesting balanced demand.

Similar demand to the Ohio average
Occupancy rate 88.5%
Residents per day (avg) 81
Occupancy rate
88.5%
Residents per day (avg)
81

Who this home usually serves

TYPE OF STAY

Primarily short stays

Residents typically stay for brief periods, with frequent admissions and discharges throughout the year.

Might be optimal for
Post-acute recovery Temporary care Transitional stays

Breakdown by payment type

Medicare

25% of new residents, usually for short-term rehab.

Typical stay 22 days

Private pay

71% of new residents, often for short stays.

Typical stay 1 - 2 months

Medicaid

4% of new residents, often for long-term daily care.

Typical stay 11 - 12 months

Finances and operations

Proprietary home
Corporation
Home revenue
$13.6M
Operating loss
-$649.0K
Proprietary home Corporation
Home revenue
$13,628,153.00
Operating loss
$-649,002.00
Payroll costs Info The portion of the home's budget spent on staff, including nurses, caregivers, and other employees who support care and operations.
$5.0M
36.6% of revenue
Other operating costs Info All remaining costs needed to run the home, such as food, utilities, building maintenance, supplies and administrative expenses.
$9.3M
Total costs $14.3M
Walk Score
Walk Score: 22 / 100
Car-dependent. Most errands require a car, with limited nearby walkable options.

About this community

Care Services

Nursing Services
Rehabilitation Services
Respite Care
Skilled Nursing
Licensed Nurses/CNAs
24-Hour Staffing
Short-Term Rehab

All Levels of Care

Skilled Nursing
Rehabilitation
Long Term Care
Assisted Living
Memory Care
Personal Care
Dialysis Care
Vent Management

Amenities & Lifestyle

Physical Therapy
Occupational Therapy
Speech Therapy
Short-Term Care
Long-Term Care
Hospice Care
Respite Care
Dialysis Care
Vent Management
24-hour Skilled Nursing Care

Programs & Activities

Specific Programs
Skilled Nursing, Rehabilitation, Long Term Care, Assisted Living, Memory Care, Personal Care, Dialysis Care, Vent Management

What does this home offer?

Accepts Medicaid icon

Accept Medicaid: Yes, Accept

Total residents icon

Total Residents: 90 Residents

Housing options icon

Housing Options: Private / Semi-Private Rooms

Building type icon
Building type icon

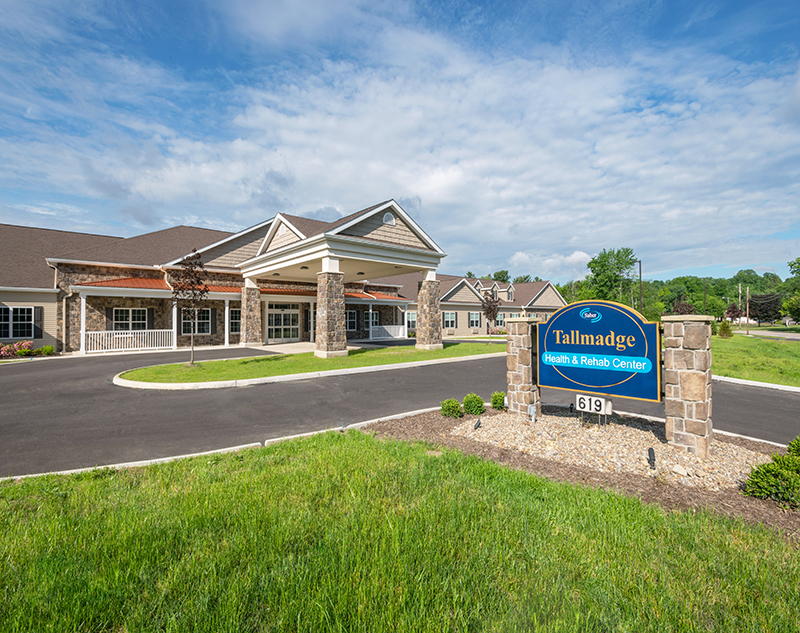
Building Type: Single-story

Types of Care at Tallmadge Health and Rehab

Nursing Home Assisted Living
Contact Tallmadge Health and Rehab

Compare Nursing Homes around Tallmadge

The information below is reported by the Ohio Department of Health, Bureau of Survey and Certification.
Summit Villa Care Center
SNF

Nursing Homes 24/7 care needed

Tallmadge
75
No
24
MCGONAGLE, GERRI
92.5%
$9,769,030.00
$3,413,461.00
34.9%
66.30
4/5
3.1708
5/5
1/5
4/5
-
7
-
-8%
-10%
+18%
Private / Semi-Private Rooms
Tallmadge Health and Rehab
AL

Assisted Living For seniors needing help with daily tasks but not full-time nursing.

IL

Independent Living For self-sufficient seniors seeking community and minimal assistance.

MC

Memory Care Specialized care for those with Memory Loss, Alzheimer's, or dementia, ensuring safety and support.

SNF

Nursing Homes 24/7 care needed

Tallmadge
90
No
22
BURTON, SARA
88.5%
$13,387,552.00
$4,984,383.00
37.2%
81.20
3/5
3.3432
2/5
2/5
5/5
1
42
3
+64%
-6%
+12%
Private / Semi-Private Rooms

Places of interest near Tallmadge Health and Rehab

Address 1.4 miles from city center

Address 619 Northwest Ave, Tallmadge, OH 44278

Calculate Travel Distance to Tallmadge Health and Rehab

Add your location

Address

Staffing Data

Source: CMS Payroll-Based Journal (Q2 2025)

192
Total Staff
136
Employees
56
Contractors
36,389
Total Hours (Quarter)
48
Avg Staff/Day
8.3
Avg Shift (hrs)
Nursing Staff Breakdown
Role Count Avg Shift (hrs) Uses Contractors?
Registered Nurse299.4 Yes
Licensed Practical Nurse358.8 Yes
Certified Nursing Assistant618.9 No
Staff by Category
Administration
3 staff
6.9hs shift avg
Nursing Staff
135 staff
9hs shift avg
Physicians & Practitioners
5 staff
8.2hs shift avg
Therapy Services
27 staff
5.4hs shift avg
Activities & Recreation
14 staff
8.4hs shift avg
Social Services
1 staff
7.1hs shift avg
Dietary Services
4 staff
7hs shift avg
Other Services
3 staff
7.7hs shift avg
Contractor Analysis
10.9%
of total hours from contractors
3,949 contractor hours this quarter
Physical Therapy Assistant: 8 Registered Nurse: 17 Speech Language Pathologist: 3 RN Director of Nursing: 2 Respiratory Therapy Technician: 5 Physical Therapy Aide: 1 Licensed Practical Nurse: 7 Clinical Nurse Specialist: 1 Occupational Therapy Aide: 1 Qualified Social Worker: 1 Occupational Therapy Assistant: 8 Medical Director: 2
Role Employees Contractors Total Staff Total Hours Days Worked % of Days Avg Shift (hrs)
Certified Nursing Assistant6106115,52191100%8.9
Licensed Practical Nurse287356,28691100%8.8
Registered Nurse1217293,73991100%9.4
Qualified Activities Professional140142,71891100%8.4
Clinical Nurse Specialist3141,1637178%8.2
RN Director of Nursing2241,0637279%8.6
Respiratory Therapy Technician0557067987%6
Other Dietary Services Staff3036788492%6.7
Dental Services Staff3036496571%7.7
Dietitian1014976673%7.5
Administrator1014886167%8
Nurse Practitioner1014806066%8
Nurse Aide in Training6064743741%10.3
Qualified Social Worker0114336167%7.1
Speech Language Pathologist0334016673%5.6
Physical Therapy Assistant0883906571%5.6
Physical Therapy Aide0113896268%6.3
Occupational Therapy Aide1122663943%6.6
Occupational Therapy Assistant088403943%0.9
Medical Director022131213%1.1

Health Inspection History

Inspections
Total health inspections 13

Ohio average 6.7


Last Health inspection on Oct 2025

Total health citations 42
Citations per inspection
3.23

Health citations are formal notices following inspections when they fail to comply with safety and care standards.

11 of 42 citations resulted from standard inspections; 22 of 42 resulted from complaint investigations; and 9 of 42 came from combined inspections (standard and complaint).

Breakdown of citation severity (last 3 years)
Critical Health citations More info 0
100% better than Ohio average

Ohio average: 0.3


Serious Health citations More info 3
233% worse than Ohio average

Ohio average: 0.9

0 critical citations More info Ohio average: 0.3

3 serious citations More info Ohio average: 0.9

39 moderate citations More info Ohio average: 29

0 minor citations More info Ohio average: 0.7
Citations history (last 3 years)
Quality of Care moderate citation Oct 16, 2025
Corrected

Quality of Care moderate citation Oct 09, 2025
Corrected

Quality of Care serious citation Oct 09, 2025
Corrected

Abuse/Neglect moderate citation Apr 01, 2025
Corrected

Facility Characteristics

Source: CMS Long-Term Care Facility Characteristics (Data as of Jan 2026)

Ownership: For-Profit Corporation
Part of: Saber Healthcare LLC
Resident Census by Payment Source
88 Total Residents
Medicare 11 (12.5%)
Medicaid 56 (63.6%)
Private Pay/Other 21 (23.9%)
Specialized Care Beds
15 Total Specialty Beds
16.7% of Bed Capacity
15
Ventilator Beds
16.7%
Programs & Services
Residents' Group
Nurse Aide Training
Family Engagement

Active councils help families stay involved in care decisions and facility operations.

Quality of care over time

These measures show how residents usually do over time at this home, based on health outcomes and preventive care.

High-risk clinical events score Info A composite score based on pressure ulcers, falls with injury, weight loss, walking ability decline, and activities of daily living decline. 6.1
In line with Ohio average

Ohio average: 5.8

Functional decline score Info A composite score based on activities of daily living decline, walking ability decline, and incontinence. 15.4
22% worse than Ohio average

Ohio average: 12.7

Long-stay resident measures
Need for Help with Daily Activities Increased Info Percent of long-stay residents whose need for help with daily activities has increased 6.0%
12% better than Ohio average

Ohio average: 6.8%

Walking Ability Worsened Info Percent of long-stay residents whose ability to move independently worsened 10.9%
23% worse than Ohio average

Ohio average: 8.9%

Low Risk Residents with Bowel/Bladder Incontinence Info Percent of low risk long-stay residents who lose control of their bowels or bladder 29.4%
34% worse than Ohio average

Ohio average: 22.0%

Falls with Major Injury Info Percent of long-stay residents experiencing one or more falls with major injury 2.8%
18% better than Ohio average

Ohio average: 3.4%

High Risk Residents with Pressure Ulcers Info Percent of long-stay high risk residents with pressure ulcers 4.7%
22% worse than Ohio average

Ohio average: 3.9%

Urinary Tract Infection Info Percent of long-stay residents with a urinary tract infection 0.4%
27% better than Ohio average

Ohio average: 0.5%

Lost Too Much Weight Info Percent of long-stay residents who lose too much weight 6.0%
In line with Ohio average

Ohio average: 6.2%

Depressive Symptoms Info Percent of long-stay residents who have depressive symptoms 8.4%
65% better than Ohio average

Ohio average: 24.0%

Antipsychotic Use Info Percent of long-stay residents who received an antipsychotic medication 3.8%
56% better than Ohio average

Ohio average: 8.4%

Pneumococcal Vaccine Info Percent of long-stay residents assessed and appropriately given the pneumococcal vaccine 56.4%
39% worse than Ohio average

Ohio average: 92.4%

Influenza Vaccine Info Percent of long-stay residents assessed and appropriately given the seasonal influenza vaccine 87.8%
7% worse than Ohio average

Ohio average: 94.5%

Short-stay resident measures
Pneumococcal Vaccine Info Percent of short-stay residents assessed and appropriately given the pneumococcal vaccine 44.9%
43% worse than Ohio average

Ohio average: 78.0%

Antipsychotic medication increase Info Percent of short-stay residents who newly received an antipsychotic medication 2.5%
93% worse than Ohio average

Ohio average: 1.3%

Influenza Vaccine Info Percent of short-stay residents assessed and appropriately given the seasonal influenza vaccine 47.1%
38% worse than Ohio average

Ohio average: 75.6%

Re-hospitalized after SNF stay Info Percentage of short-stay residents who were re-hospitalized after their nursing home admission. 22.7%
10% better than Ohio average

Ohio average: 25.1%

Emergency department visits Info Percentage of short-stay residents who had an outpatient emergency department visit. 11.9%
5% better than Ohio average

Ohio average: 12.5%

Falls with major injury Info Percentage of SNF residents who experience falls with major injury during their stay. 4.1%
430% worse than Ohio average

Ohio average: 0.8%

Ability to care for self at discharge Info Percentage of residents at or above expected ability to care for themselves at discharge. 57.6%
7% better than Ohio average

Ohio average: 53.7%

Successful return to home or community Info Rate of successful return to home or community from a skilled nursing facility. 52.5%
In line with Ohio average

Ohio average: 50.6%

Penalties and fines

Federal penalties imposed by CMS for regulatory violations, including civil money penalties (fines) and denials of payment for new Medicare/Medicaid admissions.

Source: CMS Penalties Database (Data as of Jan 2026)

Total fines amount $11K
84% lower than Ohio average

Ohio average: $69K

Number of fines 1
46% fewer fines than Ohio average

Ohio average: 1.9

Payment Denials Info Serious action where Medicare and/or Medicaid temporarily stops payments for new residents until issues are fixed. 0
100% fewer payment denials than Ohio average

Ohio average: 0.5

Fines amount comparison
This facility $11K
Ohio average $69K
Penalty History

Penalties are imposed by CMS for violations of federal nursing home regulations.

Civil Money Penalty Info Fines imposed for noncompliance, which can be assessed per day or per instance of violation. Dec 19, 2024
$11K

Last updated: Jan 2026

Guides for Better Senior Living

Care Cost Calculator: See Prices in Your Area

Nursing Home Data Explorer

Don’t Wait Too Long: 7 Red Flag Signs Your Parent Needs Assisted Living Now

The True Cost of Assisted Living in 2025 – And How Families Are Paying For It

Understanding Senior Living Costs: Pricing Models, Discounts & Financial Assistance

Financial Aid for Ohio Seniors

Get financial aid guidance

PASSPORT Waiver

Ohio Medicaid PASSPORT

Age 60+, Ohio resident, Medicaid-eligible, nursing home-level care need.

~$2,829/month (300% FBR, individual).

$2,000 (individual), $3,000 (couple).

Administered through regional agencies; waitlists possible.

Ohio Home Care Program (non-Medicaid)

OH HCP

Age 60+, Ohio resident, at risk of decline.

~$2,000/month (individual, varies).

$5,000 (individual).

Limited funding; regional variation.

Assisted Living Waiver (ALW)

Ohio Assisted Living Waiver

Age 21+ (65+ prioritized), OH resident, Medicaid-eligible, NFLOC.

~$2,829/month (individual); QIT required.

$2,000 (individual), $3,000 (couple).

Covers ~300 facilities; room/board not included (separate cost).

Program of All-Inclusive Care for the Elderly (PACE)

Ohio PACE (e.g., McGregor PACE)

Age 55+, OH resident (specific counties), NFLOC, safe with PACE support.

~$2,829/month (Medicaid-eligible); private pay option available.

$2,000 (individual), $3,000 (couple) for Medicaid enrollees.

Available in 9 counties (e.g., Cuyahoga, Franklin); expanding via Healthy Aging Grants.

Medicare Savings Program (MSP)

Ohio Medicare Savings Program

Age 65+ or disabled, OH resident, Medicare Part A/B.

~$2,510/month (QMB), ~$3,380/month (SLMB), ~$3,598/month (QI)—individual.

$9,430 (individual), $14,130 (couple).

Three tiers; includes Extra Help for Part D; no waitlist.

Home Energy Assistance Program (HEAP)

Ohio HEAP

Age 60+ prioritized, OH resident, low-income household.

~$3,970/month (individual, 185% FPL).

Not assessed; income-focused.

Covers gas, electric, oil; emergency aid via Winter/Summer Crisis Programs.

Family Caregiver Support Program (FCSP)

Ohio Family Caregiver Support Program

Caregivers of 60+ needing care or 55+ caregivers of others; OH resident; functional needs (2+ ADLs).

Prioritizes ~$24,980/year (individual); no strict cap.

Not assessed; need-based.

12 AAAs; rural/low-income priority; volunteer respite option.

Senior Community Service Employment Program (SCSEP)

Ohio SCSEP

Age 55+, unemployed, low-income, OH resident.

~$1,983/month (125% FPL).

Not specified; income-focused.

Priority for veterans, rural residents; AARP partnership.

VA Aid and Attendance (A&A) and Housebound Benefits

Ohio VA Aid and Attendance/Housebound

Age 65+ or disabled veteran/spouse, OH resident, wartime service, need for ADL help (A&A) or homebound.

Net income < ~$1,984/month (veteran with dependent, A&A); pension offsets income.

~$155,356 (net worth limit).

High veteran demand; supports care in multiple settings.

Homestead Exemption

Ohio Homestead Exemption

Age 65+ (or disabled), OH resident, homeowner, low-income.

~$38,500/year (individual, adjusted annually).

Not assessed; home ownership required.

Reduces taxable value by $25,000; applies to primary residence.

Save the Dream Ohio (Homeowner Assistance Fund)

Ohio Save the Dream

Age 60+ prioritized, OH resident, homeowner, hardship post-Jan 21, 2020.

~$147,600/year (family of 4, 150% AMI; varies by county).

Not assessed; hardship-focused.

Covers delinquent mortgages, utilities, taxes; max $25,000 mortgage aid.

Who we are

Your Senior Care Partner, Every Step of the Way

We help families find affordable senior communities and unlock same day discounts, Medicaid, and Medicare options tailored to your needs.

Contact us Today
Tour Icon
Planning a tour? Check our touring checklist.
Chat Icon
Thinking of living here? We can help you speak to a current resident