Total health inspections
6
Illinois average 10.4
Last Health inspection on Oct 2025

We arrange tours, appointments, and even moving support so you don’t have to
Thank you for your interest!
Our team will be in touch shortly to help with next steps.


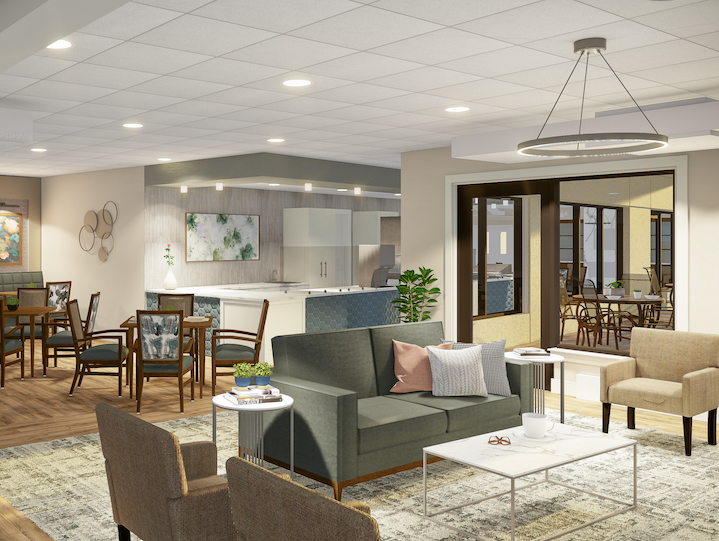

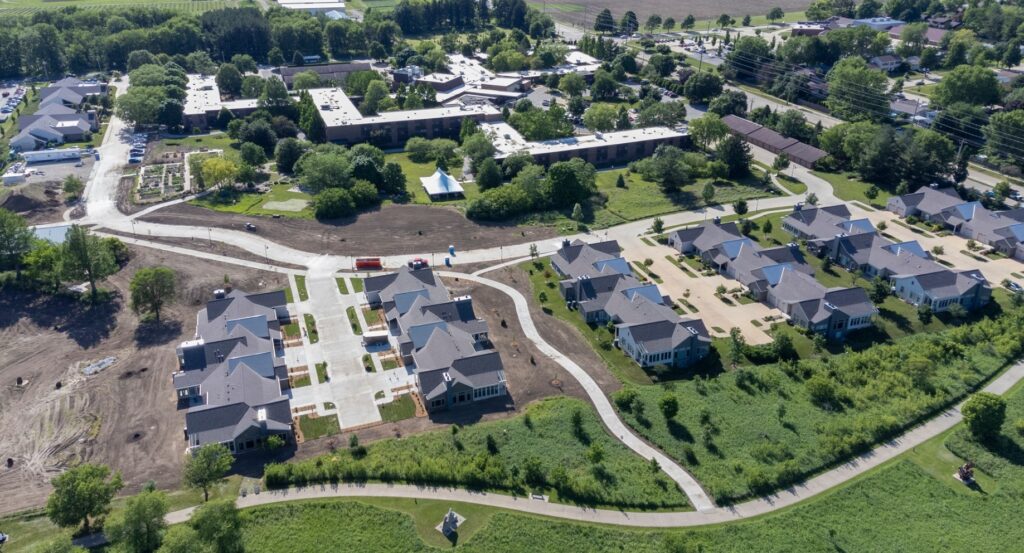
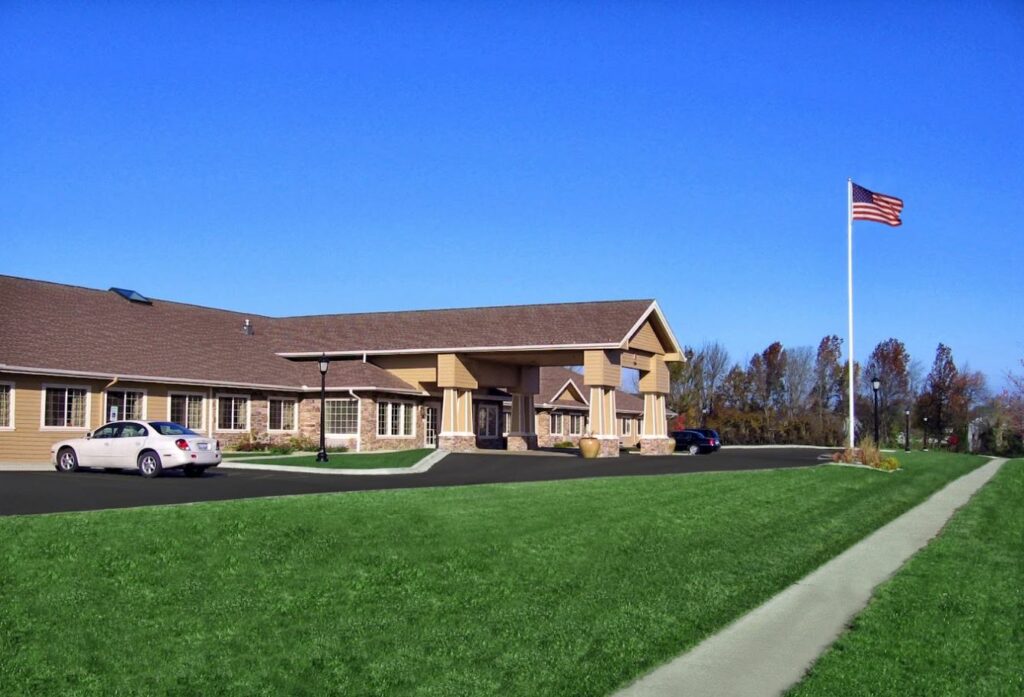
ClarkLindsey, East Central Illinois’ first and only nonprofit Life Plan Community, offers a retirement living experience on a stunning 27-acre campus bordering Urbana’s Meadowbrook Park and the University of Illinois at Champaign. The community’s extensive services and amenities make retirement living easy and carefree, allowing residents to spend their time doing the things they want to do, not the things they have to do. ClarkLindsey strives to foster a culture of excellence centered around well-being and encompassing its four core values: meaningful life, engaged staff, inclusive community, and excellence.
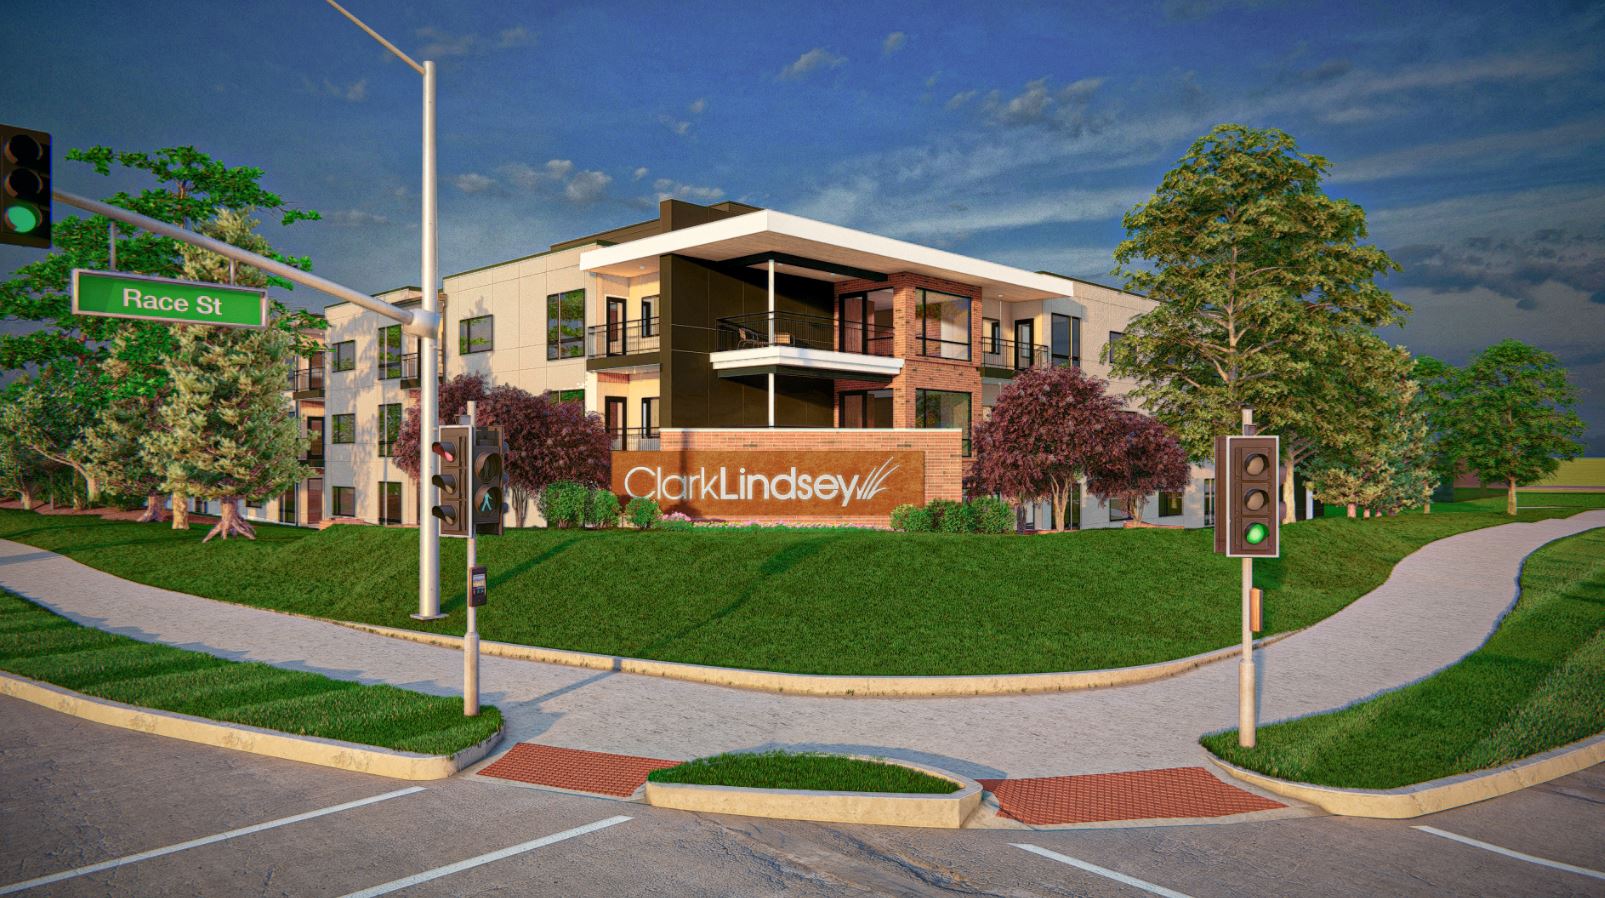
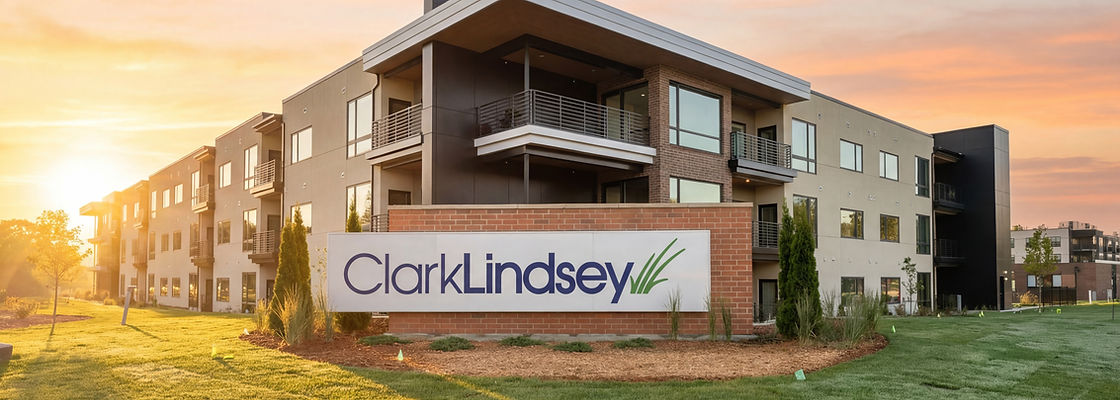
As a Life Plan Community, ClarkLindsey provides multiple levels of care on its campus, ensuring that residents have a place to live for the rest of their lives, even as their health needs change over time. The community offers assisted living, memory care, skilled nursing, and rehabilitation services, with the new MeadowLark expansion set to include catered assisted living and memory care assisted living apartments. Residents have access to many amenities, services, and activities on the ClarkLindsey campus, including social gatherings, fitness activities, award-winning gardens, and picturesque views of the prairie. The community is excited to expand the possibilities with a new building project, including a modern three-story apartment building with catered assisted living and memory care assisted living apartments, and another three-story apartment building with independent living apartments.
May offer a more intimate, personalized care environment.
Lower occupancy suggests more openings may be available.
Residents typically stay for brief periods, with frequent admissions and discharges throughout the year.
40% of new residents, usually for short-term rehab.
60% of new residents, often for short stays.
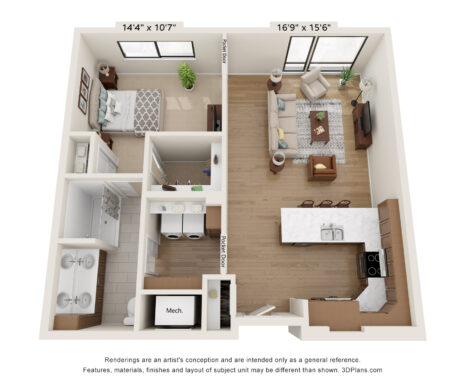
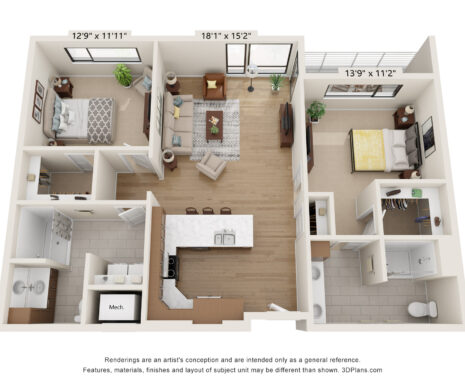
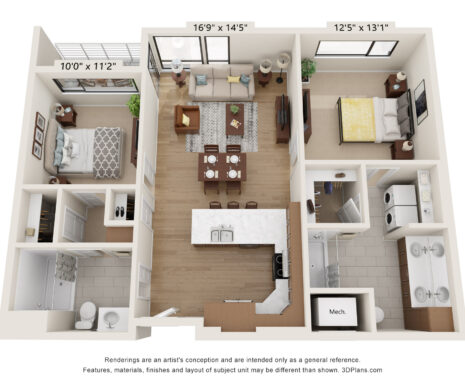
The Flats by Clark Lindsey (Expansion) is legally operated by Clark-lindsey Village, Inc..
Room Sizes: 827 / 993 - 1332 sq. ft.
Housing Options: 1 Bed / 2 Bed
Building Type: 3-story
Fitness and Recreation
In Illinois, the Department of Public Health, Office of Health Care Regulation conducts annual unannounced surveys to assess compliance with state and federal healthcare facility standards.
1 other visits
Deficiencies indicate regulatory issues. A higher number implies the facility had several areas requiring improvement.
Illinois average: 7 deficiencies
The most recent inspection on October 21, 2025, found the facility generally in compliance with assisted living regulations but noted a technical deficiency regarding unsigned physician assessments. Earlier inspections showed more significant deficiencies, including a substantiated complaint investigation in September 2025 where inspectors cited failures to document fall risks and fall prevention interventions, which was linked to a resident’s fatal fall. Prior reports from March 2025 identified multiple issues such as incomplete emergency drills, untimely injury reporting, incomplete background checks, unsigned service plans, and missed tuberculosis testing. No fines, immediate jeopardy findings, or license actions were listed in the available reports. The inspection history indicates some improvement by the most recent review, though documentation and service planning remain areas needing attention.
Illinois average 10.4
Last Health inspection on Oct 2025
Illinois average 36.8
Illinois average 3.68
Health citations are formal notices following inspections when they fail to comply with safety and care standards.
21 of 32 citations resulted from standard inspections; and 11 of 32 resulted from complaint investigations.
Illinois average: 0.7
Illinois average: 3.6
Data sourced from CMS Health Deficiencies reports. Citation severity codes range from A (least serious) to L (most serious). Immediate Jeopardy (J-L) citations indicate situations where the facility's noncompliance has placed residents at risk of death or serious harm.
Nursing Home Licensed facility providing 24/7 skilled nursing care for residents with complex, ongoing medical needs. Staffed by RNs, LPNs, and CNAs. Inspected and star-rated annually by CMS. Accepts Medicare (short-term rehab) and Medicaid (long-term care).
Assisted Living A licensed, long-term care setting for seniors or individuals with disabilities who need help with daily activities — like bathing, dressing, and medication management — but not 24-hour skilled nursing. Offers housing, meals, and around-the-clock support while aiming to maximize resident independence.
Independent Living Lifestyle-focused communities for older adults offering dining, activities, and transportation with minimal personal care. Best for active, independent seniors who want community without medical support.
Memory Care Secured, specialized care for people living with Alzheimer's or dementia. Staff trained in cognitive impairment, with higher staff-to-resident ratios and an environment designed to reduce confusion and wandering risk.
Nursing Home Licensed facility providing 24/7 skilled nursing care for residents with complex, ongoing medical needs. Staffed by RNs, LPNs, and CNAs. Inspected and star-rated annually by CMS. Accepts Medicare (short-term rehab) and Medicaid (long-term care).
Assisted Living A licensed, long-term care setting for seniors or individuals with disabilities who need help with daily activities — like bathing, dressing, and medication management — but not 24-hour skilled nursing. Offers housing, meals, and around-the-clock support while aiming to maximize resident independence.
Memory Care Secured, specialized care for people living with Alzheimer's or dementia. Staff trained in cognitive impairment, with higher staff-to-resident ratios and an environment designed to reduce confusion and wandering risk.
Memory Care Secured, specialized care for people living with Alzheimer's or dementia. Staff trained in cognitive impairment, with higher staff-to-resident ratios and an environment designed to reduce confusion and wandering risk.
Respite Care Short-term temporary care — days to weeks — to give family caregivers a break. Full care provided during the stay. Often used after hospitalization or to trial a facility before a permanent placement decision.
Assisted Living A licensed, long-term care setting for seniors or individuals with disabilities who need help with daily activities — like bathing, dressing, and medication management — but not 24-hour skilled nursing. Offers housing, meals, and around-the-clock support while aiming to maximize resident independence.
Independent Living Lifestyle-focused communities for older adults offering dining, activities, and transportation with minimal personal care. Best for active, independent seniors who want community without medical support.
![]() 2.2 miles from city center — 1.62 miles to nearest hospital (McKinley Health Center)
2.2 miles from city center — 1.62 miles to nearest hospital (McKinley Health Center)
![]() 101 W Windsor Rd, Urbana, IL 61802
101 W Windsor Rd, Urbana, IL 61802
Add your location
This data corresponds to Q2 2025 and is based on CMS Payroll-Based Journal.
Illinois average ratio: 1.90:1
Illinois average: 7.6 hours
Manages medical care and health needs.
This role is partially covered by contractors.
Assists with medical care and medications.
No contractors work on this role.
Helps with daily care and mobility.
No contractors work on this role.
Total hours from contractors
4,313 contractor hours this quarter
| Certified Nursing Assistant | 44 | 0 | 44 | 8,228 | 91 | 100% | 9.6 |
| Clinical Nurse Specialist | 3 | 0 | 3 | 1,476 | 70 | 77% | 8.8 |
| Speech Language Pathologist | 0 | 4 | 4 | 1,391 | 67 | 74% | 7.2 |
| Licensed Practical Nurse | 7 | 0 | 7 | 1,302 | 87 | 96% | 10.4 |
| Registered Nurse | 12 | 1 | 13 | 1,094 | 73 | 80% | 9.4 |
| Physical Therapy Assistant | 0 | 4 | 4 | 675 | 70 | 77% | 7.7 |
| Qualified Social Worker | 0 | 2 | 2 | 587 | 68 | 75% | 6.3 |
| Respiratory Therapy Technician | 0 | 3 | 3 | 551 | 65 | 71% | 8 |
| Physical Therapy Aide | 0 | 5 | 5 | 539 | 65 | 71% | 6.2 |
| RN Director of Nursing | 0 | 1 | 1 | 488 | 42 | 46% | 11.6 |
| Administrator | 1 | 0 | 1 | 480 | 60 | 66% | 8 |
| Nurse Practitioner | 1 | 0 | 1 | 480 | 60 | 66% | 8 |
| Mental Health Service Worker | 1 | 0 | 1 | 472 | 59 | 65% | 8 |
| Other Dietary Services Staff | 2 | 0 | 2 | 458 | 61 | 67% | 7.5 |
| Occupational Therapy Aide | 0 | 1 | 1 | 35 | 16 | 18% | 2.2 |
| Medical Director | 0 | 1 | 1 | 22 | 11 | 12% | 2 |
| Occupational Therapy Assistant | 0 | 1 | 1 | 18 | 6 | 7% | 3 |
Source: CMS Long-Term Care Facility Characteristics (Data as of Jan 2026)
Residents meet regularly to discuss policies, care quality, and activities
Family members meet regularly to discuss policies, care quality, and activities
Part of a Continuing Care Retirement Community offering multiple care levels
Organized group of family members that meets regularly to discuss facility policies, resident care, and activities.
Organized group of residents that meets regularly to discuss facility policies, quality of life, and activities.
Data sourced from CMS Long-Term Care Facility Characteristics quarterly report. Payer mix reflects the current resident census by primary payment source.
These measures show how residents usually do over time at this home, based on health outcomes and preventive care.
Illinois average: 9.7
Illinois average: 18.6
Illinois average: 15.5%
Illinois average: 21.6%
Illinois average: 3.4%
Illinois average: 5.3%
Illinois average: 1.8%
Illinois average: 6.5%
Illinois average: 48.1%
Illinois average: 20.2%
Illinois average: 89.2%
Illinois average: 68.3%
Illinois average: 2.3%
Illinois average: 63.0%
Quality measures are calculated from Minimum Data Set (MDS) assessments. For most measures, lower percentages indicate better care quality.
Federal penalties imposed by CMS for regulatory violations, including civil money penalties (fines) and denials of payment for new Medicare/Medicaid admissions.
Source: CMS Penalties Database (Data as of Jan 2026)
Illinois average: $143K
Illinois average: 3.0
Illinois average: 1.1
Penalties are imposed by CMS for violations of federal nursing home regulations.
Last updated: Jan 2026
Historical financial and operational data for The Flats by Clark Lindsey (Expansion) based on CMS SNF Cost Reports.
Loading trend charts...
Care Cost Calculator: See Prices in Your Area
Nursing Home Data Explorer
Don’t Wait Too Long: 7 Red Flag Signs Your Parent Needs Assisted Living Now
The True Cost of Assisted Living in 2025 – And How Families Are Paying For It
Understanding Senior Living Costs: Pricing Models, Discounts & Financial Assistance

Touring a community? Use this expert-backed checklist to stay organized, ask the right questions, and find the perfect fit.
We'll send you a PDF version of the touring checklist.