


Total health inspections
6
Illinois average 10.4
Last Health inspection on Oct 2025
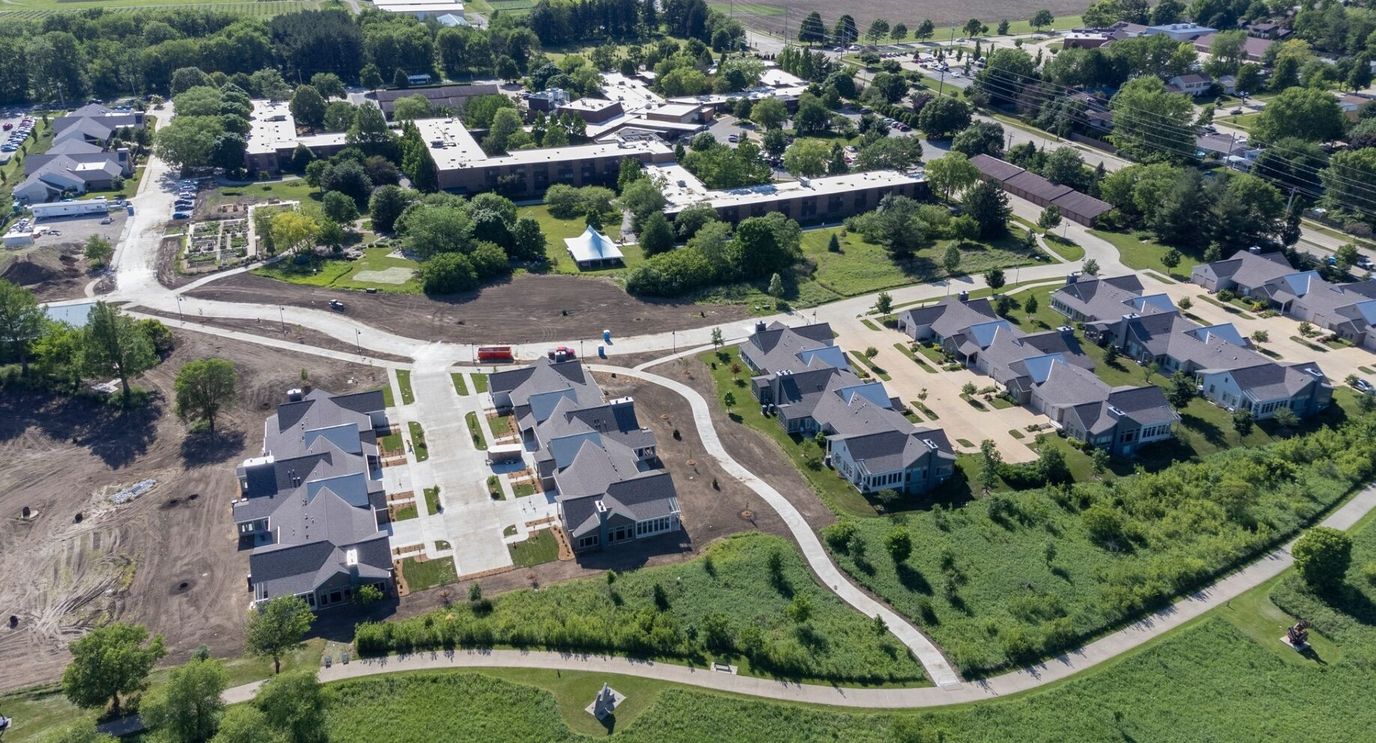


Dedicated to older adults 62 and above, ClarkLindsey in Urbana, Illinois, offers independent living, assisted living, memory care, nursing care, adult day services, and home care. Operated by Clark-Lindsey Village, Inc., the community offers 64 beds in a single-story setting, including both permanent residences and dedicated memory care accommodations, with housing options such as The Village Apartments and Meadow Edge Villas.
Residents benefit from services that simplify daily life, including housekeeping, laundry, linen service, transportation, and included utilities. Rehabilitation programs, short-term recovery services, and 24-hour staffing support individuals with both ongoing and temporary care needs. Nursing services provide a significant level of clinical support through registered nurses, licensed practical nurses, and nurse aides.
State inspections have frequently reviewed areas related to resident well-being, resident rights, safety practices, pharmacy operations, and infection prevention. Families exploring the community may wish to discuss these topics with staff to better understand current procedures and oversight.
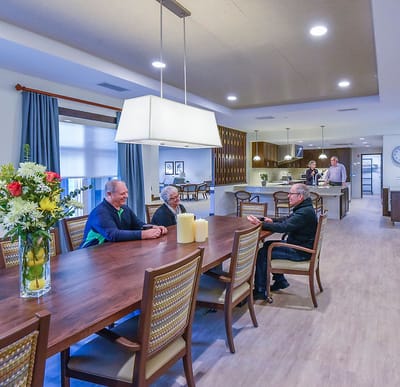
Amenities support an active and engaged lifestyle through access to a fitness center, gym, wellness center, library, dining venues, walking paths, and garden spaces. Volunteer opportunities and support groups further encourage social involvement. The community accepts both Medicare and private pay and is located in an area where most errands require transportation.
| Staff type | Hours / Day / Resident | vs state avg |
|---|---|---|
|
Registered Nurse (RN)
| 1h 25m per day | ▲ 97% State avg: 43m per day · National avg: 41m per day |
|
LPN / LVN
| 40m per day | ■ Avg State avg: 39m per day · National avg: 52m per day |
|
Nurse Aide
| 3h 35m per day | ▲ 69% State avg: 2h 7m per day · National avg: 2h 20m per day |
|
Weekend Total Nursing
| 4h 36m per day | ▲ 48% State avg: 3h 6m per day · National avg: 3h 27m per day |
|
Physical Therapist
| 10m per day | ▲ 239% State avg: 3m per day · National avg: 4m per day |
|
Weekend RN
| 47m per day | ▲ 40% State avg: 33m per day · National avg: 29m per day |
ClarkLindsey is legally operated by Clark-Lindsey Village, Inc.
In Illinois, the Department of Public Health, Office of Health Care Regulation conducts annual unannounced surveys to assess compliance with state and federal healthcare facility standards.
Inspections
| This Facility | IL Average | vs. IL Avg |
|---|---|---|---|
|
Total inspections
| 6 | 8 | This facility has had 25% fewer total inspections than the Illinois average (6 vs. IL avg 8). More inspections can mean more regulatory scrutiny rather than worse care.↓ 25% fewer |
Illinois average 10.4
Last Health inspection on Oct 2025
Illinois average 36.8
Illinois average 3.68
Health citations are formal notices following inspections when they fail to comply with safety and care standards.
21 of 32 citations resulted from standard inspections; and 11 of 32 resulted from complaint investigations.
Illinois average: 0.7
Illinois average: 3.6
Reporting period: October 1 – December 31, 2025 (Q4 2025). Source: CMS Payroll-Based Journal report.
Manages medical care and health needs.
Assists with medical care and medications.
Helps with daily care and mobility.
Total hours from contractors
2,496 contractor hours this quarter
| Certified Nursing Assistant | 33 | 0 | 33 | 7,607 | 92 | 100% | 8.8 |
| Clinical Nurse Specialist | 3 | 0 | 3 | 1,293 | 72 | 78% | 8.1 |
| Registered Nurse | 9 | 0 | 9 | 1,232 | 77 | 84% | 10.3 |
| Licensed Practical Nurse | 4 | 0 | 4 | 1,057 | 78 | 85% | 11.6 |
| Physical Therapy Assistant | 0 | 3 | 3 | 752 | 76 | 83% | 5.3 |
| Dental Services Staff | 1 | 0 | 1 | 536 | 66 | 72% | 8.1 |
| Dietitian | 1 | 0 | 1 | 499 | 62 | 67% | 8 |
| Administrator | 1 | 0 | 1 | 496 | 62 | 67% | 8 |
| Nurse Practitioner | 2 | 0 | 2 | 472 | 59 | 64% | 8 |
| Speech Language Pathologist | 0 | 4 | 4 | 456 | 71 | 77% | 3.1 |
| Mental Health Service Worker | 1 | 0 | 1 | 437 | 58 | 63% | 7.5 |
| Respiratory Therapy Technician | 0 | 2 | 2 | 367 | 71 | 77% | 2.8 |
| Physical Therapy Aide | 0 | 4 | 4 | 360 | 68 | 74% | 4.3 |
| RN Director of Nursing | 1 | 1 | 2 | 341 | 30 | 33% | 9.5 |
| Qualified Social Worker | 0 | 1 | 1 | 260 | 61 | 66% | 4.3 |
| Occupational Therapy Aide | 0 | 1 | 1 | 112 | 14 | 15% | 8 |
| Occupational Therapy Assistant | 0 | 1 | 1 | 15 | 3 | 3% | 5 |
| Medical Director | 0 | 1 | 1 | 12 | 12 | 13% | 1 |
Includes penalties issued in 2025
Federal penalties imposed by CMS for regulatory violations, including civil money penalties (fines) and denials of payment for new Medicare/Medicaid admissions.
Source: CMS Penalties Database (Data as of Jan 2026)
Illinois average: $143K
Illinois average: 3.0
Illinois average: 1.1
Penalties are imposed by CMS for violations of federal nursing home regulations.
2 penalties in the past 3 years
Multiple penalties were reported in the last 3 years.
Last updated: Jan 2026
These measures show how residents usually do over time at this home, based on health outcomes and preventive care.
Illinois average: 9.7
Illinois average: 18.6
Illinois average: 15.5%
Illinois average: 21.6%
Illinois average: 3.4%
Illinois average: 5.3%
Illinois average: 1.8%
Illinois average: 6.5%
Illinois average: 48.1%
Illinois average: 20.2%
Illinois average: 89.2%
Illinois average: 68.3%
Illinois average: 2.3%
Illinois average: 63.0%
Quality measures are calculated from Minimum Data Set (MDS) assessments. For most measures, lower percentages indicate better care quality.
40% of new residents, usually for short-term rehab.
60% of new residents, often for short stays.
Source: CMS Long-Term Care Facility Characteristics (Data as of Jan 2026)
Residents meet regularly to discuss policies, care quality, and activities
Family members meet regularly to discuss policies, care quality, and activities
Part of a Continuing Care Retirement Community offering multiple care levels
Organized group of family members that meets regularly to discuss facility policies, resident care, and activities.
Organized group of residents that meets regularly to discuss facility policies, quality of life, and activities.
Data sourced from CMS Long-Term Care Facility Characteristics quarterly report. Payer mix reflects the current resident census by primary payment source.
Historical financial and operational data for ClarkLindsey from 2011–2023, based on CMS SNF Cost Reports.
Key figures below are for fiscal year ending in 12/2023.
Based on CMS SNF Cost Report for fiscal year ending in 12/2023.
Pets Allowed
Housing Options: 1 Bed / 2 Bed
Building Type: Single-story
Transportation Services
Housekeeping Services
Social and Recreational Activities
Residents typically stay for brief periods, with frequent admissions and discharges throughout the year.
Most new residents arrive under private pay (60% of admissions), and a typical private pay stay runs around 7 - 8 months.
Coverage residents most often arrive under.
Coverage residents most often leave under.
![]() 2.2 miles from city center
2.2 miles from city center
![]() Estimated distance in miles from Urbana's city center to ClarkLindsey's address, calculated via Google Maps.
Estimated distance in miles from Urbana's city center to ClarkLindsey's address, calculated via Google Maps.
Add your location
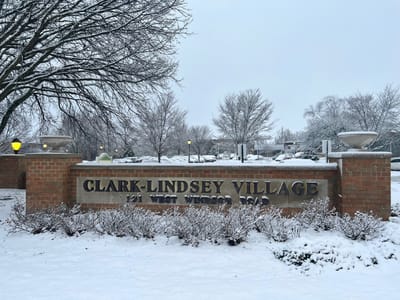
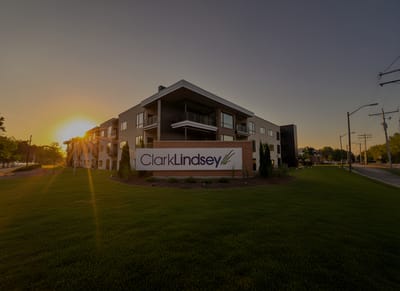
ClarkLindsey is located in Urbana, Illinois.
Here are the financial assistance programs available to residents in Illinois.
ClarkLindsey is in the West Windsor Road neighborhood of Urbana.
ClarkLindsey is legally operated by Clark-Lindsey Village, Inc.
ClarkLindsey has a walk score of 13. Car-dependent. Most errands require a car, with limited nearby walkable options.
According to IL state health department records, ClarkLindsey's license number is 5108441.
According to IL state health department records, ClarkLindsey's license expires on February 25, 2027.
ClarkLindsey's occupancy is 49.9%.
Yes, ClarkLindsey allows residents to bring their pets.
Care Cost Calculator: See Prices in Your Area
Nursing Home Data Explorer
Don’t Wait Too Long: 7 Red Flag Signs Your Parent Needs Assisted Living Now
The True Cost of Assisted Living in 2025 – And How Families Are Paying For It
Understanding Senior Living Costs: Pricing Models, Discounts & Financial Assistance


