Occupancy rate
61%

We arrange tours, appointments, and even moving support so you don’t have to
Thank you for your interest!
Our team will be in touch shortly to help with next steps.
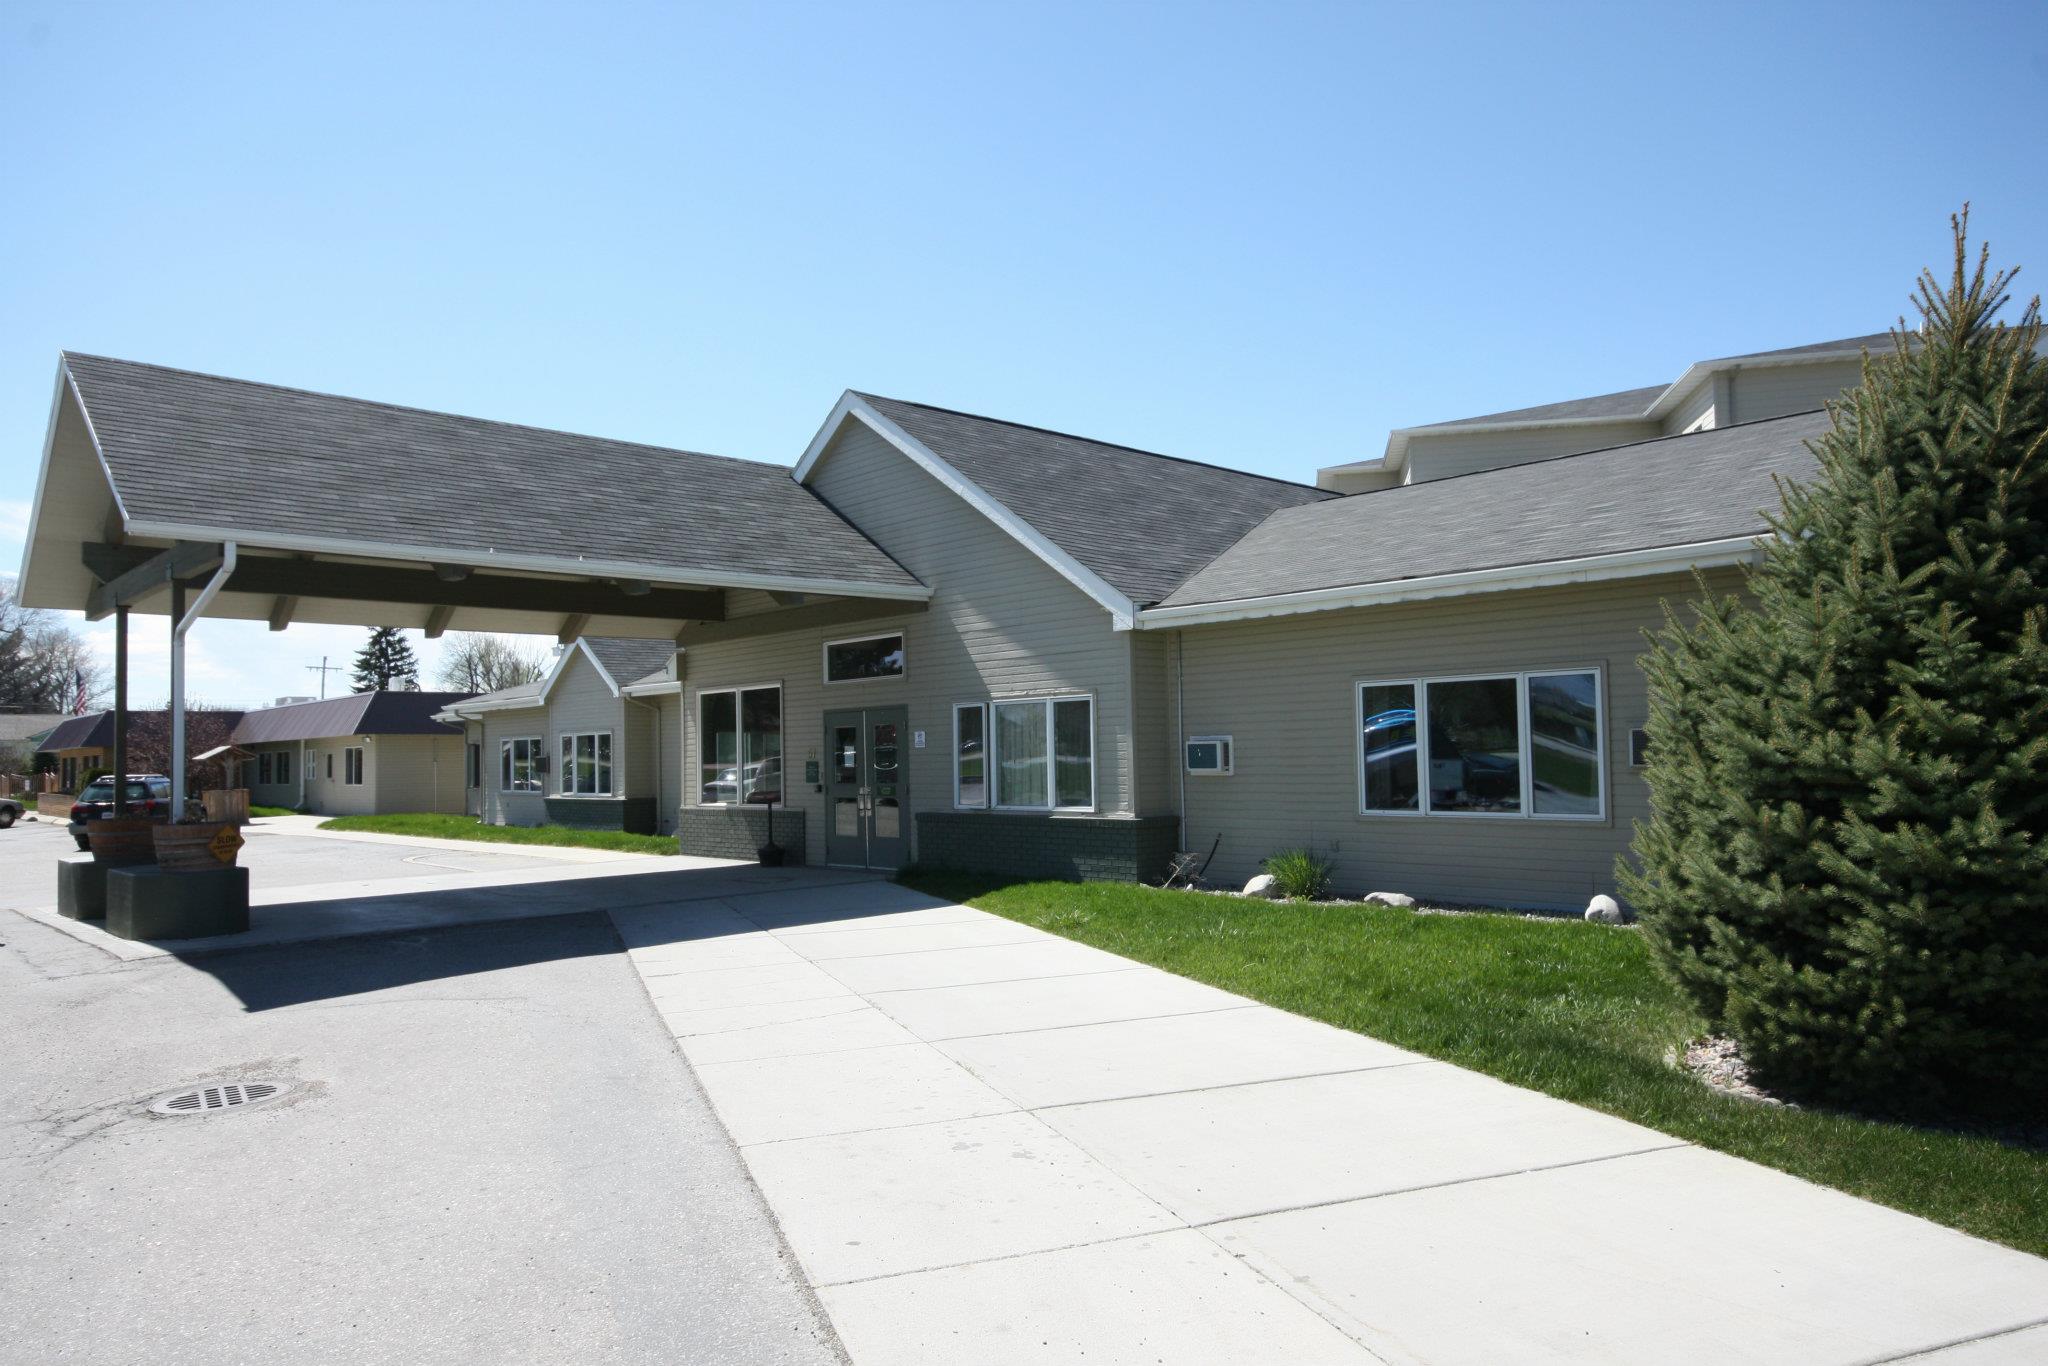
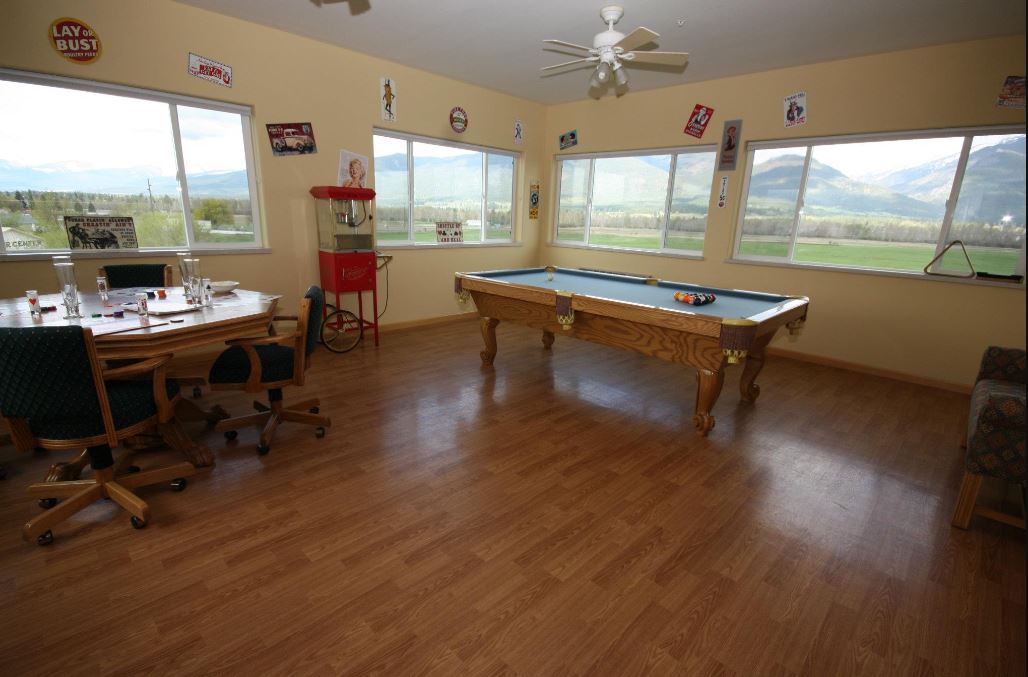
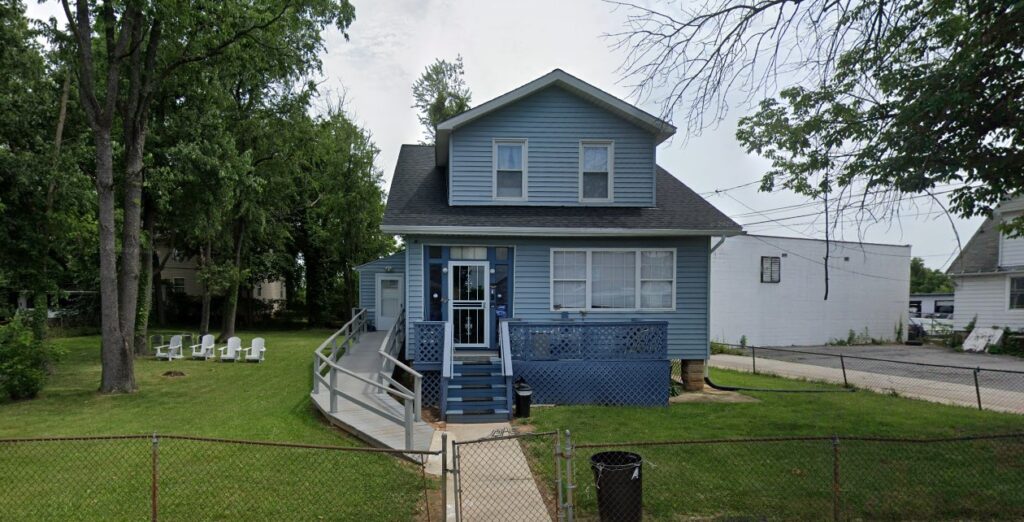
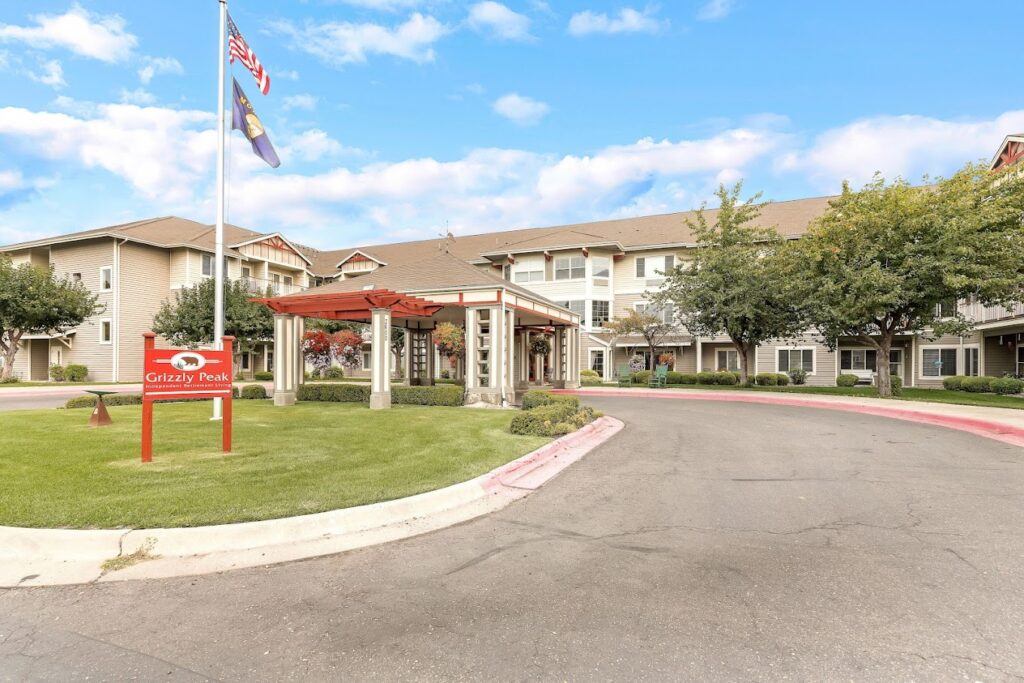
Located in the scenic town of Stevensville, Montana, The Living Centre is a unique and comprehensive senior living community that provides Retirement Living, Assisted Living, and Skilled Nursing services all in one convenient location. As the only facility of its kind in Northwest Montana, This community offers a range of care options to meet the evolving needs of residents. With a deep commitment to respecting the individual and valuing life, the community strives to create a warm and supportive environment.
At The Living Centre, personalized service is at the forefront. The community’s retirement apartments are thoughtfully designed and available in kitchenette and one-bedroom floor plans, providing residents with the comforts of home. Whether you choose to relax in your private space or enjoy the spectacular views from your room, every aspect of your stay is designed to enhance your pleasure. With a focus on individualized care, The Living Centre ensures that residents have access to the services they need, precisely when they need them. The community’s integrated approach to care and commitment to excellence make it a trusted choice for seniors in the Stevensville area.
May offer a more intimate, personalized care environment.
Lower occupancy suggests more openings may be available.
Most residents typically stay for a few weeks or months before returning home or moving on.
40% of new residents, usually for short-term rehab.
36% of new residents, often for short stays.
24% of new residents, often for long-term daily care.
The Living Centre is administrated by Becker, Leanne.
Key information about the people who lead and staff this community.
In Montana, the Department of Public Health and Human Services, Quality Assurance Division is the state body responsible for inspecting and licensing all senior residential care facilities.
Montana average 5.1
Last Health inspection on Jan 2025
Montana average 29.7
Montana average 5.72
Health citations are formal notices following inspections when they fail to comply with safety and care standards.
9 of 15 citations resulted from standard inspections; and 6 of 15 resulted from complaint investigations.
Montana average: 0.3
Montana average: 2.2
Data sourced from CMS Health Deficiencies reports. Citation severity codes range from A (least serious) to L (most serious). Immediate Jeopardy (J-L) citations indicate situations where the facility's noncompliance has placed residents at risk of death or serious harm.
Assisted Living A licensed, long-term care setting for seniors or individuals with disabilities who need help with daily activities — like bathing, dressing, and medication management — but not 24-hour skilled nursing. Offers housing, meals, and around-the-clock support while aiming to maximize resident independence.
Independent Living Lifestyle-focused communities for older adults offering dining, activities, and transportation with minimal personal care. Best for active, independent seniors who want community without medical support.
Nursing Home Licensed facility providing 24/7 skilled nursing care for residents with complex, ongoing medical needs. Staffed by RNs, LPNs, and CNAs. Inspected and star-rated annually by CMS. Accepts Medicare (short-term rehab) and Medicaid (long-term care).
Assisted Living A licensed, long-term care setting for seniors or individuals with disabilities who need help with daily activities — like bathing, dressing, and medication management — but not 24-hour skilled nursing. Offers housing, meals, and around-the-clock support while aiming to maximize resident independence.
Memory Care Secured, specialized care for people living with Alzheimer's or dementia. Staff trained in cognitive impairment, with higher staff-to-resident ratios and an environment designed to reduce confusion and wandering risk.
Independent Living Lifestyle-focused communities for older adults offering dining, activities, and transportation with minimal personal care. Best for active, independent seniors who want community without medical support.
Assisted Living A licensed, long-term care setting for seniors or individuals with disabilities who need help with daily activities — like bathing, dressing, and medication management — but not 24-hour skilled nursing. Offers housing, meals, and around-the-clock support while aiming to maximize resident independence.
Independent Living Lifestyle-focused communities for older adults offering dining, activities, and transportation with minimal personal care. Best for active, independent seniors who want community without medical support.
![]() 28.9 miles from city center — 1.42 miles to nearest hospital (Bitterroot Health - Stevensville)
28.9 miles from city center — 1.42 miles to nearest hospital (Bitterroot Health - Stevensville)
![]() 63 Main St, Stevensville, MT 59870
63 Main St, Stevensville, MT 59870
Add your location
This data corresponds to Q2 2025 and is based on CMS Payroll-Based Journal.
Montana average ratio: 1.77:1
Montana average: 8.6 hours
Manages medical care and health needs.
No contractors work on this role.
Assists with medical care and medications.
This role is partially covered by contractors.
Helps with daily care and mobility.
This role is partially covered by contractors.
Total hours from contractors
2,584 contractor hours this quarter
| Certified Nursing Assistant | 25 | 8 | 33 | 8,905 | 91 | 100% | 8.8 |
| Licensed Practical Nurse | 5 | 2 | 7 | 2,398 | 90 | 99% | 9.4 |
| Registered Nurse | 5 | 0 | 5 | 1,984 | 90 | 99% | 8.5 |
| Nurse Aide in Training | 7 | 0 | 7 | 1,462 | 76 | 84% | 9 |
| Nurse Practitioner | 1 | 0 | 1 | 647 | 70 | 77% | 9.2 |
| Other Dietary Services Staff | 1 | 0 | 1 | 561 | 72 | 79% | 7.8 |
| Medication Aide/Technician | 1 | 0 | 1 | 501 | 46 | 51% | 10.9 |
| Administrator | 1 | 0 | 1 | 488 | 61 | 67% | 8 |
| Respiratory Therapy Technician | 1 | 0 | 1 | 472 | 59 | 65% | 8 |
| Speech Language Pathologist | 1 | 0 | 1 | 433 | 57 | 63% | 7.6 |
| Dental Services Staff | 1 | 0 | 1 | 432 | 53 | 58% | 8.2 |
| Physical Therapist | 1 | 0 | 1 | 75 | 13 | 14% | 5.8 |
| Occupational Therapy Aide | 0 | 1 | 1 | 47 | 14 | 15% | 3.4 |
| Occupational Therapy Assistant | 0 | 1 | 1 | 41 | 14 | 15% | 2.9 |
| Qualified Social Worker | 0 | 1 | 1 | 6 | 3 | 3% | 2 |
| Medical Director | 0 | 1 | 1 | 2 | 1 | 1% | 2 |
Source: CMS Long-Term Care Facility Characteristics (Data as of Jan 2026)
Residents meet regularly to discuss policies, care quality, and activities
Organized group of residents that meets regularly to discuss facility policies, quality of life, and activities.
Data sourced from CMS Long-Term Care Facility Characteristics quarterly report. Payer mix reflects the current resident census by primary payment source.
These measures show how residents usually do over time at this home, based on health outcomes and preventive care.
Montana average: 11.2
Montana average: 21.8
Montana average: 19.4%
Montana average: 20.8%
Montana average: 25.2%
Montana average: 4.3%
Montana average: 6.3%
Montana average: 2.8%
Montana average: 6.1%
Montana average: 4.7%
Montana average: 19.1%
Montana average: 93.8%
Montana average: 93.7%
Montana average: 76.4%
Montana average: 1.8%
Montana average: 73.8%
Quality measures are calculated from Minimum Data Set (MDS) assessments. For most measures, lower percentages indicate better care quality.
Federal penalties imposed by CMS for regulatory violations, including civil money penalties (fines) and denials of payment for new Medicare/Medicaid admissions.
Source: CMS Penalties Database (Data as of Jan 2026)
Montana average: $87K
Montana average: 2.3
Montana average: 0.2
Penalties are imposed by CMS for violations of federal nursing home regulations.
Last updated: Jan 2026
Historical financial and operational data for The Living Centre based on CMS SNF Cost Reports.
Loading trend charts...
Care Cost Calculator: See Prices in Your Area
Nursing Home Data Explorer
Don’t Wait Too Long: 7 Red Flag Signs Your Parent Needs Assisted Living Now
The True Cost of Assisted Living in 2025 – And How Families Are Paying For It
Understanding Senior Living Costs: Pricing Models, Discounts & Financial Assistance

Touring a community? Use this expert-backed checklist to stay organized, ask the right questions, and find the perfect fit.
We'll send you a PDF version of the touring checklist.