Clark Fork Riverside
Nursing Home & Independent Living · Missoula, MT
CMS overall rating Info The Overall CMS Rating is scored from 1 to 5 stars and combines results from health inspections, staffing levels, and quality measures. Health inspections carry the most weight. Staffing and quality scores can increase or decrease the final rating based on performance compared to state and national standards.

Clark Fork Riverside

Nursing Home & Independent Living · Missoula, MT
CMS overall rating Info The Overall CMS Rating is scored from 1 to 5 stars and combines results from health inspections, staffing levels, and quality measures. Health inspections carry the most weight. Staffing and quality scores can increase or decrease the final rating based on performance compared to state and national standards.

Overview of Clark Fork Riverside

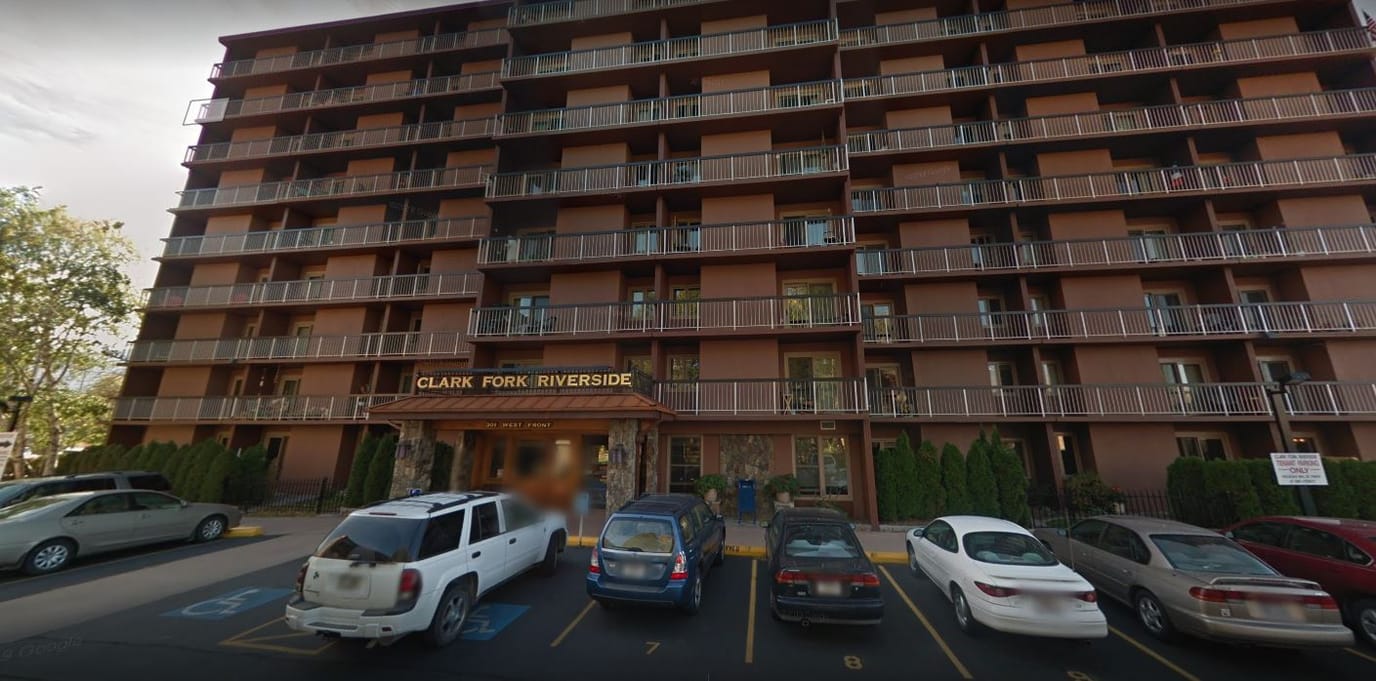
Clark Fork Riverside, nestled in the heart of Missoula, is more than just an independent living community. It’s a haven of possibilities for seniors seeking an active and vibrant lifestyle. From the moment they step through the doors, residents are immersed in a world of engaging and enriching independent living activities.
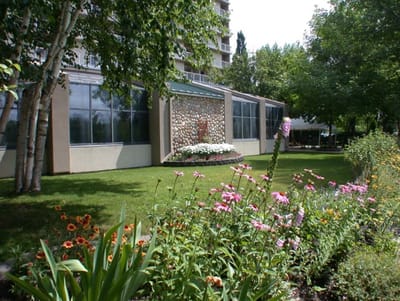
The community boasts an impressive array of amenities and services tailored to cater to the unique interests and preferences of its residents. They can delve into captivating novels in the well-stocked libraries or connect with friends and family in the state-of-the-art computer labs. Staying fit and energized is easy with access to invigorating fitness centers, where they can participate in group classes or enjoy personal workouts.

Residents are also encouraged to engage socially, with numerous opportunities to connect with fellow residents through shared interests, outings, and events. Whether it’s joining a book club, exploring the local arts scene, or indulging in culinary delights, they’ll find a vibrant and active community that celebrates the joys of independent living.

Quality ratings

Measured by Centers for Medicare & Medicaid Services (CMS)

Overall rating Info The Overall CMS Rating combines results from health inspections, staffing levels and quality measures. Health inspections carry the most weight. Staffing and quality scores can increase or decrease the final rating based on performance compared to state and national standards.
▲ 35.6% Above MT avg. ▲ 35.6% Above MT avg.Click the badge to see the full State ranking.Click here to see the full State ranking.
Health Inspection Info Based on the results of the facility's three most recent standard inspections and any complaint investigations. CMS reviews the number, scope, and severity of deficiencies, with more recent findings weighted more heavily.
▲ 5.4% Above MT avg. ▲ 5.4% Above MT avg.Click the badge to see the full State ranking.Click here to see the full State ranking.
Staffing Info Measures average nursing staff hours per resident per day, including Registered Nurses (RNs) and total nursing staff. Ratings are adjusted based on the level of care residents require and are compared to state and national benchmarks.
▲ 55.3% Above MT avg. ▲ 55.3% Above MT avg.Click the badge to see the full State ranking.Click here to see the full State ranking.
Quality Measures Info Based on clinical and physical health indicators reported to CMS, such as hospital readmissions, falls, pressure ulcers, and improvements in mobility. These measures reflect how well residents' health needs are being managed.
▲ 34.9% Above MT avg. ▲ 34.9% Above MT avg.Click the badge to see the full State ranking.Click here to see the full State ranking.

Staffing hours breakdown

Info Daily nursing hours per resident by staff type, reported to CMS. Higher is generally better — compare this facility to state and national averages to see where staffing stands.

Hours per resident per day — compared to Montana state averages

Total nursing care / resident Info This home is ranked 4th out of 34 homes in Montana. Total adjusted nursing hours per resident per day, combining RN, LPN, and aide time. CMS adjusts this for case-mix so facilities can be fairly compared.
5h 42m per day
Rank #4 / 34Nurse hours — State benchmarkedThis home is ranked 4th out of 34 homes in Montana. Shows adjusted nurse hours per resident per day benchmarked to the Montana average, with a ranking across 34 Montana SNFs. More hours mean more direct care. The national average is about 3.5 hrs; below 3.0 is a red flag.Click the rank badge to see the full State ranking.Click here to see the full State ranking.
This facility Montana avg (4h 32m per day)
vs Montana avg
+26%
Staff type Hours / Day / Resident vs state avg
Total Nursing (Weekend) Info Combined nursing hours (RN + LPN + Nurse Aide) per resident per day on weekends. Staffing often drops on weekends — this figure reveals whether the facility maintains adequate coverage outside of weekday hours. 3h 32m per day

Types of Care at Clark Fork Riverside

Independent Living
Walk Score
Walk Score: 93 / 100 Rank #1 / 38Walk Score — State benchmarkedThis home is ranked 1st out of 38 homes in Montana. Shows how walkable this facility's neighborhood is compared to the average Walk Score across Montana SNFs. Higher scores benefit residents, families, and staff.Click the rank badge to see the full State ranking.Click here to see the full State ranking.
Walker's paradise. Daily errands do not require a car, with many shops and services nearby.

About this community

Amenities & Lifestyle

Project-Based Section 8 Housing
Utilities Included In Rent
Recreational Activities
On-Site Management
Maintenance Services
Scenic River Views

Contact Clark Fork Riverside

Staffing Data

Reporting period: October 1 – December 31, 2025 (Q4 2025). Source: CMS Payroll-Based Journal report.

Total staff 30
Employees 29
Contractors 1
Staff to resident ratio 1.15:1
35% worse than Montana average
Montana average ratio: 1.77:1 Montana average ratio: 1.77:1See full Montana ranking
Avg staff/day 10
Average shift 10.2 hours
19% better than Montana average
Montana average: 8.6 hours Montana average shift: 8.6 hoursSee full Montana ranking
Total staff hours (quarter) 9,399

Nursing staff breakdown

Q4 2025 · Oct 1 – Dec 31 More info This data comes from the CMS Payroll-Based Journal report covering October 1 – December 31, 2025.
Registered Nurse

Manages medical care and health needs.

Total count 5
Average shift length Info Average shift length. Calculated as total hours divided by days worked and average staff per day. 10.1 hours

No contractors work on this role.

Licensed Practical Nurse

Assists with medical care and medications.

Total count 1
Average shift length Info Average shift length. Calculated as total hours divided by days worked and average staff per day. 9.1 hours

No contractors work on this role.

Certified Nursing Assistant

Helps with daily care and mobility.

Total count 19
Average shift length Info Average shift length. Calculated as total hours divided by days worked and average staff per day. 10.3 hours

No contractors work on this role.

Contractor staffing

Q4 2025 · Oct 1 – Dec 31 More info This data comes from the CMS Payroll-Based Journal report covering October 1 – December 31, 2025.

Total hours from contractors

3.9%

365 contractor hours this quarter

RN Director of Nursing: 1

Staff by category

Q4 2025 · Oct 1 – Dec 31 More info This data comes from the CMS Payroll-Based Journal report covering October 1 – December 31, 2025.
Certified Nursing Assistant 19 0 19 6,351 92 100% 10.3
Registered Nurse 5 0 5 1,894 92 100% 10.1
Nurse Practitioner 3 0 3 514 63 68% 8
RN Director of Nursing 0 1 1 365 39 42% 9.4
Licensed Practical Nurse 1 0 1 173 19 21% 9.1
Administrator 1 0 1 103 13 14% 7.9
19 Certified Nursing Assistant
% of Days 100%
5 Registered Nurse
% of Days 100%
3 Nurse Practitioner
% of Days 68%
1 RN Director of Nursing
% of Days 42%
1 Licensed Practical Nurse
% of Days 21%
1 Administrator
% of Days 14%

Penalties and fines

Federal penalties imposed by CMS for regulatory violations, including civil money penalties (fines) and denials of payment for new Medicare/Medicaid admissions.

Source: CMS Penalties Database

No penalties in the past 3 years

No civil money penalties or payment denials were reported in the last 3 years.

Quality of care over time

These measures show how residents usually do over time at this home, based on health outcomes and preventive care.

High-risk clinical events score Info A composite score based on pressure ulcers, falls with injury, weight loss, walking ability decline, and activities of daily living decline. 11.0
In line with Montana average

Montana average: 11.2

Functional decline score Info A composite score based on activities of daily living decline, walking ability decline, and incontinence. 23.0
5% worse than Montana average

Montana average: 21.8

Long-stay resident measures
Need for Help with Daily Activities Increased Info Percent of long-stay residents whose need for help with daily activities has increased 25.0%
29% worse than Montana average

Montana average: 19.4%

Walking Ability Worsened Info Percent of long-stay residents whose ability to move independently worsened 19.3%
7% better than Montana average

Montana average: 20.8%

Low Risk Residents with Bowel/Bladder Incontinence Info Percent of low risk long-stay residents who lose control of their bowels or bladder 24.6%
In line with Montana average

Montana average: 25.2%

Falls with Major Injury Info Percent of long-stay residents experiencing one or more falls with major injury 6.9%
58% worse than Montana average

Montana average: 4.3%

High Risk Residents with Pressure Ulcers Info Percent of long-stay high risk residents with pressure ulcers 0.0%
100% better than Montana average

Montana average: 6.3%

Urinary Tract Infection Info Percent of long-stay residents with a urinary tract infection 0.0%
100% better than Montana average

Montana average: 2.8%

Lost Too Much Weight Info Percent of long-stay residents who lose too much weight 3.9%
36% better than Montana average

Montana average: 6.1%

Depressive Symptoms Info Percent of long-stay residents who have depressive symptoms 3.1%
35% better than Montana average

Montana average: 4.7%

Antipsychotic Use Info Percent of long-stay residents who received an antipsychotic medication 7.8%
59% better than Montana average

Montana average: 19.1%

Pneumococcal Vaccine Info Percent of long-stay residents assessed and appropriately given the pneumococcal vaccine 100.0%
7% better than Montana average

Montana average: 93.8%

Influenza Vaccine Info Percent of long-stay residents assessed and appropriately given the seasonal influenza vaccine 85.2%
9% worse than Montana average

Montana average: 93.7%

Short-stay resident measures
Pneumococcal Vaccine Info Percent of short-stay residents assessed and appropriately given the pneumococcal vaccine 84.6%
11% better than Montana average

Montana average: 76.4%

Facility Characteristics

Source: CMS Long-Term Care Facility Characteristics (Data as of Jan 2026)

Total residents 26
Medicaid
18
69.2% of residents
Private pay or other
8
30.8% of residents
Programs & Services
Residents Group

Residents meet regularly to discuss policies, care quality, and activities

Active Resident Council

Organized group of residents that meets regularly to discuss facility policies, quality of life, and activities.

Places of interest near Clark Fork Riverside

Address 0.3 miles from city center Info Estimated distance in miles from Missoula's city center to Clark Fork Riverside's address, calculated via Google Maps. — 0.23 miles to nearest hospital (Fresenius Medical Care at St Patrick Hospital & Health Sc Cnt)

Calculate Travel Distance to Clark Fork Riverside

Add your location

Address

Financial Assistance for
Nursing Home in Montana

Clark Fork Riverside is located in Missoula, Montana.
Here are the financial assistance programs available to residents in Montana.

Get Financial aid guidance

Big Sky Waiver

Montana Medicaid Big Sky Waiver

Age 65+ or disabled
General Montana resident, Medicaid- eligible, nursing home-level care need.
Income Limits (2025) ~$2,829/month 300% FBR, individual
Asset Limits $2,000 (individual), $3,000 (couple).
MT

Rural state; limited providers in some areas.

Benefits
Personal care (5-7 hours/day) Respite (240 hours/year) Home modifications ($1,500 avg.) Meals ($6/meal)

Montana Community First Choice

MT CFC

Age 65+ or disabled
General Montana resident, Medicaid- eligible.
Income Limits ~$1,732/month individual, Medicaid threshold
Asset Limits $2,000 individual
MT

Less intensive than waiver; rural focus.

Benefits
Personal care (up to 40 hours/month) Homemaker services Respite (varies)

Big Sky Rx

Montana Big Sky Rx

Age 65+ or disabled
General Montana resident, enrolled in Medicare Part D, income below limit.
Income Limits (2025) ~$2,510/month (individual), ~$3,380/month (couple).
Asset Limits Not assessed.
MT

Covers up to $38.75/month premium; statewide via AAAs.

Benefits
Prescription drug premium assistance (~$465/year) Reducing out-of-pocket costs

Medicare Savings Program (MSP)

Montana Medicare Savings Program

Age 65+ or disabled
General Montana resident, Medicare Part A/B.
Income Limits (2025) ~$2,510/month (QMB), ~$3,380/month (SLMB), ~$3,598/month (QI)—individual.
Asset Limits $9,430 (individual), $14,130 (couple).
MT

Three tiers; no waitlist; includes Extra Help for Part D.

Benefits
Covers Part B premiums ($174.70/month) Deductibles ($240/year) Copays (~20%)

Montana Caregiver Support Program (via NFCSP)

Montana Caregiver Support Program

Age
General Caregivers of 60+ needing care or 55+ caregivers of others; Montana resident; functional needs (2+ ADLs).
Income Limits (2025) Prioritizes ~$24,980/year (individual); no strict cap.
Asset Limits Not assessed; need-based.
MT

10 AAAs; prioritizes low-income, rural caregivers.

Benefits
Respite (4-6 hours/week or 5 days/year) Adult day care ($50/day) Training Supplies (~$500/year)

VA Aid and Attendance (A&A) and Housebound Benefits

Montana VA Aid and Attendance/Housebound

Age 65+ or disabled veteran/spouse
General Montana resident, wartime service, need for ADL help (A&A) or homebound.
Income Limits (2025) Net income < ~$1,984/month (veteran with dependent, A&A); pension offsets income.
Asset Limits ~$155,356 net worth limit
MT

High veteran demand in rural areas.

Benefits
Cash (~$1,433-$2,642/month veteran, ~$951-$1,318 spouse) for care costs (e.g., in-home, assisted living)

Frequently Asked Questions about Clark Fork Riverside

What neighborhood is Clark Fork Riverside in?

Clark Fork Riverside is in the Heart of Missoula neighborhood.

Is Clark Fork Riverside in a walkable area?

Clark Fork Riverside has a walk score of 93. Walker's paradise. Daily errands do not require a car, with many shops and services nearby.

Are there photos of Clark Fork Riverside?

Yes — there are 2 photos of Clark Fork Riverside in the photo gallery on this page.

What is the phone number of Clark Fork Riverside?

(406) 721-2439 will put you in contact with the team at Clark Fork Riverside.

Is Clark Fork Riverside Medicare or Medicaid certified?

Yes — Clark Fork Riverside is a CMS-certified provider of Medicare and Medicaid.

Guides for Better Senior Living

Care Cost Calculator: See Prices in Your Area

Nursing Home Data Explorer

Don’t Wait Too Long: 7 Red Flag Signs Your Parent Needs Assisted Living Now

The True Cost of Assisted Living in 2025 – And How Families Are Paying For It

Understanding Senior Living Costs: Pricing Models, Discounts & Financial Assistance

Explore Open Rooms
1 Contact details
2 What type of senior care service are you looking for?
3 What budget do you have in mind for senior care?
4 How soon do you need to find care?
5 Additional details

Thank you for your interest!

Our team will be in touch shortly to help with next steps.