Explore Open Rooms

1 Contact details
2 What type of senior care service are you looking for?
3 What budget do you have in mind for senior care?
4 How soon do you need to find care?
5 Additional details

Thank you for your interest!

Our team will be in touch shortly to help with next steps.

Nursing Home

The Phoenix Rehabilitation And Nursing Center

Nursing Home

The Phoenix Rehabilitation And Nursing Center

140 St Edwards St, Brooklyn, NY 11201 View map
Overview of The Phoenix Rehabilitation and Nursing Center

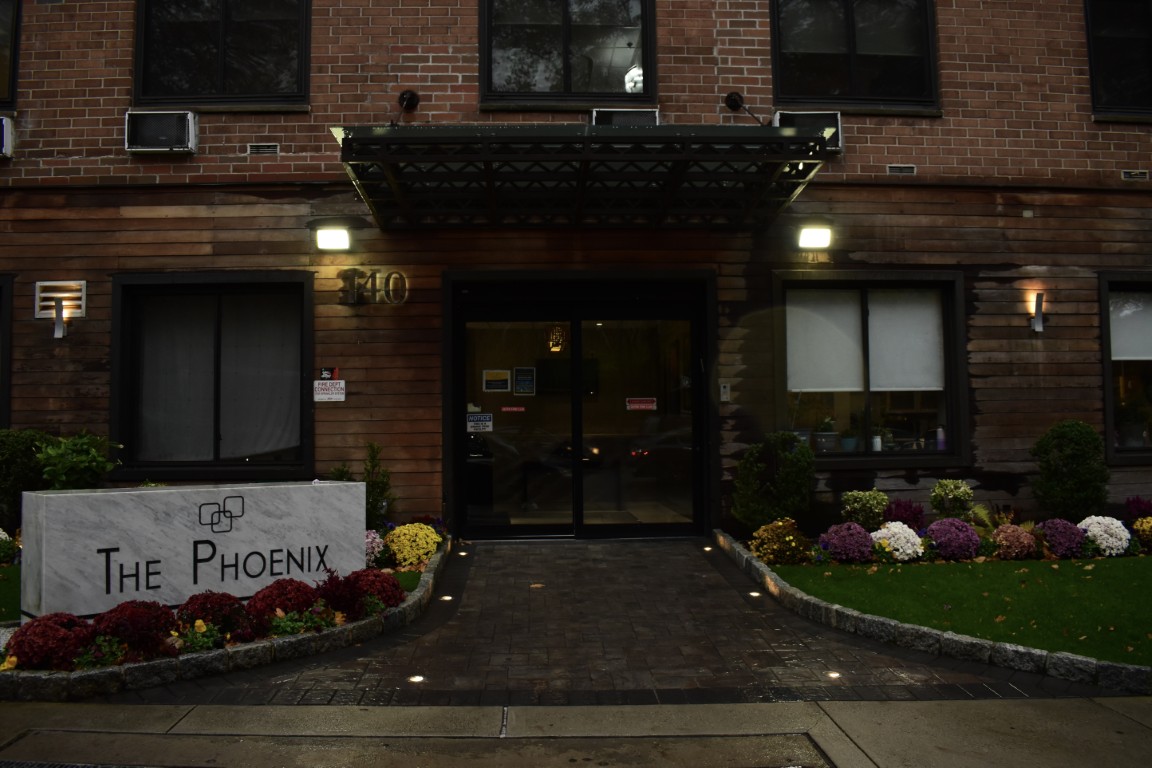
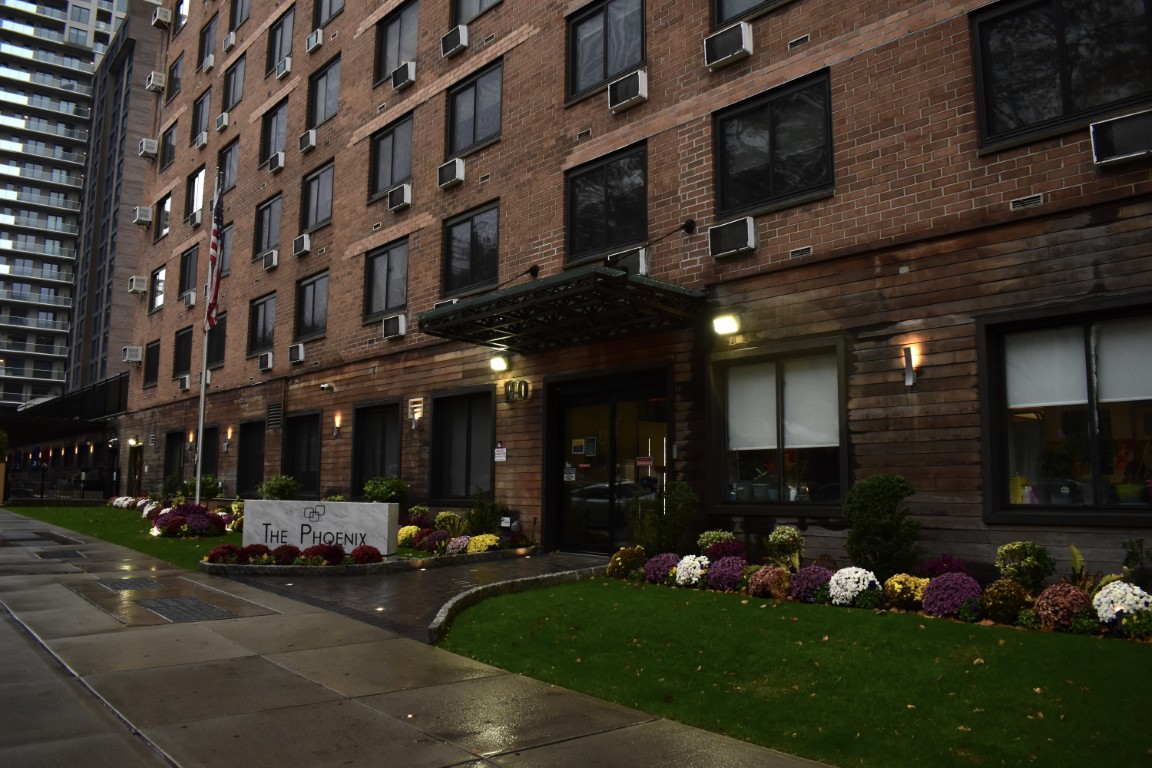
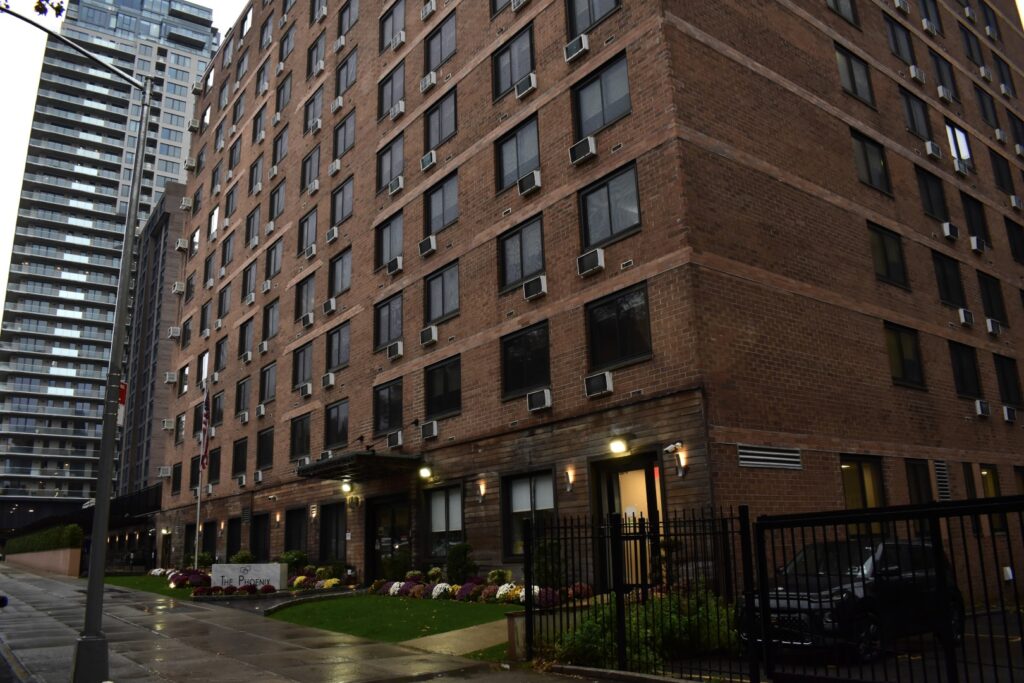
The Phoenix Rehabilitation and Nursing Center is a high-standard nursing home in Brooklyn, NY, that offers skilled nursing and specialized care. The community strives to provide a place for older adults to recover with ease, with its variety of private and semi-private suites and nurturing environment. 24/7 care, pain management, and recreational therapy are offered to meet older adults’ healthcare needs. With its continuum of care, the community ensures older adults are well-cared for.

Focusing on residents’ holistic well-being, programs encompassing physical, emotional, and spiritual aspects are conducted. An expansive rehabilitation gym, accompanied by picturesque views, ensures residents can jump back to their routines quickly. With its serene setting near Fort Greene Park and other local amenities, residents have easy access to their leisure and necessities. This nursing home is highly regarded in New York for its top-notch rehabilitation programs and extensive amenities, ensuring residents can live to their potential.

(718) 858-6400

Quality ratings

Measured by Centers for Medicare & Medicaid Services (CMS)

Overall rating Info The Overall CMS Rating combines results from health inspections, staffing levels and quality measures. Health inspections carry the most weight. Staffing and quality scores can increase or decrease the final rating based on performance compared to state and national standards.
5/5
New York average: 3.1/5
Health Inspection Info Based on the results of the facility's three most recent standard inspections and any complaint investigations. CMS reviews the number, scope, and severity of deficiencies, with more recent findings weighted more heavily.
4/5
New York average: 2.8/5
Staffing Info Measures average nursing staff hours per resident per day, including Registered Nurses (RNs) and total nursing staff. Ratings are adjusted based on the level of care residents require and are compared to state and national benchmarks.
2/5
New York average: 2.7/5
Quality Measures Info Based on clinical and physical health indicators reported to CMS, such as hospital readmissions, falls, pressure ulcers, and improvements in mobility. These measures reflect how well residents' health needs are being managed.
5/5
New York average: 3.8/5

Nursing care per resident

Info This shows how many total hours of nursing staff time are available per resident each day. Higher numbers usually mean more staff support.
2h 35m per day

This home provides 28% less nursing time per resident than the New York average.

New York average: 3h 35m per day

Staffing hours breakdown

Info Hours of care per resident per day, broken down by staff type. Data from CMS Medicare.
Staff type Facility State avg National avg
Registered Nurse (RN) Info Registered nurse hours per resident per day. 29m per day 42m per day 41m per day
Nurse Aide Info Nurse aide hours per resident per day. 1h 56m per day 2h 11m per day 2h 21m per day
Total Nursing (Weekend) Info Total number of nurse staff hours per resident per day on weekends. 2h 38m per day 3h 10m per day 3h 26m per day
Physical Therapist Info Physical therapist staff hours per resident per day. 5m per day 7m per day 4m per day
RN (Weekend) Info Registered nurse hours per resident per day on weekends. 18m per day 28m per day 29m per day

Capacity and availability

High-capacity home

May provide extensive amenities, services and programs.

Total beds 400

This home is often near full

That suggests steady demand, but availability may be limited.

Higher demand than most homes in New York
Occupancy rate 97.1%
Residents per day (avg) 392
Occupancy rate
97.1%
Residents per day (avg)
392

Who this home usually serves

TYPE OF STAY

Primarily short stays

Residents typically stay for brief periods, with frequent admissions and discharges throughout the year.

Might be optimal for
Post-acute recovery Temporary care Transitional stays

Breakdown by payment type

Medicare

23% of new residents, usually for short-term rehab.

Typical stay 2 - 3 months

Private pay

61% of new residents, often for short stays.

Typical stay 1 - 2 months

Medicaid

17% of new residents, often for long-term daily care.

Typical stay 1 - 2 years

Finances and operations

Privately-owned community
Operated by a business corporation.
Home revenue
$70.1M
Profit
$3.3M
Privately-owned community Operated by a business corporation.
Home revenue
$70,051,467.00
Profit
$3,263,278.00
Payroll costs Info The portion of the home's budget spent on staff, including nurses, caregivers, and other employees who support care and operations.
$16.7M
23.8% of revenue
Other operating costs Info All remaining costs needed to run the home, such as food, utilities, building maintenance, supplies and administrative expenses.
$50.1M
Total costs $66.8M
Walk Score
Walk Score: 96 / 100
Walker's paradise. Daily errands do not require a car, with many shops and services nearby.

About this community

Care Services

Nursing Services
Rehabilitation Services
Skilled Nursing
Licensed Nurses/CNAs
Short-Term Rehab

All Levels of Care

Subacute Care
Long Term Care

Programs & Activities

Specific Programs
Orthopedic Rehabilitation, Short Term Rehabilitation, Respiratory Care, Wound Care, Long Term Care, Amputee Care, Dialysis Services, Recreation, Urban Zen, Luxury Services, Concierge / Patient Experience, Dining, Events

What does this home offer?

Housing options icon

Housing Options: Private / Semi-Private Rooms

Building type icon
Building type icon

Building Type: High-rise

Dining services icon

Dining Services

Housekeeping icon
Housekeeping icon

Housekeeping Services

Rehabilitative support icon

Rehabilitative Support

On-site medical care and health services icon

On-site Medical Care and Health Services

Types of Care at The Phoenix Rehabilitation And Nursing Center

Nursing Home
Contact The Phoenix Rehabilitation And Nursing Center

Health Inspection History

Inspections
Total health inspections 3

New York average 3.6


Last Health inspection on Sep 2024

Total health citations 8

New York average 18.5

Citations per inspection
2.67

New York average 5.05


Health citations are formal notices following inspections when they fail to comply with safety and care standards.

7 of 8 citations resulted from standard inspections; and 1 of 8 came from combined inspections (standard and complaint).

Breakdown of citation severity (last 3 years)
Critical Health citations More info 0
100% better than New York average

New York average: 0.2


Serious Health citations More info 0
100% better than New York average

New York average: 0.2

0 critical citations More info New York average: 0.2

0 serious citations More info New York average: 0.2

8 moderate citations More info New York average: 17.4

0 minor citations More info New York average: 0.7
Citations history (last 3 years)
Infection Control moderate citation Info Issues related to preventing and controlling infections, including hygiene practices and safety protocols. Sep 23, 2024
Corrected

Nutrition moderate citation Info Issues related to food quality, meal service, and resident's nutritional needs. Sep 23, 2024
Corrected

Quality of Care moderate citation Info Issues related to how well residents receive appropriate treatment and support for their medical and daily care needs. Sep 23, 2024
Corrected

Nutrition moderate citation Info Issues related to food quality, meal service, and resident's nutritional needs. Aug 19, 2022
Corrected

Compare Nursing Homes around Brooklyn The information below is reported by the New York State Department of Health.

5 facilities compared · CMS & NY Dept. of Health data · Updated Apr 2026

The Phoenix Rehabilitation And Nursing Center
NH

Nursing Home Licensed facility providing 24/7 skilled nursing care for residents with complex, ongoing medical needs. Staffed by RNs, LPNs, and CNAs. Inspected and star-rated annually by CMS. Accepts Medicare (short-term rehab) and Medicaid (long-term care).

Brooklyn (Fort Greene)
400
97.1%
+10%
2.59
-4%
-28%
0
8
0
392
96
-
$68,6M
$16,7M
24.3%
335516
Private / Semi-Private Rooms
Bensonhurst Center for Rehabilitation & Healthcare
MC

Memory Care Secured, specialized care for people living with Alzheimer's or dementia. Staff trained in cognitive impairment, with higher staff-to-resident ratios and an environment designed to reduce confusion and wandering risk.

NH

Nursing Home Licensed facility providing 24/7 skilled nursing care for residents with complex, ongoing medical needs. Staffed by RNs, LPNs, and CNAs. Inspected and star-rated annually by CMS. Accepts Medicare (short-term rehab) and Medicaid (long-term care).

Brooklyn (Bensonhurst)
200
98.4%
+11%
2.54
+72%
-29%
0
16
0
201
98
Kfg Acquisitions Llc
$34,7M
$12,5M
36.2%
335558
Private / Semi-Private Rooms
Concord Center For Nursing And Rehabilitation
NH

Nursing Home Licensed facility providing 24/7 skilled nursing care for residents with complex, ongoing medical needs. Staffed by RNs, LPNs, and CNAs. Inspected and star-rated annually by CMS. Accepts Medicare (short-term rehab) and Medicaid (long-term care).

Brooklyn (Bedford-Stuyvesant)
140
96.5%
+9%
2.64
-29%
-26%
0
15
0
137
91
Gaddy, Craig
$24,4M
$6,3M
26%
335538
Private / Semi-Private Rooms
Brooklyn Gardens Nursing and Rehabilitation Center
HC

Home Care Professional care delivered in the person's own home — from companionship and errands to skilled nursing and therapy. Allows seniors to age in place. Medicare covers skilled home health when medically necessary.

NH

Nursing Home Licensed facility providing 24/7 skilled nursing care for residents with complex, ongoing medical needs. Staffed by RNs, LPNs, and CNAs. Inspected and star-rated annually by CMS. Accepts Medicare (short-term rehab) and Medicaid (long-term care).

Brooklyn (Bedford-Stuyvesant)
240
94.0%
+6%
3.24
-23%
-9%
0
20
0
226
90
Schuck, Robert
$28,2M
$11,2M
39.8%
335070
Private / Semi-Private Rooms
Atrium Center for Rehabilitation & Nursing
NH

Nursing Home Licensed facility providing 24/7 skilled nursing care for residents with complex, ongoing medical needs. Staffed by RNs, LPNs, and CNAs. Inspected and star-rated annually by CMS. Accepts Medicare (short-term rehab) and Medicaid (long-term care).

Brooklyn (Canarsie)
380
98.2%
+11%
2.89
-59%
-19%
0
17
0
369
63
Zidele, Yehuda
$81,2M
$18,2M
22.3%
335720
Private / Semi-Private Rooms

Places of interest near The Phoenix Rehabilitation And Nursing Center

Address 2.5 miles from city center

Address 140 St Edwards St, Brooklyn, NY 11201

Calculate Travel Distance to The Phoenix Rehabilitation And Nursing Center

Add your location

Address

Staffing Data (Q2 2025)

This data corresponds to Q2 2025 and is based on CMS Payroll-Based Journal.

Total staff 411
Employees 328
Contractors 83
Staff to resident ratio 1.05:1
497% better than New York average

New York average ratio: 0.18:1

Avg staff/day 202
Average shift 7.2 hours
6% worse than New York average

New York average: 7.7 hours

Total staff hours (quarter) 132,552
Nursing staff breakdown
Registered Nurse

Manages medical care and health needs.

Total count 49
Average shift length Info Average shift length. Calculated as total hours divided by days worked and average staff per day. 7.8 hours

This role is partially covered by contractors.

Licensed Practical Nurse

Assists with medical care and medications.

Total count 59
Average shift length Info Average shift length. Calculated as total hours divided by days worked and average staff per day. 6.8 hours

This role is partially covered by contractors.

Certified Nursing Assistant

Helps with daily care and mobility.

Total count 202
Average shift length Info Average shift length. Calculated as total hours divided by days worked and average staff per day. 7 hours

This role is partially covered by contractors.

Contractor staffing

Total hours from contractors

20.2%

26,720 contractor hours this quarter

Speech Language Pathologist: 14 Physical Therapy Aide: 12 Other Dietary Services Staff: 12 Respiratory Therapy Technician: 11 Physical Therapy Assistant: 11 Registered Nurse: 9 Qualified Social Worker: 6 Licensed Practical Nurse: 6 Certified Nursing Assistant: 1 Qualified Activities Professional: 1
Staff by category
Certified Nursing Assistant201120269,28191100%7
Licensed Practical Nurse5365916,31191100%6.8
Registered Nurse4094913,51891100%7.8
Speech Language Pathologist014145,16491100%7.8
Occupational Therapy Aide120124,1059099%7.6
Physical Therapy Aide012124,0468998%8.2
Other Dietary Services Staff112133,94791100%6.9
Physical Therapy Assistant011113,8968290%7.7
Respiratory Therapy Technician011113,2569099%7.1
Clinical Nurse Specialist100102,8658695%7.2
Dental Services Staff4041,7417684%7.4
Qualified Social Worker0661,4727279%7.2
Mental Health Service Worker2029287077%8
Administrator1015046369%8
Dietitian1014645864%8
Nurse Practitioner1014485763%7.9
Qualified Activities Professional1124245560%6.9
Other Social Services Staff1011832629%7
202 Certified Nursing Assistant
% of Days 100%
59 Licensed Practical Nurse
% of Days 100%
49 Registered Nurse
% of Days 100%
14 Speech Language Pathologist
% of Days 100%
12 Occupational Therapy Aide
% of Days 99%
12 Physical Therapy Aide
% of Days 98%
13 Other Dietary Services Staff
% of Days 100%
11 Physical Therapy Assistant
% of Days 90%
11 Respiratory Therapy Technician
% of Days 99%
10 Clinical Nurse Specialist
% of Days 95%
4 Dental Services Staff
% of Days 84%
6 Qualified Social Worker
% of Days 79%
2 Mental Health Service Worker
% of Days 77%
1 Administrator
% of Days 69%
1 Dietitian
% of Days 64%
1 Nurse Practitioner
% of Days 63%
2 Qualified Activities Professional
% of Days 60%
1 Other Social Services Staff
% of Days 29%

Facility Characteristics

Source: CMS Long-Term Care Facility Characteristics (Data as of Jan 2026)

Total census
393 residents
Residents by payment source
Medicare
62 residents (15.8%)
Medicaid
289 residents (73.5%)
Private pay or other
42 residents (10.7%)
Programs & Services
Residents' Group

Residents meet regularly to discuss policies, care quality, and activities

Active Resident Council

Organized group of residents that meets regularly to discuss facility policies, quality of life, and activities.

Quality of care over time

These measures show how residents usually do over time at this home, based on health outcomes and preventive care.

High-risk clinical events score Info A composite score based on pressure ulcers, falls with injury, weight loss, walking ability decline, and activities of daily living decline. 12.1
23% worse than New York average

New York average: 9.8

Functional decline score Info A composite score based on activities of daily living decline, walking ability decline, and incontinence. 27.0
49% worse than New York average

New York average: 18.1

Long-stay resident measures
Significantly above average New York avg: 4.3 Info CMS star rating based on long-stay quality measure performance. 5 stars = significantly above average, 1 star = significantly below average.
Need for Help with Daily Activities Increased Info Percent of long-stay residents whose need for help with daily activities has increased 21.6%
31% worse than New York average

New York average: 16.4%

Walking Ability Worsened Info Percent of long-stay residents whose ability to move independently worsened 29.9%
80% worse than New York average

New York average: 16.6%

Low Risk Residents with Bowel/Bladder Incontinence Info Percent of low risk long-stay residents who lose control of their bowels or bladder 29.6%
38% worse than New York average

New York average: 21.4%

Falls with Major Injury Info Percent of long-stay residents experiencing one or more falls with major injury 1.0%
68% better than New York average

New York average: 3.0%

High Risk Residents with Pressure Ulcers Info Percent of long-stay high risk residents with pressure ulcers 5.7%
20% better than New York average

New York average: 7.2%

Urinary Tract Infection Info Percent of long-stay residents with a urinary tract infection 0.2%
83% better than New York average

New York average: 1.4%

Lost Too Much Weight Info Percent of long-stay residents who lose too much weight 2.3%
62% better than New York average

New York average: 6.1%

Depressive Symptoms Info Percent of long-stay residents who have depressive symptoms 13.9%
23% better than New York average

New York average: 18.1%

Antipsychotic Use Info Percent of long-stay residents who received an antipsychotic medication 2.3%
82% better than New York average

New York average: 12.6%

Pneumococcal Vaccine Info Percent of long-stay residents assessed and appropriately given the pneumococcal vaccine 85.2%
7% worse than New York average

New York average: 91.4%

Influenza Vaccine Info Percent of long-stay residents assessed and appropriately given the seasonal influenza vaccine 84.7%
11% worse than New York average

New York average: 95.2%

Hospitalizations per 1,000 days Info Number of hospitalizations per 1,000 long-stay resident days. 1.37
20% better than New York average

New York average: 1.71

ED visits per 1,000 days Info Number of outpatient emergency department visits per 1,000 long-stay resident days. 0.55
59% better than New York average

New York average: 1.35

Short-stay resident measures
Significantly above average New York avg: 3.7 Info CMS star rating based on short-stay quality measure performance. 5 stars = much above average, 1 star = much below average.
Pneumococcal Vaccine Info Percent of short-stay residents assessed and appropriately given the pneumococcal vaccine 67.0%
13% worse than New York average

New York average: 76.6%

Antipsychotic medication increase Info Percent of short-stay residents who newly received an antipsychotic medication 0.5%
63% better than New York average

New York average: 1.3%

Influenza Vaccine Info Percent of short-stay residents assessed and appropriately given the seasonal influenza vaccine 67.5%
14% worse than New York average

New York average: 78.8%

Re-hospitalized after SNF stay Info Percentage of short-stay residents who were re-hospitalized after their nursing home admission. 16.2%
21% better than New York average

New York average: 20.6%

Emergency department visits Info Percentage of short-stay residents who had an outpatient emergency department visit. 6.8%
30% better than New York average

New York average: 9.7%

Falls with major injury Info Percentage of SNF residents who experience falls with major injury during their stay. 0.5%
32% better than New York average

New York average: 0.8%

Ability to care for self at discharge Info Percentage of residents at or above expected ability to care for themselves at discharge. 47.7%
11% worse than New York average

New York average: 53.7%

Successful return to home or community Info Rate of successful return to home or community from a skilled nursing facility. 59.8%
18% better than New York average

New York average: 50.6%

Guides for Better Senior Living

Care Cost Calculator: See Prices in Your Area

Nursing Home Data Explorer

Don’t Wait Too Long: 7 Red Flag Signs Your Parent Needs Assisted Living Now

The True Cost of Assisted Living in 2025 – And How Families Are Paying For It

Understanding Senior Living Costs: Pricing Models, Discounts & Financial Assistance

Financial Aid for New York Seniors

Get financial aid guidance

Community First Choice Option

NY Medicaid CFCO

Age 65+ or disabled, New York resident, Medicaid- eligible, care need (not necessarily nursing home level).

~$2,829/month (300% FBR, individual).

$30,182 (individual, higher due to NY Medicaid expansion).

Higher asset limit; urban density increases demand.

Expanded In-Home Services for the Elderly Program (EISEP)

NY EISEP

Age 60+, New York resident, at risk of decline but not nursing home level.

~$2,500/month (individual, varies).

$15,000 (individual).

Cost-sharing required above certain income; urban/rural balance.

Senior Citizen Rent Increase Exemption (SCRIE)

NY SCRIE

Age 62+, NYC resident, live in rent-controlled/stabilized apartment, spend >1/3 of income on rent.

$50,000/year (household).

No strict asset cap, but income-focused eligibility.

Limited to NYC’s rent-regulated units; high demand in urban areas.

Senior Citizen Homeowners’ Exemption (SCHE)

NY SCHE

Age 65+, NYC resident, own and live in a 1-3 family home, co-op, or condo.

$58,399/year (household).

No strict asset cap, income-driven eligibility.

Applies only in NYC; excludes large apartment buildings.

New York Foundation for Senior Citizens (NYFSC) Home Sharing Program

NYFSC Home Sharing

One participant must be 60+ (host or guest), NYC resident, able to share living space.

No strict limit, but targets those needing cost relief.

Not applicable; focus on housing need.

Primarily NYC-focused; limited slots due to demand.