Explore Open Rooms

1 Contact details
2 What type of senior care service are you looking for?
3 What budget do you have in mind for senior care?
4 How soon do you need to find care?
5 Additional details

Thank you for your interest!

Our team will be in touch shortly to help with next steps.

Independent Living Home

The Remington at Valley Ranch

Independent Living Home

The Remington at Valley Ranch

8707 Valley Ranch Pkwy W, Irving, TX 75063 View map
Overview of The Remington at Valley Ranch

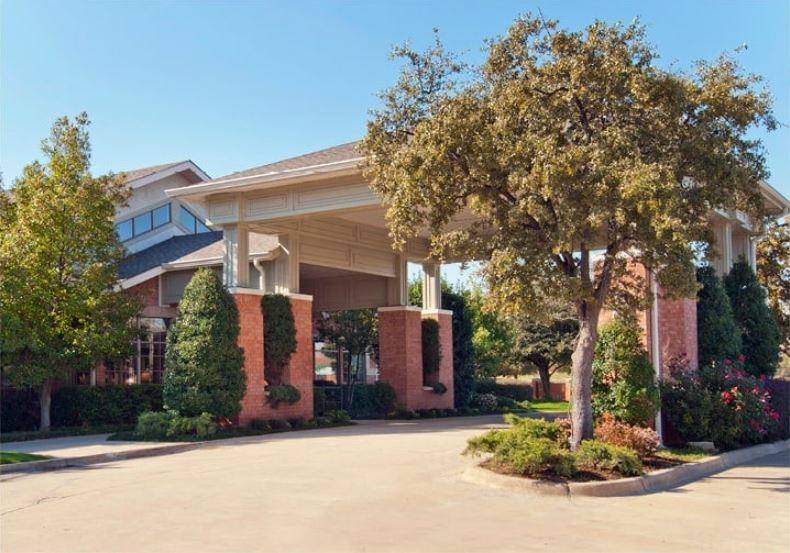
Nestled in the serene neighborhood of Irving, TX, the Remington at Valley Ranch is an enticing senior living community providing independent living and temporary stay services. Well-appointed and comfortable pet-friendly accommodations with several floor plans from one-bedroom to two-bedroom are available for its residents. The community secures round-the-clock care and assistance for its residents through its competent and compassionate team.

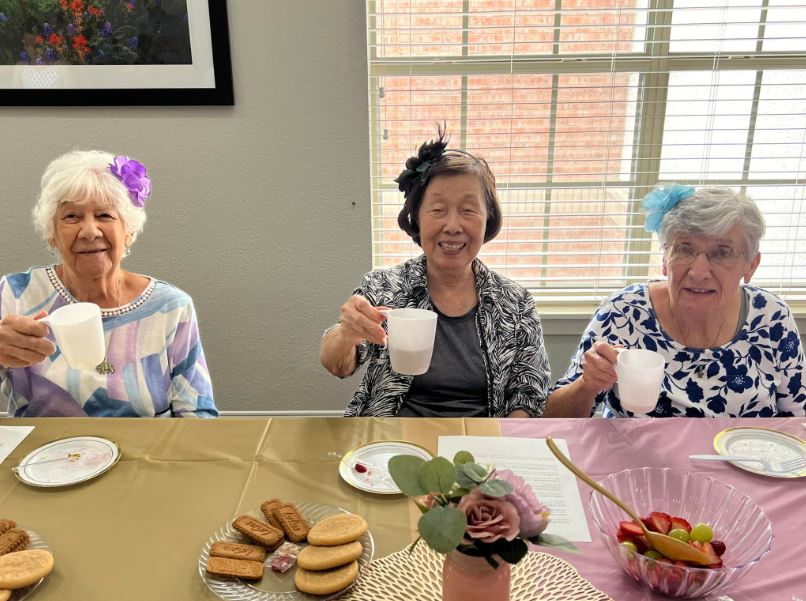
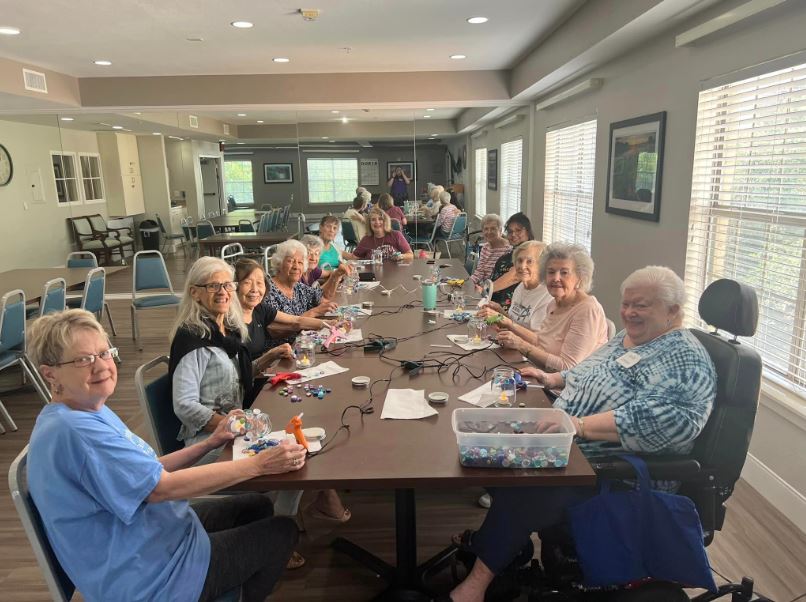
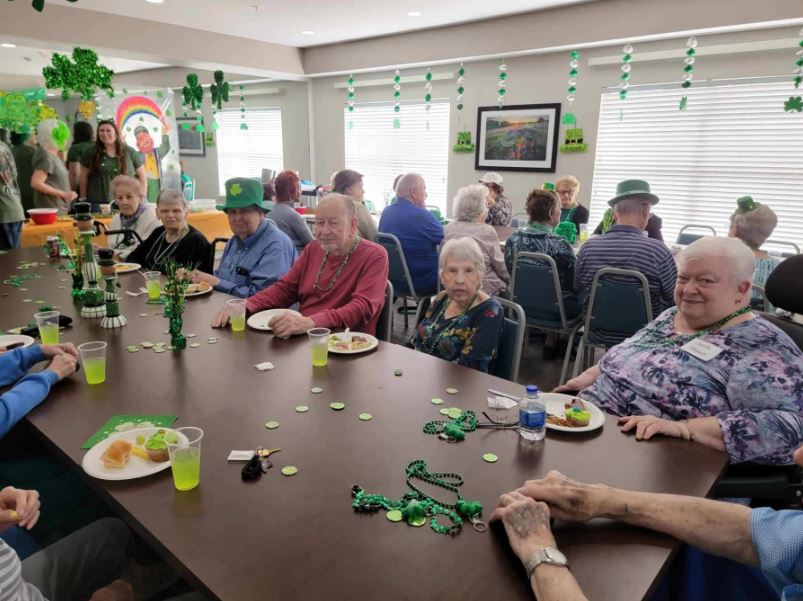
With top-tier amenities and services, residents can enjoy delightful and nutritious meals in restaurant-style dining, housekeeping services, and transportation services to nearby locations. Participate in a full calendar of activities to boost life-enrichment and social engagement. Create lasting connections upon meeting new companions through its community events. With the Remington at Valley Ranch, seniors are assured of a living experience worth remembering.

(972) 409-7770

Quality ratings

Measured by Centers for Medicare & Medicaid Services (CMS)

Overall rating Info The Overall CMS Rating combines results from health inspections, staffing levels and quality measures. Health inspections carry the most weight. Staffing and quality scores can increase or decrease the final rating based on performance compared to state and national standards.
4/5
Texas average: 3.0/5
Health Inspection Info Based on the results of the facility's three most recent standard inspections and any complaint investigations. CMS reviews the number, scope, and severity of deficiencies, with more recent findings weighted more heavily.
4/5
Texas average: 2.9/5
Staffing Info Measures average nursing staff hours per resident per day, including Registered Nurses (RNs) and total nursing staff. Ratings are adjusted based on the level of care residents require and are compared to state and national benchmarks.
2/5
Texas average: 2.4/5
Quality Measures Info Based on clinical and physical health indicators reported to CMS, such as hospital readmissions, falls, pressure ulcers, and improvements in mobility. These measures reflect how well residents' health needs are being managed.
4/5
Texas average: 4.0/5

Nursing care per resident

Info This shows how many total hours of nursing staff time are available per resident each day. Higher numbers usually mean more staff support.
3h 55m per day

This home provides 4% more nursing time per resident than the Texas average.

Texas average: 3h 46m per day

Capacity and availability

This home usually has limited availability

Occupancy is moderate, suggesting balanced demand.

Similar demand to the Texas average
Occupancy rate 88.2%
Residents per day (avg) 108
Occupancy rate
88.2%
Residents per day (avg)
108

Who this home usually serves

TYPE OF STAY

Primarily short stays

Residents typically stay for brief periods, with frequent admissions and discharges throughout the year.

Might be optimal for
Post-acute recovery Temporary care Transitional stays

Breakdown by payment type

Medicare

23% of new residents, usually for short-term rehab.

Typical stay 28 days

Private pay

63% of new residents, often for short stays.

Typical stay 26 days

Medicaid

14% of new residents, often for long-term daily care.

Typical stay 5 - 6 months

Finances and operations

Governmental community
Operated by state authorities.
Home revenue
$16.8M
Surplus of revenue
$1.4M
Governmental community Operated by state authorities.
Home revenue
$16,794,871.00
Surplus of revenue
$1,390,721.00
Payroll costs Info The portion of the home's budget spent on staff, including nurses, caregivers, and other employees who support care and operations.
$4.8M
28.5% of revenue
Other operating costs Info All remaining costs needed to run the home, such as food, utilities, building maintenance, supplies and administrative expenses.
$10.6M
Total costs $15.4M
Walk Score
Walk Score: 54 / 100
Moderately walkable. Some errands can be accomplished on foot, with a mix of nearby amenities.

About this community

License details

Facility type
Type A
Status Not Licensed
County: DALLAS

Additional licensing details

CMS Certification Number: 676476

Ownership & operating entity

The Remington at Valley Ranch is legally operated by UNKNOWN OWNER.

Care Services

Alzheimer's Certification

What does this home offer?

Pets allowed icon
Pets allowed icon

Pets Allowed: Yes, Pets Allowed

Room sizes icon
Room sizes icon

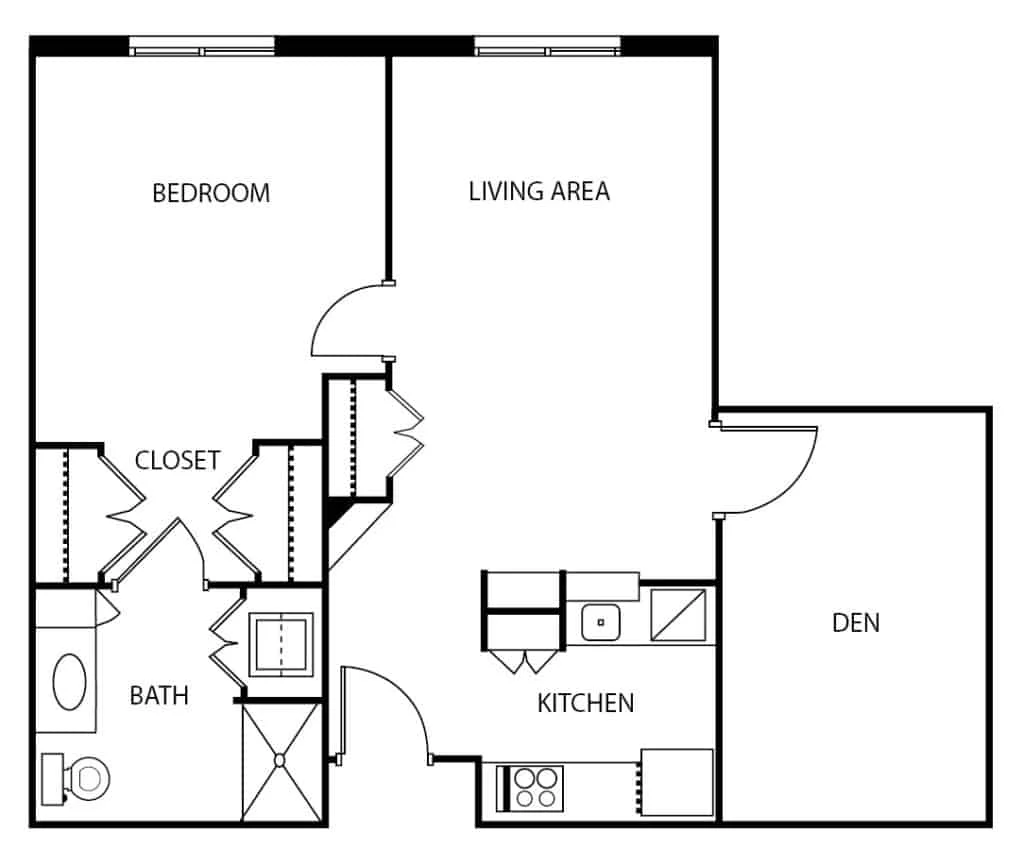
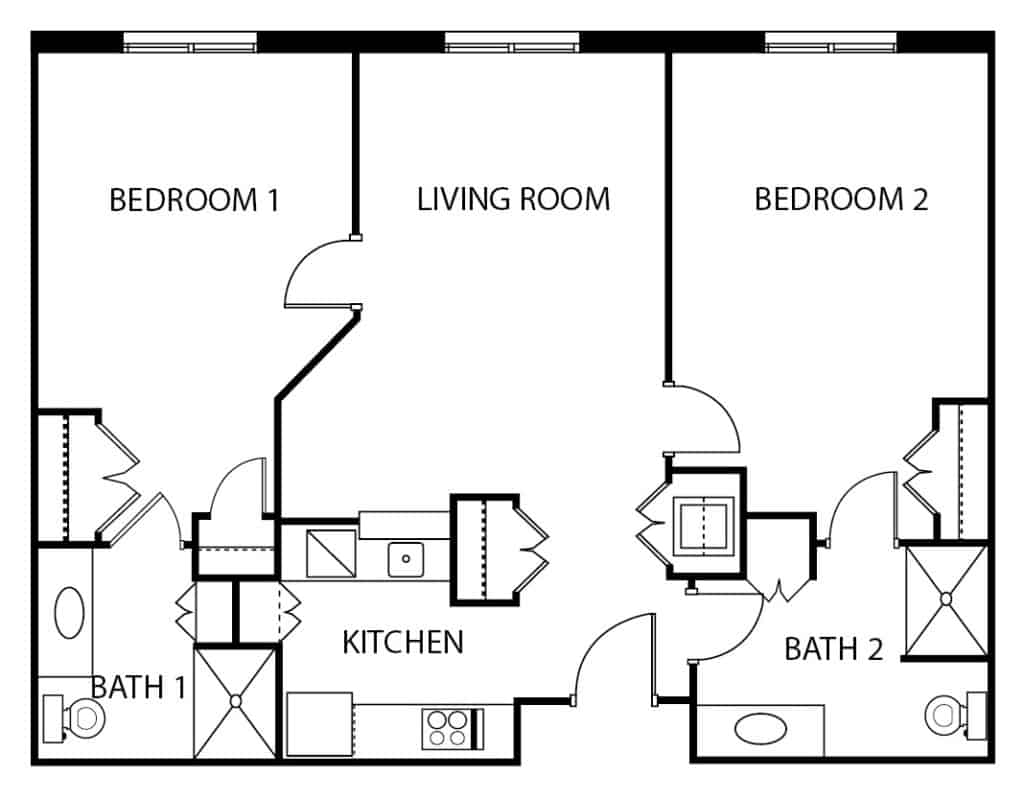
Room Sizes: 544 - 840 / 1040 sq. ft.

Housing options icon

Housing Options: 1 Bed / 2 Bed

Building type icon
Building type icon

Building Type: Single-story

Transportation services icon

Transportation Services

Fitness and recreation icon

Fitness and Recreation

Types of Care at The Remington at Valley Ranch

Independent Living Respite Care

Inspection History

In Texas, the Health and Human Services Commission (HHSC) is the primary regulatory body that conducts unannounced inspections and publishes quality reports for all long-term care homes.

0 enforcement actions

Penalties or interventions imposed by state regulators when facilities do not comply with quality, safety or regulatory standards.

Texas average: 1 enforcement action

Health Inspection History

Inspections
Total health inspections 4

Texas average 7.4


Last Health inspection on Oct 2024

Total health citations 15

Texas average 25.9

Citations per inspection
3.75

Texas average 3.67


Health citations are formal notices following inspections when they fail to comply with safety and care standards.

9 of 15 citations resulted from standard inspections; 1 of 15 resulted from complaint investigations; and 5 of 15 came from combined inspections (standard and complaint).

Breakdown of citation severity (last 3 years)
Critical Health citations More info 0
100% better than Texas average

Texas average: 2


Serious Health citations More info 0
100% better than Texas average

Texas average: 0.4

0 critical citations More info Texas average: 2

0 serious citations More info Texas average: 0.4

15 moderate citations More info Texas average: 23

0 minor citations More info Texas average: 0.4
Citations history (last 3 years)
Resident Rights moderate citation Info Issues related to resident's rights, including dignity, privacy, and the ability to make decisions about their care. Oct 11, 2024
Corrected

Quality of Care moderate citation Info Issues related to how well residents receive appropriate treatment and support for their medical and daily care needs. Mar 21, 2024
Corrected

Quality of Care moderate citation Info Issues related to how well residents receive appropriate treatment and support for their medical and daily care needs. Mar 21, 2024
Corrected

Quality of Care moderate citation Info Issues related to how well residents receive appropriate treatment and support for their medical and daily care needs. Mar 21, 2024
Corrected

Compare Independent Living around Dallas The information below is reported by the Texas Health and Human Services Commission.

The Remington at Valley Ranch
NH

Nursing Home Licensed facility providing 24/7 skilled nursing care for residents with complex, ongoing medical needs. Staffed by RNs, LPNs, and CNAs. Inspected and star-rated annually by CMS. Accepts Medicare (short-term rehab) and Medicaid (long-term care).

IL

Independent Living Lifestyle-focused communities for older adults offering dining, activities, and transportation with minimal personal care. Best for active, independent seniors who want community without medical support.

RC

Respite Care Short-term temporary care — days to weeks — to give family caregivers a break. Full care provided during the stay. Often used after hospitalization or to trial a facility before a permanent placement decision.

Irving (Valley Ranch)
122
-
54
-
UNKNOWN OWNER
-
-
-
1 Bed / 2 Bed
Protected: Five Star Premier Residences of Dallas
IL

Independent Living Lifestyle-focused communities for older adults offering dining, activities, and transportation with minimal personal care. Best for active, independent seniors who want community without medical support.

Dallas (Vickery Meadow)
-
-
63
-
-
-
-
-
1 Bed / 2 Bed

Living Spaces & Floor Plans

The Remington At Valley Ranch P2
The Remington At Valley Ranch P3
The Remington At Valley Ranch P1

Places of interest near The Remington at Valley Ranch

Address 18.0 miles from city center

Address 8707 Valley Ranch Pkwy W, Irving, TX 75063

Calculate Travel Distance to The Remington at Valley Ranch

Add your location

Address

Staffing Data (Q2 2025)

This data corresponds to Q2 2025 and is based on CMS Payroll-Based Journal.

Total staff 131
Employees 109
Contractors 22
Staff to resident ratio 1.25:1
17% worse than Texas average

Texas average ratio: 1.51:1

Avg staff/day 59
Average shift 7.8 hours
0% compared with Texas average

Texas average: 8.1 hours

Total staff hours (quarter) 41,767
Nursing staff breakdown
Registered Nurse

Manages medical care and health needs.

Total count 5
Average shift length Info Average shift length. Calculated as total hours divided by days worked and average staff per day. 9.7 hours

No contractors work on this role.

Licensed Practical Nurse

Assists with medical care and medications.

Total count 25
Average shift length Info Average shift length. Calculated as total hours divided by days worked and average staff per day. 9.3 hours

No contractors work on this role.

Certified Nursing Assistant

Helps with daily care and mobility.

Total count 63
Average shift length Info Average shift length. Calculated as total hours divided by days worked and average staff per day. 7.1 hours

This role is partially covered by contractors.

Contractor staffing

Total hours from contractors

13.5%

5,639 contractor hours this quarter

Physical Therapy Aide: 6 Respiratory Therapy Technician: 4 Physical Therapy Assistant: 4 Speech Language Pathologist: 3 Certified Nursing Assistant: 2 Qualified Social Worker: 2 Occupational Therapy Assistant: 1
Staff by category
Certified Nursing Assistant6126318,98891100%7.1
Licensed Practical Nurse250259,06791100%9.3
Medication Aide/Technician8083,94391100%8.7
Physical Therapy Aide0661,6908088%7.6
RN Director of Nursing3031,5127886%7.7
Speech Language Pathologist0331,3067987%6.6
Respiratory Therapy Technician0448797886%7.5
Qualified Social Worker0226967380%9.3
Registered Nurse5056135257%9.7
Clinical Nurse Specialist3035756470%7.7
Mental Health Service Worker1015186369%8.2
Nurse Practitioner1015156470%8
Administrator1014966167%8.1
Dietitian1014845965%8.2
Physical Therapy Assistant0444697077%5.5
Occupational Therapy Assistant0111933%6.3
63 Certified Nursing Assistant
% of Days 100%
25 Licensed Practical Nurse
% of Days 100%
8 Medication Aide/Technician
% of Days 100%
6 Physical Therapy Aide
% of Days 88%
3 RN Director of Nursing
% of Days 86%
3 Speech Language Pathologist
% of Days 87%
4 Respiratory Therapy Technician
% of Days 86%
2 Qualified Social Worker
% of Days 80%
5 Registered Nurse
% of Days 57%
3 Clinical Nurse Specialist
% of Days 70%
1 Mental Health Service Worker
% of Days 69%
1 Nurse Practitioner
% of Days 70%
1 Administrator
% of Days 67%
1 Dietitian
% of Days 65%
4 Physical Therapy Assistant
% of Days 77%
1 Occupational Therapy Assistant
% of Days 3%

Facility Characteristics

Source: CMS Long-Term Care Facility Characteristics (Data as of Jan 2026)

Total census
105 residents
Residents by payment source
Medicare
8 residents (7.6%)
Medicaid
49 residents (46.7%)
Private pay or other
48 residents (45.7%)
Programs & Services
Residents' Group

Residents meet regularly to discuss policies, care quality, and activities

Active Resident Council

Organized group of residents that meets regularly to discuss facility policies, quality of life, and activities.

Quality of care over time

These measures show how residents usually do over time at this home, based on health outcomes and preventive care.

High-risk clinical events score Info A composite score based on pressure ulcers, falls with injury, weight loss, walking ability decline, and activities of daily living decline. 6.8
22% better than Texas average

Texas average: 8.6

Functional decline score Info A composite score based on activities of daily living decline, walking ability decline, and incontinence. 13.2
17% better than Texas average

Texas average: 16.0

Long-stay resident measures
Need for Help with Daily Activities Increased Info Percent of long-stay residents whose need for help with daily activities has increased 14.4%
11% better than Texas average

Texas average: 16.2%

Walking Ability Worsened Info Percent of long-stay residents whose ability to move independently worsened 12.9%
21% better than Texas average

Texas average: 16.2%

Low Risk Residents with Bowel/Bladder Incontinence Info Percent of low risk long-stay residents who lose control of their bowels or bladder 12.5%
20% better than Texas average

Texas average: 15.7%

Falls with Major Injury Info Percent of long-stay residents experiencing one or more falls with major injury 2.1%
35% better than Texas average

Texas average: 3.2%

High Risk Residents with Pressure Ulcers Info Percent of long-stay high risk residents with pressure ulcers 2.6%
41% better than Texas average

Texas average: 4.4%

Urinary Tract Infection Info Percent of long-stay residents with a urinary tract infection 0.4%
56% better than Texas average

Texas average: 0.8%

Lost Too Much Weight Info Percent of long-stay residents who lose too much weight 1.8%
48% better than Texas average

Texas average: 3.5%

Depressive Symptoms Info Percent of long-stay residents who have depressive symptoms 0.4%
87% better than Texas average

Texas average: 2.9%

Antipsychotic Use Info Percent of long-stay residents who received an antipsychotic medication 3.9%
50% better than Texas average

Texas average: 7.9%

Pneumococcal Vaccine Info Percent of long-stay residents assessed and appropriately given the pneumococcal vaccine 100.0%
In line with Texas average

Texas average: 97.3%

Influenza Vaccine Info Percent of long-stay residents assessed and appropriately given the seasonal influenza vaccine 98.7%
In line with Texas average

Texas average: 97.9%

Short-stay resident measures
Pneumococcal Vaccine Info Percent of short-stay residents assessed and appropriately given the pneumococcal vaccine 98.2%
9% better than Texas average

Texas average: 90.4%

Antipsychotic medication increase Info Percent of short-stay residents who newly received an antipsychotic medication 1.2%
19% better than Texas average

Texas average: 1.4%

Influenza Vaccine Info Percent of short-stay residents assessed and appropriately given the seasonal influenza vaccine 97.8%
11% better than Texas average

Texas average: 88.0%

Guides for Better Senior Living

Care Cost Calculator: See Prices in Your Area

Nursing Home Data Explorer

Don’t Wait Too Long: 7 Red Flag Signs Your Parent Needs Assisted Living Now

The True Cost of Assisted Living in 2025 – And How Families Are Paying For It

Understanding Senior Living Costs: Pricing Models, Discounts & Financial Assistance

Financial Aid for Texas Seniors

Get financial aid guidance

Community Care for the Aged and Disabled (CCAD)

TX Medicaid CCAD

Age 65+ or disabled, Texas resident, Medicaid-eligible, care need (not always nursing home level).

~$2,829/month (300% FBR, individual).

$2,000 (individual), $3,000 (couple).

Large state; rural access challenges.

Texas Community Care Services

TX CCS

Age 60+, Texas resident, at risk of decline.

~$2,000/month (individual, varies).

$5,000 (individual).

Limited funding; high demand in urban areas.

Area Agency on Aging (AAA) Services

Texas AAA Services

Age 60+, TX resident; no income/asset limits.

None; donations encouraged.

Not assessed.

28 AAAs; includes Meals on Wheels in some areas.

Medicare Savings Program (MSP)

Texas Medicare Savings Program

Age 65+ or disabled, TX resident, Medicare Part A/B.

~$2,510/month (QMB), ~$3,380/month (SLMB), ~$3,598/month (QI)—individual.

$9,430 (individual), $14,130 (couple).

Includes Extra Help for Part D; no waitlist.

Low-Income Home Energy Assistance Program (LIHEAP)

Texas Comprehensive Energy Assistance Program (CEAP)

Age 60+ prioritized, TX resident, low-income.

~$3,970/month (185% FPL).

Not assessed.

Priority for elderly/disabled; covers gas, electric, propane.

Family Caregiver Support Program (FCSP)

Texas Family Caregiver Support Program

Caregivers of 60+ needing care or 55+ caregivers of others; TX resident; 2+ ADLs.

No strict cap; prioritizes low-income (~$24,980/year).

Not assessed.

High rural demand; includes grandparent caregivers.

Senior Community Service Employment Program (SCSEP)

Texas SCSEP

Age 55+, unemployed, low-income, TX resident.

~$1,983/month (125% FPL).

Not specified.

Priority for veterans, rural residents; AARP partnership.

VA Aid and Attendance (A&A) and Housebound Benefits

Texas VA Aid and Attendance/Housebound

Age 65+ or disabled veteran/spouse, TX resident, wartime service, ADL help (A&A) or homebound.

Net income < ~$1,984/month (veteran with dependent, A&A); pension offsets income.

~$155,356 (net worth).

High veteran population; supports rural/urban needs.

Property Tax Exemption for Seniors

Texas Senior Property Tax Exemption

Age 65+, TX resident, homeowner (homestead).

None; tax-based eligibility.

Not assessed.

$25,000+ exemption; optional freeze in some counties; saves ~$500-$1,000/year.

Senior Farmers’ Market Nutrition Program (SFMNP)

Texas SFMNP

Age 60+, TX resident, low-income.

~$2,322/month (185% FPL).

Not assessed.

Vouchers (~$50/season); serves ~20,000 via 28 AAAs.

Tour Icon
Planning a tour? Check our touring checklist.
Chat Icon
Thinking of living here? We can help you speak to a current resident