


Total health inspections
4
Texas average 7.4
Last Health inspection on Oct 2024
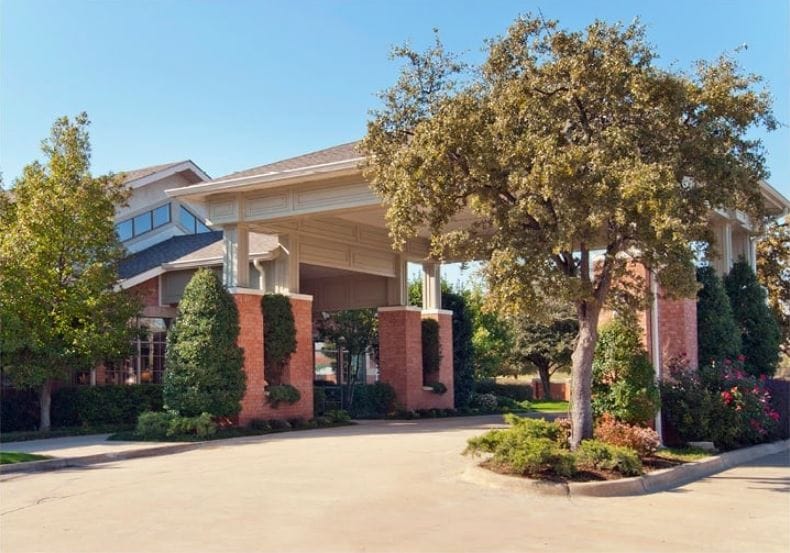
Nestled in the serene neighborhood of Irving, TX, The Remington at Valley Ranch is an enticing senior living community providing independent living and temporary stay services. Well-appointed and comfortable pet-friendly accommodations with several floor plans from one-bedroom to two-bedroom are available for its residents. The community secures round-the-clock care and assistance for its residents through its competent and compassionate team.
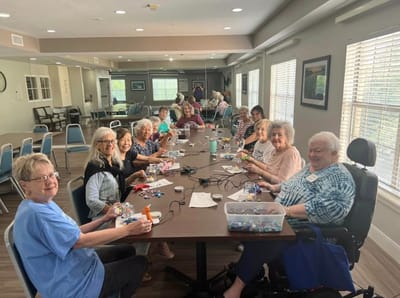
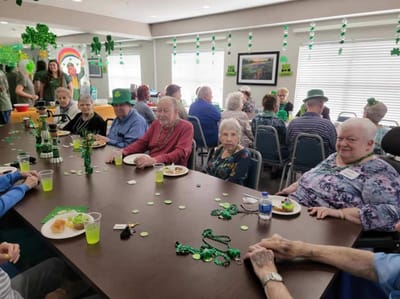
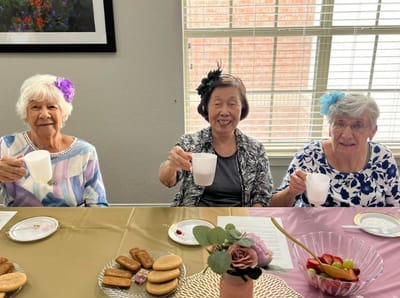
With top-tier amenities and services, residents can enjoy delightful and nutritious meals in restaurant-style dining, housekeeping services, and transportation services to nearby locations. Participate in a full calendar of activities to boost life-enrichment and social engagement. Create lasting connections upon meeting new companions through its community events. With The Remington at Valley Ranch, seniors are assured of a living experience worth remembering.
| Staff type | Hours / Day / Resident | vs state avg |
|---|---|---|
|
Registered Nurse (RN)
| 10m per day | ▼ 61% State avg: 26m per day · National avg: 41m per day |
|
LPN / LVN
| 1h 9m per day | ▲ 21% State avg: 57m per day · National avg: 52m per day |
|
Nurse Aide
| 2h 21m per day | ▲ 16% State avg: 2h 1m per day · National avg: 2h 20m per day |
|
Weekend Total Nursing
| 3h 3m per day | ■ Avg State avg: 2h 59m per day · National avg: 3h 26m per day |
|
Physical Therapist
| 5m per day | ▲ 17% State avg: 4m per day · National avg: 4m per day |
|
Weekend RN
| 5m per day | ▼ 77% State avg: 20m per day · National avg: 28m per day |
The Remington at Valley Ranch is legally operated by Unknown Owner.
In Texas, the Health and Human Services Commission (HHSC) is the primary regulatory body that conducts unannounced inspections and publishes quality reports for all long-term care homes.
Citations
| This Facility | TX Average | vs. TX Avg |
|---|---|---|---|
|
Total citations
| 0 | 6 | This facility has 100% fewer total citations than a typical Texas nursing home (0 vs. TX avg 6).↓ 100% better |
Texas average 7.4
Last Health inspection on Oct 2024
Texas average 25.9
Texas average 3.67
Health citations are formal notices following inspections when they fail to comply with safety and care standards.
9 of 15 citations resulted from standard inspections; 1 of 15 resulted from complaint investigations; and 5 of 15 came from combined inspections (standard and complaint).
Texas average: 2
Texas average: 0.4
Reporting period: October 1 – December 31, 2025 (Q4 2025). Source: CMS Payroll-Based Journal report.
Manages medical care and health needs.
Assists with medical care and medications.
Helps with daily care and mobility.
Total hours from contractors
5,982 contractor hours this quarter
| Certified Nursing Assistant | 73 | 2 | 75 | 19,714 | 92 | 100% | 7.1 |
| Licensed Practical Nurse | 24 | 0 | 24 | 9,492 | 92 | 100% | 9.4 |
| Medication Aide/Technician | 12 | 0 | 12 | 3,859 | 92 | 100% | 8.6 |
| RN Director of Nursing | 4 | 0 | 4 | 2,042 | 73 | 79% | 7.9 |
| Physical Therapy Aide | 0 | 6 | 6 | 1,811 | 83 | 90% | 7.4 |
| Speech Language Pathologist | 0 | 4 | 4 | 1,502 | 87 | 95% | 7.4 |
| Respiratory Therapy Technician | 0 | 4 | 4 | 785 | 78 | 85% | 6.5 |
| Physical Therapy Assistant | 0 | 3 | 3 | 765 | 81 | 88% | 6.9 |
| Clinical Nurse Specialist | 3 | 0 | 3 | 745 | 62 | 67% | 7.9 |
| Qualified Social Worker | 0 | 2 | 2 | 658 | 79 | 86% | 8.2 |
| Nurse Practitioner | 1 | 0 | 1 | 506 | 65 | 71% | 7.8 |
| Administrator | 1 | 0 | 1 | 502 | 62 | 67% | 8.1 |
| Dietitian | 1 | 0 | 1 | 491 | 60 | 65% | 8.2 |
| Registered Nurse | 3 | 0 | 3 | 435 | 54 | 59% | 7.9 |
| Mental Health Service Worker | 1 | 0 | 1 | 412 | 51 | 55% | 8.1 |
Federal penalties imposed by CMS for regulatory violations, including civil money penalties (fines) and denials of payment for new Medicare/Medicaid admissions.
Source: CMS Penalties Database
No penalties in the past 3 years
No civil money penalties or payment denials were reported in the last 3 years.
These measures show how residents usually do over time at this home, based on health outcomes and preventive care.
Texas average: 8.6
Texas average: 16.0
Texas average: 16.2%
Texas average: 16.2%
Texas average: 15.7%
Texas average: 3.2%
Texas average: 4.4%
Texas average: 0.8%
Texas average: 3.5%
Texas average: 2.9%
Texas average: 7.9%
Texas average: 97.3%
Texas average: 97.9%
Texas average: 2.13
Texas average: 2.07
Texas average: 90.4%
Texas average: 1.4%
Texas average: 88.0%
Texas average: 25.9%
Texas average: 12.0%
Texas average: 0.8%
Texas average: 53.7%
Texas average: 50.6%
Quality measures are calculated from Minimum Data Set (MDS) assessments. For most measures, lower percentages indicate better care quality.
23% of new residents, usually for short-term rehab.
63% of new residents, often for short stays.
14% of new residents, often for long-term daily care.
Source: CMS Long-Term Care Facility Characteristics (Data as of Jan 2026)
Residents meet regularly to discuss policies, care quality, and activities
Organized group of residents that meets regularly to discuss facility policies, quality of life, and activities.
Data sourced from CMS Long-Term Care Facility Characteristics quarterly report. Payer mix reflects the current resident census by primary payment source.
Historical financial and operational data for The Remington at Valley Ranch from 2021–2022, based on CMS SNF Cost Reports.
Key figures below are for fiscal year ending in 03/2022 — the home's most recent complete cost report, an older period than most facilities report.
Based on the home's most recent complete CMS SNF Cost Report — fiscal year ending in 03/2022. This is an older period than most facilities report, so compare with that in mind.
Pets Allowed
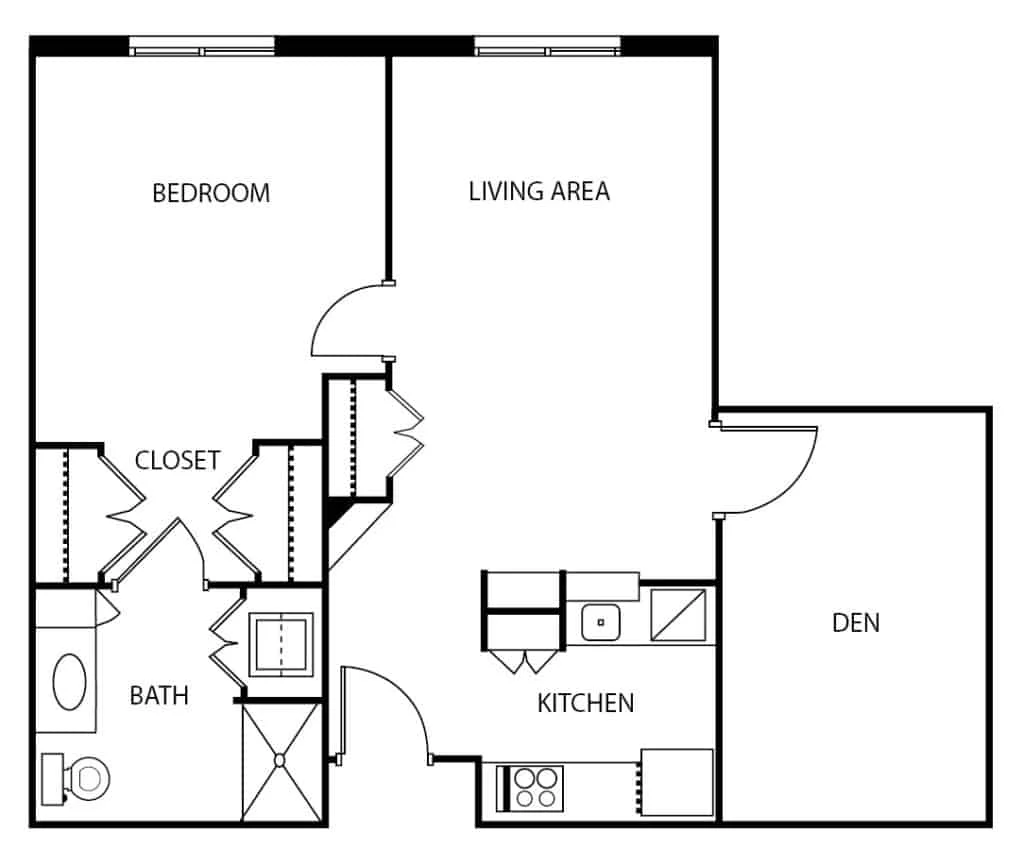
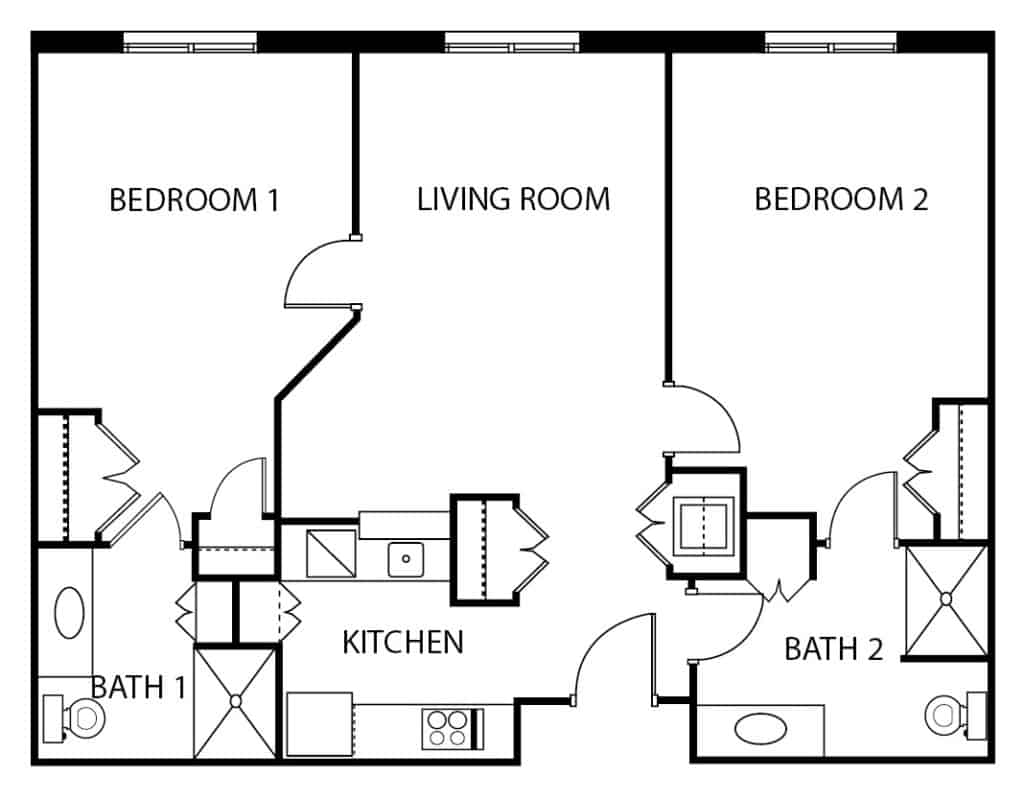
Room Sizes: 544 - 840 / 1040 sq. ft.
Housing Options: 1 Bed / 2 Bed
Building Type: Single-story
Transportation Services
Fitness and Recreation
Residents typically stay for brief periods, with frequent admissions and discharges throughout the year.
Most new residents arrive under private pay (63% of admissions), and a typical private pay stay runs around 26 days.
Coverage residents most often arrive under.
Coverage residents most often leave under.

![]() 7.7 miles from city center
7.7 miles from city center
![]() Estimated distance in miles from Irving's city center to The Remington at Valley Ranch's address, calculated via Google Maps.
Estimated distance in miles from Irving's city center to The Remington at Valley Ranch's address, calculated via Google Maps.
Add your location
The information below is reported by the Texas Health and Human Services Commission.
| The Legacy Midtown Park | NH AL HOS IL MC SNF | Dallas (Vickery Meadow) | 98
Facility
98
TX AVG
80
Rank
#370 / 976 | - | - | 5.42
Facility
5.42
TX AVG
3.63
Rank
#13 / 273 | +1% | +49% | $27.5k
Facility
$27.5k
TX AVG
$81.8k
Rank
#157 / 278 | 4
Facility
4
TX AVG
25.9
Rank
#2 / 274 | 1.3
Facility
1.3
TX AVG
3.7
Rank
#2 / 274 | - | 48 | - |
45
Facility
45
TX AVG
41
Rank
#626 / 1389 | The Legacy Midtown Park Inc | $16.1MFiscal year ending 09/2023
Facility
$16.1MFiscal year ending 09/2023
TX AVG
$8.4M
Rank
#11 / 280 | $15.0MFiscal year ending 09/2023
Facility
$15.0MFiscal year ending 09/2023
TX AVG
$3.5M
Rank
#11 / 280 | 93%Fiscal year ending 09/2023
Facility
93%Fiscal year ending 09/2023
TX AVG
47%
Rank
#194 / 280 | 676489 | ||||
| Presbyterian Village North | NH AL IL MC RC SNF | Dallas (Lake Highlands) | 88
Facility
88
TX AVG
80
Rank
#433 / 976 |
78.4%
Facility
78.4%
TX AVG
67.5
Rank
#69 / 200 | +16% | 4.80
Facility
4.80
TX AVG
3.63
Rank
#25 / 273 | +20% | +32% | $36.5k
Facility
$36.5k
TX AVG
$81.8k
Rank
#177 / 278 | 18
Facility
18
TX AVG
25.9
Rank
#94 / 274 | 2.3
Facility
2.3
TX AVG
3.7
Rank
#44 / 274 | 2 | 69 | - |
61
Facility
61
TX AVG
41
Rank
#267 / 1389 | Dustin Allen | $11.4MFiscal year ending 12/2023
Facility
$11.4MFiscal year ending 12/2023
TX AVG
$8.4M
Rank
#5 / 280 | $20.1MFiscal year ending 12/2023
Facility
$20.1MFiscal year ending 12/2023
TX AVG
$3.5M
Rank
#4 / 280 | 176.3%Fiscal year ending 12/2023
Facility
176.3%Fiscal year ending 12/2023
TX AVG
47%
Rank
#207 / 280 | 676135 | ||||
| C C Young Memorial Home | NH AL HC HOS IL MC PC SNF | Dallas | 129
Facility
129
TX AVG
80
Rank
#140 / 976 |
90.5%
Facility
90.5%
TX AVG
67.5
Rank
#29 / 200 | +34% | 4.91
Facility
4.91
TX AVG
3.63
Rank
#21 / 273 | +8% | +35% | $0
Facility
$0
TX AVG
$81.8k
Rank
#1 / 278 | 6
Facility
6
TX AVG
25.9
Rank
#8 / 274 | 1.5
Facility
1.5
TX AVG
3.7
Rank
#6 / 274 | - | 117 | - |
20
Facility
20
TX AVG
41
Rank
#1092 / 1389 | C. C. Young Memorial Home | $30.1MFiscal year ending 03/2024
Facility
$30.1MFiscal year ending 03/2024
TX AVG
$8.4M
Rank
#4 / 280 | $28.1MFiscal year ending 03/2024
Facility
$28.1MFiscal year ending 03/2024
TX AVG
$3.5M
Rank
#1 / 280 | 93.2%Fiscal year ending 03/2024
Facility
93.2%Fiscal year ending 03/2024
TX AVG
47%
Rank
#72 / 280 | 675592 | ||||
| Christian Care Communities and Services – Mesquite | NH AL IL MC RC SNF | Mesquite | 180
Facility
180
TX AVG
80
Rank
#26 / 976 |
55.4%
Facility
55.4%
TX AVG
67.5
Rank
#157 / 200 | -18% | 3.66
Facility
3.66
TX AVG
3.63
Rank
#105 / 273 | +32% | +1% | $28.9k
Facility
$28.9k
TX AVG
$81.8k
Rank
#159 / 278 | 16
Facility
16
TX AVG
25.9
Rank
#69 / 274 | 1.6
Facility
1.6
TX AVG
3.7
Rank
#7 / 274 | 4 | 100 | - |
31
Facility
31
TX AVG
41
Rank
#912 / 1389 | Ccc Mesquite Management LLC | $5.4M*Fiscal year ending 12/2021These figures are from this home's most recent complete cost report — an older period than most facilities report. Compare with that in mind.
Facility
$5.4M*Fiscal year ending 12/2021These figures are from this home's most recent complete cost report — an older period than most facilities report. Compare with that in mind.
TX AVG
$8.4M
Rank
#40 / 280 | $11.2M*Fiscal year ending 12/2021These figures are from this home's most recent complete cost report — an older period than most facilities report. Compare with that in mind.
Facility
$11.2M*Fiscal year ending 12/2021These figures are from this home's most recent complete cost report — an older period than most facilities report. Compare with that in mind.
TX AVG
$3.5M
Rank
#20 / 280 | 206.1%*Fiscal year ending 12/2021These figures are from this home's most recent complete cost report — an older period than most facilities report. Compare with that in mind.
Facility
206.1%*Fiscal year ending 12/2021These figures are from this home's most recent complete cost report — an older period than most facilities report. Compare with that in mind.
TX AVG
47%
Rank
#28 / 280 | 455617 | ||||
| The Remington at Valley Ranch | NH IL RC | Irving (Valley Ranch) | 122
Facility
122
TX AVG
80
Rank
#190 / 976 |
89.5%
Facility
89.5%
TX AVG
67.5
Rank
#33 / 200 | +33% | 3.91
Facility
3.91
TX AVG
3.63
Rank
#75 / 273 | -73% | +8% | $0
Facility
$0
TX AVG
$81.8k
Rank
#1 / 278 | 15
Facility
15
TX AVG
25.9
Rank
#61 / 274 | 3.8
Facility
3.8
TX AVG
3.7
Rank
#190 / 274 | - | 109 | - |
54
Facility
54
TX AVG
41
Rank
#407 / 1389 | Touchstone Strategies - Mc2 LLC | $10.9M*Fiscal year ending 03/2022These figures are from this home's most recent complete cost report — an older period than most facilities report. Compare with that in mind.
Facility
$10.9M*Fiscal year ending 03/2022These figures are from this home's most recent complete cost report — an older period than most facilities report. Compare with that in mind.
TX AVG
$8.4M
Rank
#84 / 280 | $4.4M*Fiscal year ending 03/2022These figures are from this home's most recent complete cost report — an older period than most facilities report. Compare with that in mind.
Facility
$4.4M*Fiscal year ending 03/2022These figures are from this home's most recent complete cost report — an older period than most facilities report. Compare with that in mind.
TX AVG
$3.5M
Rank
#123 / 280 | 40.4%*Fiscal year ending 03/2022These figures are from this home's most recent complete cost report — an older period than most facilities report. Compare with that in mind.
Facility
40.4%*Fiscal year ending 03/2022These figures are from this home's most recent complete cost report — an older period than most facilities report. Compare with that in mind.
TX AVG
47%
Rank
#209 / 280 | 676476 |
The Remington at Valley Ranch is located in Irving, Texas.
Here are the financial assistance programs available to residents in Texas.
The Remington at Valley Ranch is in the Valley Ranch neighborhood of Irving.
The Remington at Valley Ranch is legally operated by Unknown Owner.
The Remington at Valley Ranch has a walk score of 54. Moderately walkable. Some errands can be accomplished on foot, with a mix of nearby amenities.
The Remington at Valley Ranch's occupancy is 88.2%.
Yes, The Remington at Valley Ranch allows residents to bring their pets.
The Remington at Valley Ranch is registered as a for-profit in TX.
Yes — there are 4 photos of The Remington at Valley Ranch in the photo gallery on this page.
Care Cost Calculator: See Prices in Your Area
Nursing Home Data Explorer
Don’t Wait Too Long: 7 Red Flag Signs Your Parent Needs Assisted Living Now
The True Cost of Assisted Living in 2025 – And How Families Are Paying For It
Understanding Senior Living Costs: Pricing Models, Discounts & Financial Assistance


