


Thank you for your interest!
Our team will be in touch shortly to help with next steps.
Memory Care in Silver Spring
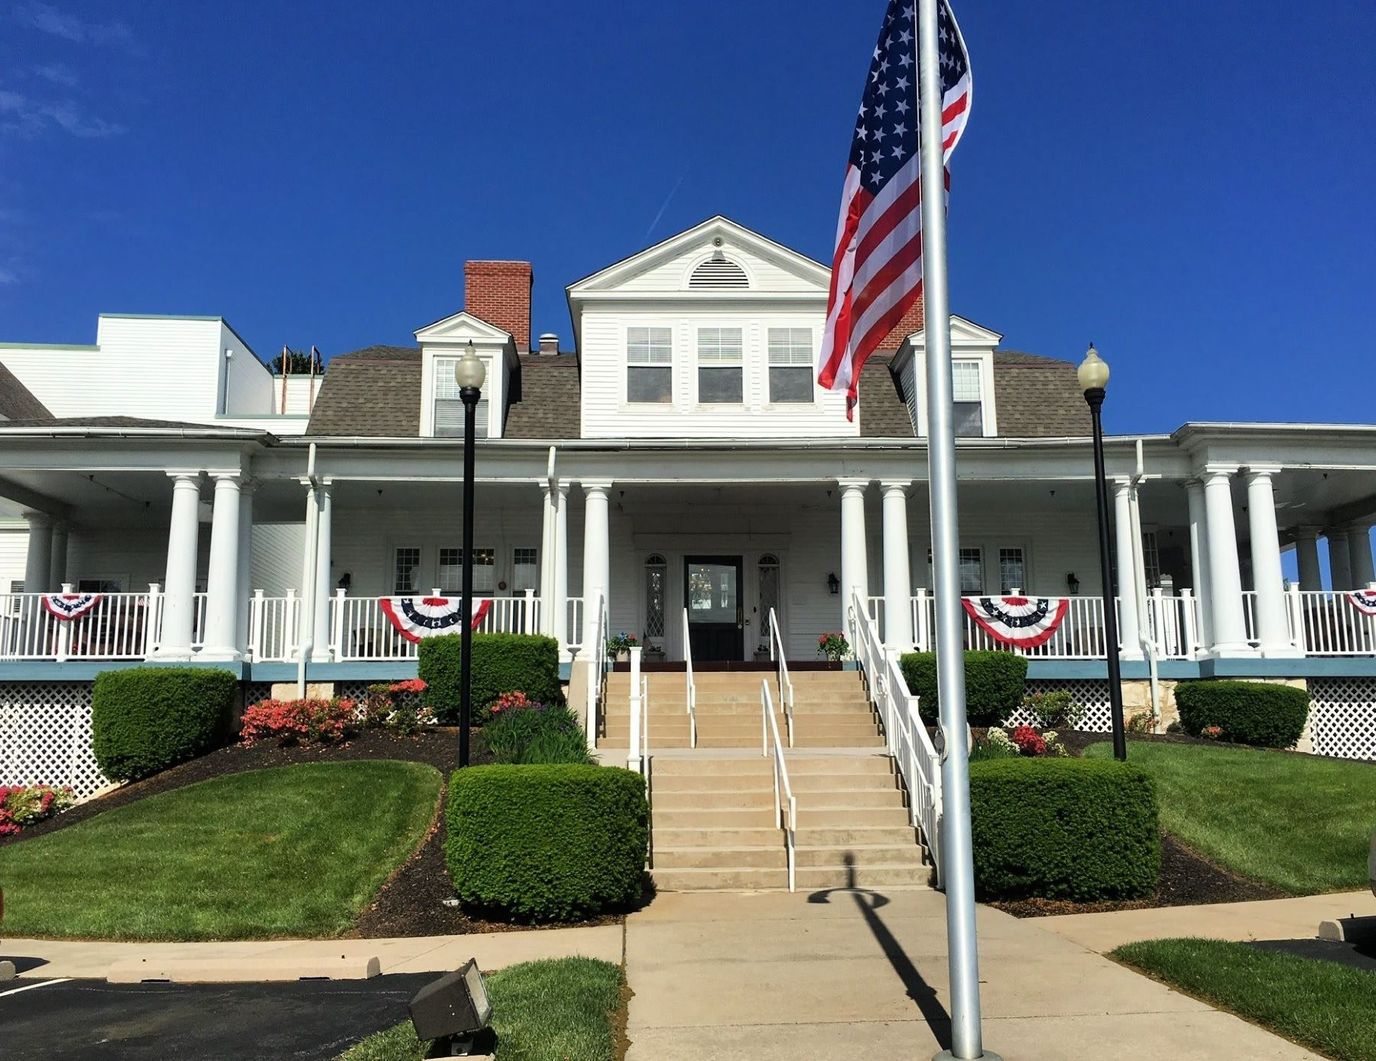
The Terraces at Westminster
Memory Care in Silver Spring
The Terraces at Westminster
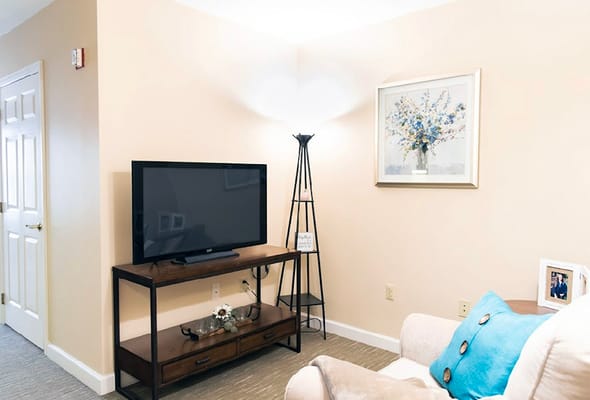
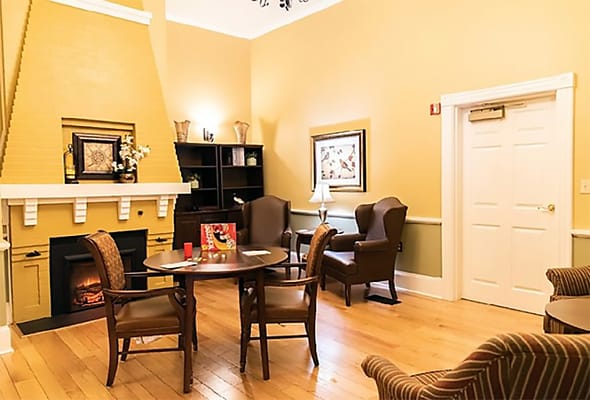
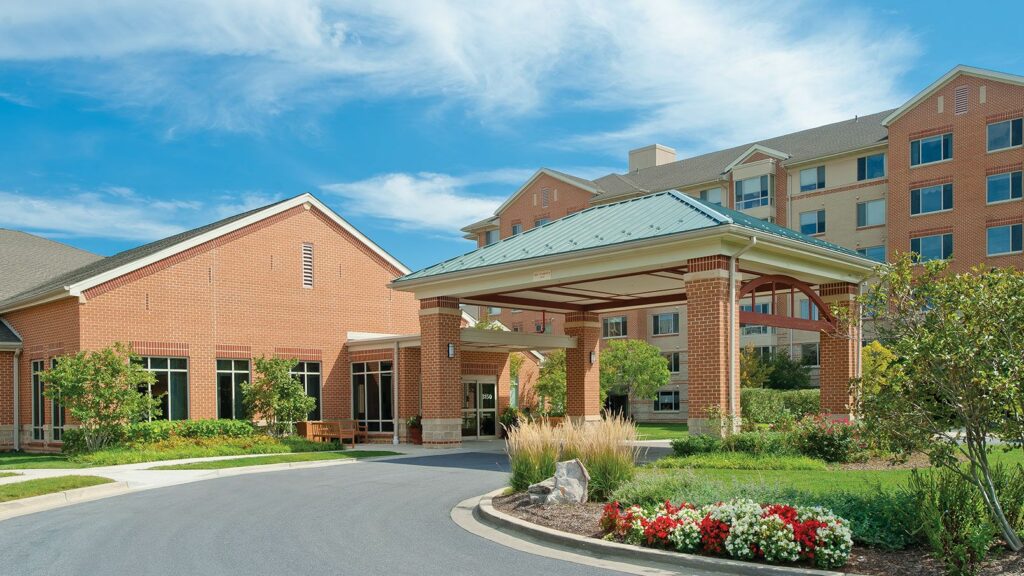
The Terraces at Westminster is a senior living community that offers a wide range of care options, including assisted living, memory care, and rehabilitation services. The apartments offer a variety of floor plans, including studio, one-bedroom, and companion suites, all of which are thoughtfully designed and move-in ready. The community takes pride in its secure environment, providing peace of mind to both residents and their loved ones.
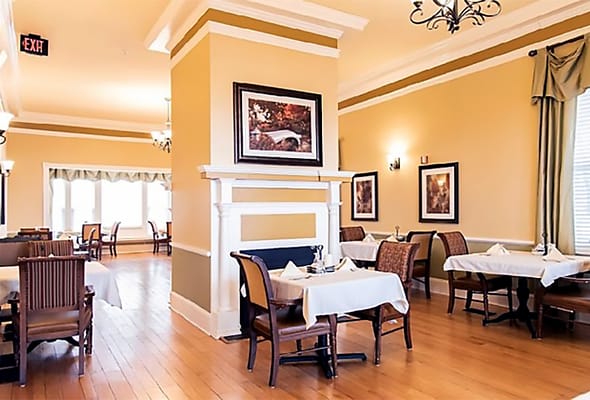
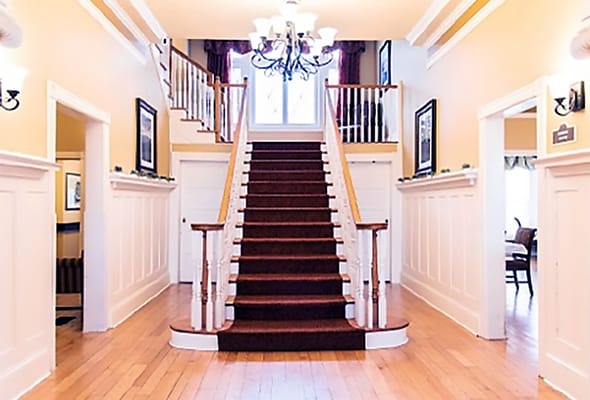
With medical professionals readily available, residents have easy access to the care they need, ensuring their health and well-being are always a top priority. In addition to medical services, the community offers a host of amenities that make daily life worry-free. Housekeeping and laundry services are provided, allowing residents to focus on enjoying their time and engaging in activities that bring them joy. Regular physician visits and an emergency response team further contribute to the safety and well-being of the community. For those seeking moments of reflection and spirituality, the community offers a small library and a chapel. Additionally, residents can enjoy the convenience of a computer center and a beauty salon, providing opportunities for connection and self-care.
Capacity and availability
Smaller home
May offer a more intimate, personalized care environment.
Services
About this community
Hospice Affiliations
Staffing
Key information about the people who lead and staff this community.
Types of Care at The Terraces at Westminster
Demographics
Resident demographic information for this facility.
Gender
- Female 77.8%
- Male 22.2%
Age Distribution
- 75-84 46%
- 85-94 25.4%
- 65-74 22.2%
- 95+ 6.4%
Ethnicity
- White 98.4%
- African American 1.6%
Compare Memory Care around Silver Spring The information below is reported by the Maryland Department of Health, Office of Health Care Quality.
Assisted Living A licensed, long-term care setting for seniors or individuals with disabilities who need help with daily activities — like bathing, dressing, and medication management — but not 24-hour skilled nursing. Offers housing, meals, and around-the-clock support while aiming to maximize resident independence.
Memory Care Secured, specialized care for people living with Alzheimer's or dementia. Staff trained in cognitive impairment, with higher staff-to-resident ratios and an environment designed to reduce confusion and wandering risk.
Nursing Home Licensed facility providing 24/7 skilled nursing care for residents with complex, ongoing medical needs. Staffed by RNs, LPNs, and CNAs. Inspected and star-rated annually by CMS. Accepts Medicare (short-term rehab) and Medicaid (long-term care).
Male Residents — State Benchmarked 29% of residents are male, compared to the Maryland average of 31%. This facility caters to a majority female resident pool (71% female), consistent with the broader assisted living trend where women significantly outnumber men.
Female Residents — State Benchmarked 71% of residents are female, compared to the Maryland average of 69%. Women comprise the large majority, consistent with national assisted living demographics where women live longer and enter care facilities at higher rates.
White Residents — State Benchmarked 89% of residents are reported as White, compared to the Maryland average of 81%. Close to the average for this category among assisted living facilities in Maryland with reported race/ethnicity data.
African American Residents — State Benchmarked 7% of residents are reported as African American or Black, compared to the Maryland average of 12%. In line with the Maryland average for African American residents among facilities reporting this breakdown.
Other Ethnicity Residents — State Benchmarked 4% of residents fall into categories other than White or African American (combined), compared to the Maryland average of 7%. This column aggregates Hispanic, Asian, multiracial, and any other labeled groups that are not classified as White or African American. Reported subgroups in this total: Asian (3%), Hispanic (0%).
Residents Age 65–74 — State Benchmarked 2% of residents are 65–74, compared to the Maryland average of 12%. Fewer younger seniors suggests the resident population skews older, likely requiring higher acuity care and more hands-on support.
Residents Age 75–84 — State Benchmarked 23% of residents are 75–84, compared to the Maryland average of 31%. Below the state norm — the resident mix may skew either younger or older than this typical middle bracket.
Residents Age 85–94 — State Benchmarked 52% of residents are 85–94, compared to the Maryland average of 44%. A high concentration of very elderly residents signals a higher-acuity facility with experience caring for advanced age-related needs.
Residents Age 95+ — State Benchmarked 23% of residents are 95 or older, compared to the Maryland average of 16%. A high proportion of the oldest-old suggests strong end-of-life care experience and very-high-acuity capabilities.
Assisted Living A licensed, long-term care setting for seniors or individuals with disabilities who need help with daily activities — like bathing, dressing, and medication management — but not 24-hour skilled nursing. Offers housing, meals, and around-the-clock support while aiming to maximize resident independence.
Memory Care Secured, specialized care for people living with Alzheimer's or dementia. Staff trained in cognitive impairment, with higher staff-to-resident ratios and an environment designed to reduce confusion and wandering risk.
Respite Care Short-term temporary care — days to weeks — to give family caregivers a break. Full care provided during the stay. Often used after hospitalization or to trial a facility before a permanent placement decision.
Male Residents — State Benchmarked 22% of residents are male, compared to the Maryland average of 31%. This facility caters to a majority female resident pool (78% female), consistent with the broader assisted living trend where women significantly outnumber men.
Female Residents — State Benchmarked 78% of residents are female, compared to the Maryland average of 69%. Women comprise the large majority, consistent with national assisted living demographics where women live longer and enter care facilities at higher rates.
White Residents — State Benchmarked 98% of residents are reported as White, compared to the Maryland average of 81%. A higher White share than is typical for assisted living in Maryland in this dataset — compare with peer facilities for local context.
African American Residents — State Benchmarked 2% of residents are reported as African American or Black, compared to the Maryland average of 12%. A lower African American share than is typical in Maryland; local markets still vary widely.
Other Ethnicity Residents — State Benchmarked 0% of residents fall into categories other than White or African American (combined), compared to the Maryland average of 7%. This column aggregates Hispanic, Asian, multiracial, and any other labeled groups that are not classified as White or African American.
Residents Age 65–74 — State Benchmarked 22% of residents are 65–74, compared to the Maryland average of 12%. A higher share of younger seniors often signals a more independent, active resident community with lower acuity care needs.
Residents Age 75–84 — State Benchmarked 46% of residents are 75–84, compared to the Maryland average of 31%. A high concentration in this mid-range bracket, where residents typically need moderate support with daily activities.
Residents Age 85–94 — State Benchmarked 25% of residents are 85–94, compared to the Maryland average of 44%. The population here skews younger than the statewide norm, which may indicate a more active, lower-acuity community.
Residents Age 95+ — State Benchmarked 6% of residents are 95 or older, compared to the Maryland average of 16%. Most residents here have not yet reached the oldest-old bracket, suggesting a younger overall community.
Assisted Living A licensed, long-term care setting for seniors or individuals with disabilities who need help with daily activities — like bathing, dressing, and medication management — but not 24-hour skilled nursing. Offers housing, meals, and around-the-clock support while aiming to maximize resident independence.
Memory Care Secured, specialized care for people living with Alzheimer's or dementia. Staff trained in cognitive impairment, with higher staff-to-resident ratios and an environment designed to reduce confusion and wandering risk.
Places of interest near The Terraces at Westminster
![]() 0.9 miles from city center — 0.44 miles to nearest hospital (Carroll County Sleep Disorders)
0.9 miles from city center — 0.44 miles to nearest hospital (Carroll County Sleep Disorders)
Calculate Travel Distance to The Terraces at Westminster
Add your location
Guides for Better Senior Living
Care Cost Calculator: See Prices in Your Area
Nursing Home Data Explorer
Don’t Wait Too Long: 7 Red Flag Signs Your Parent Needs Assisted Living Now
The True Cost of Assisted Living in 2025 – And How Families Are Paying For It
Understanding Senior Living Costs: Pricing Models, Discounts & Financial Assistance
Financial Aid for Maryland Seniors
Get financial aid guidanceTouring Checklist for Senior Living
Touring a community? Use this expert-backed checklist to stay organized, ask the right questions, and find the perfect fit.
Location
Community Spaces and Overall Environment
Services
Staffing
Accommodations
Finances
Other Notes
Send Checklist to Your Email
We'll send you a PDF version of the touring checklist.

Write a review for The Terraces at Westminster
Rate your overall experience with this community
Need Help?
Let us help you or a loved one find the perfect senior home.
