Explore Open Rooms

1 Contact details
2 What type of senior care service are you looking for?
3 What budget do you have in mind for senior care?
4 How soon do you need to find care?
5 Additional details

Thank you for your interest!

Our team will be in touch shortly to help with next steps.

Independent Living Home

The Towers on Park Lane

Independent Living Home

The Towers on Park Lane

1 Towers Park Ln, San Antonio, TX 78209 View map
Overview of The Towers on Park Lane

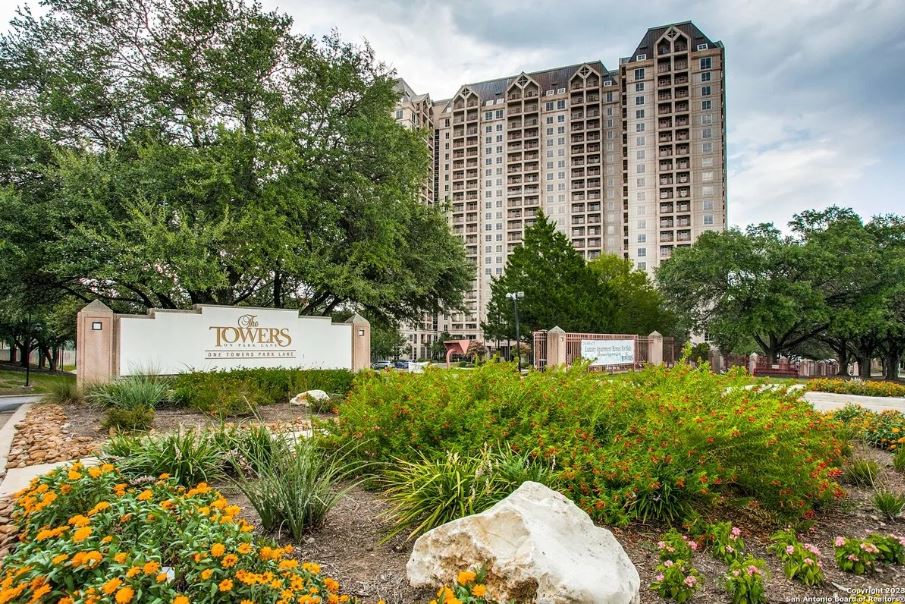
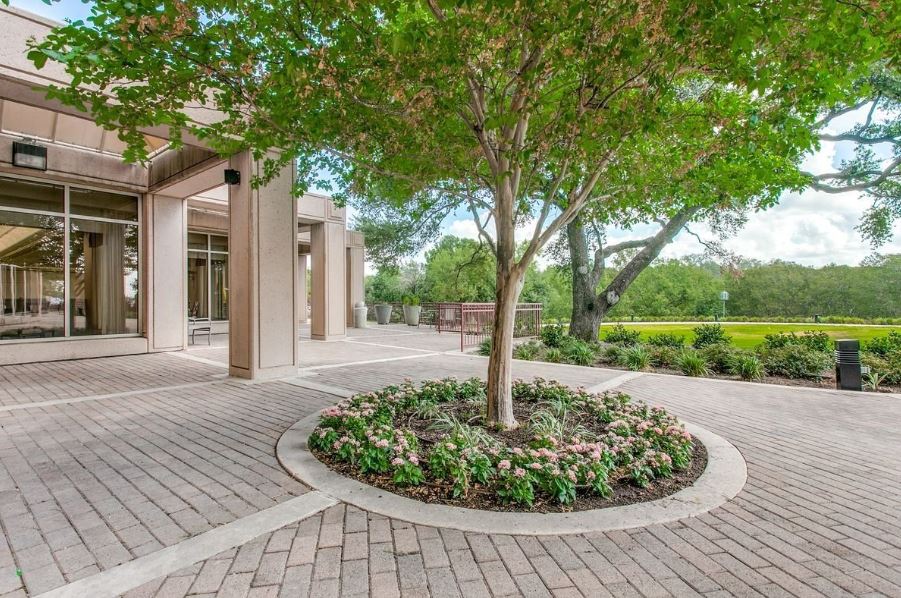
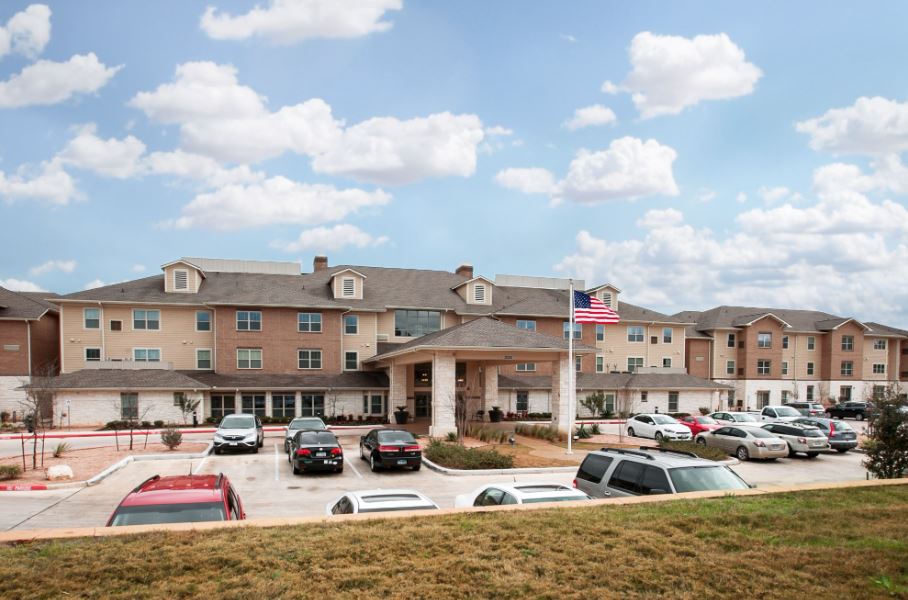
Settled in the beautiful community of San Antonio, TX, the Towers on Park Lane is a welcoming senior living community that provides independent living services. Spacious and cozy accommodations ranging from one-bedroom to two-bedroom and three-bedroom are available for its residents. Having a highly skilled and dedicated team, this community is focused on engaging its residents in an active lifestyle while enjoying independence.

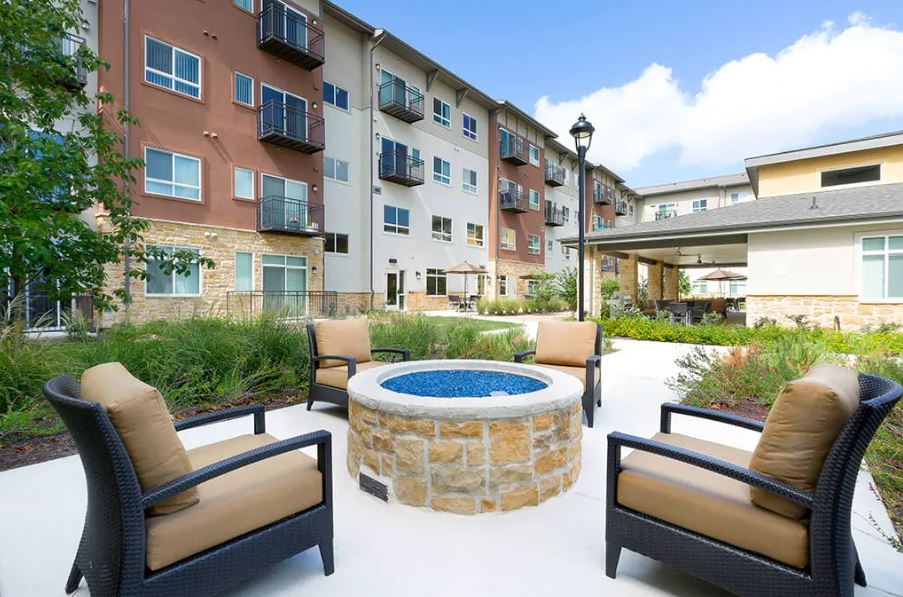
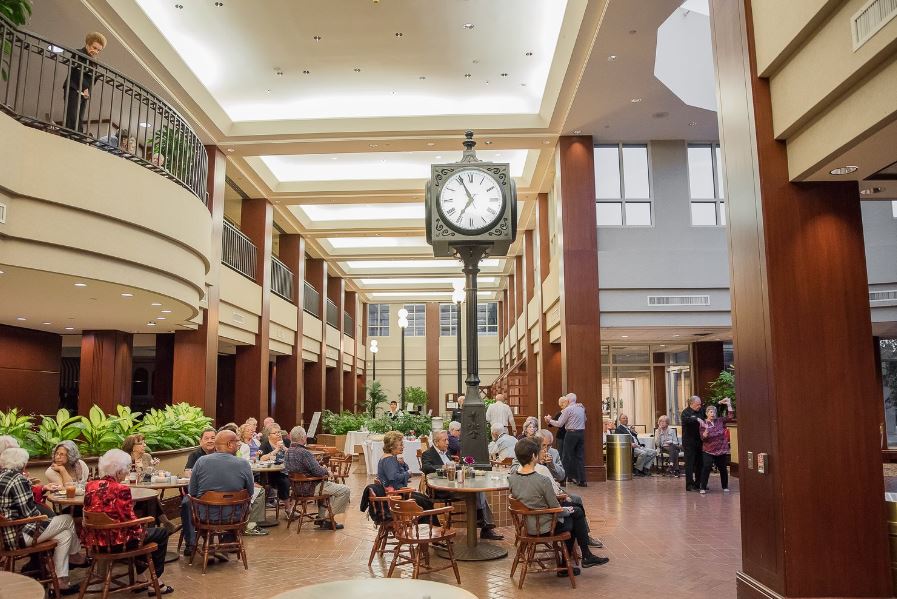
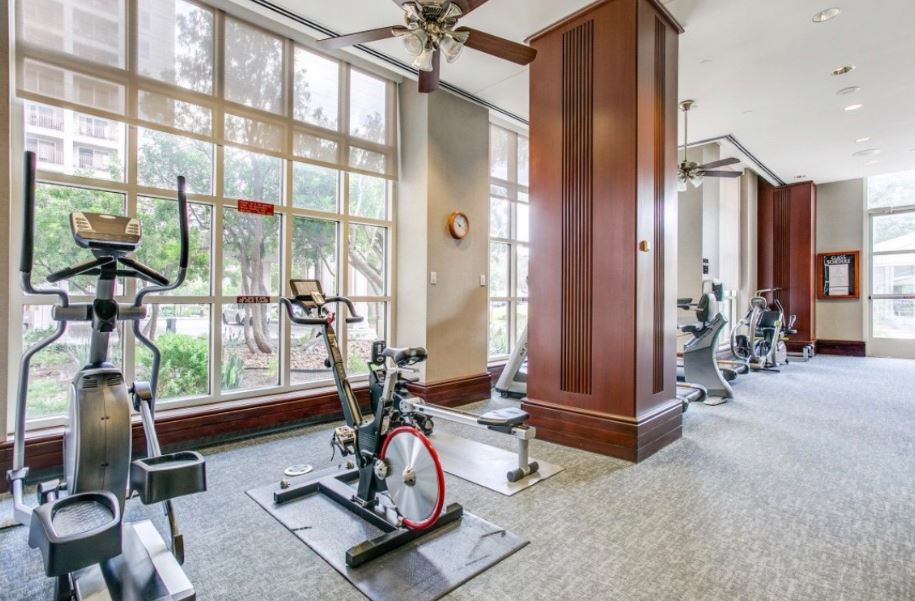
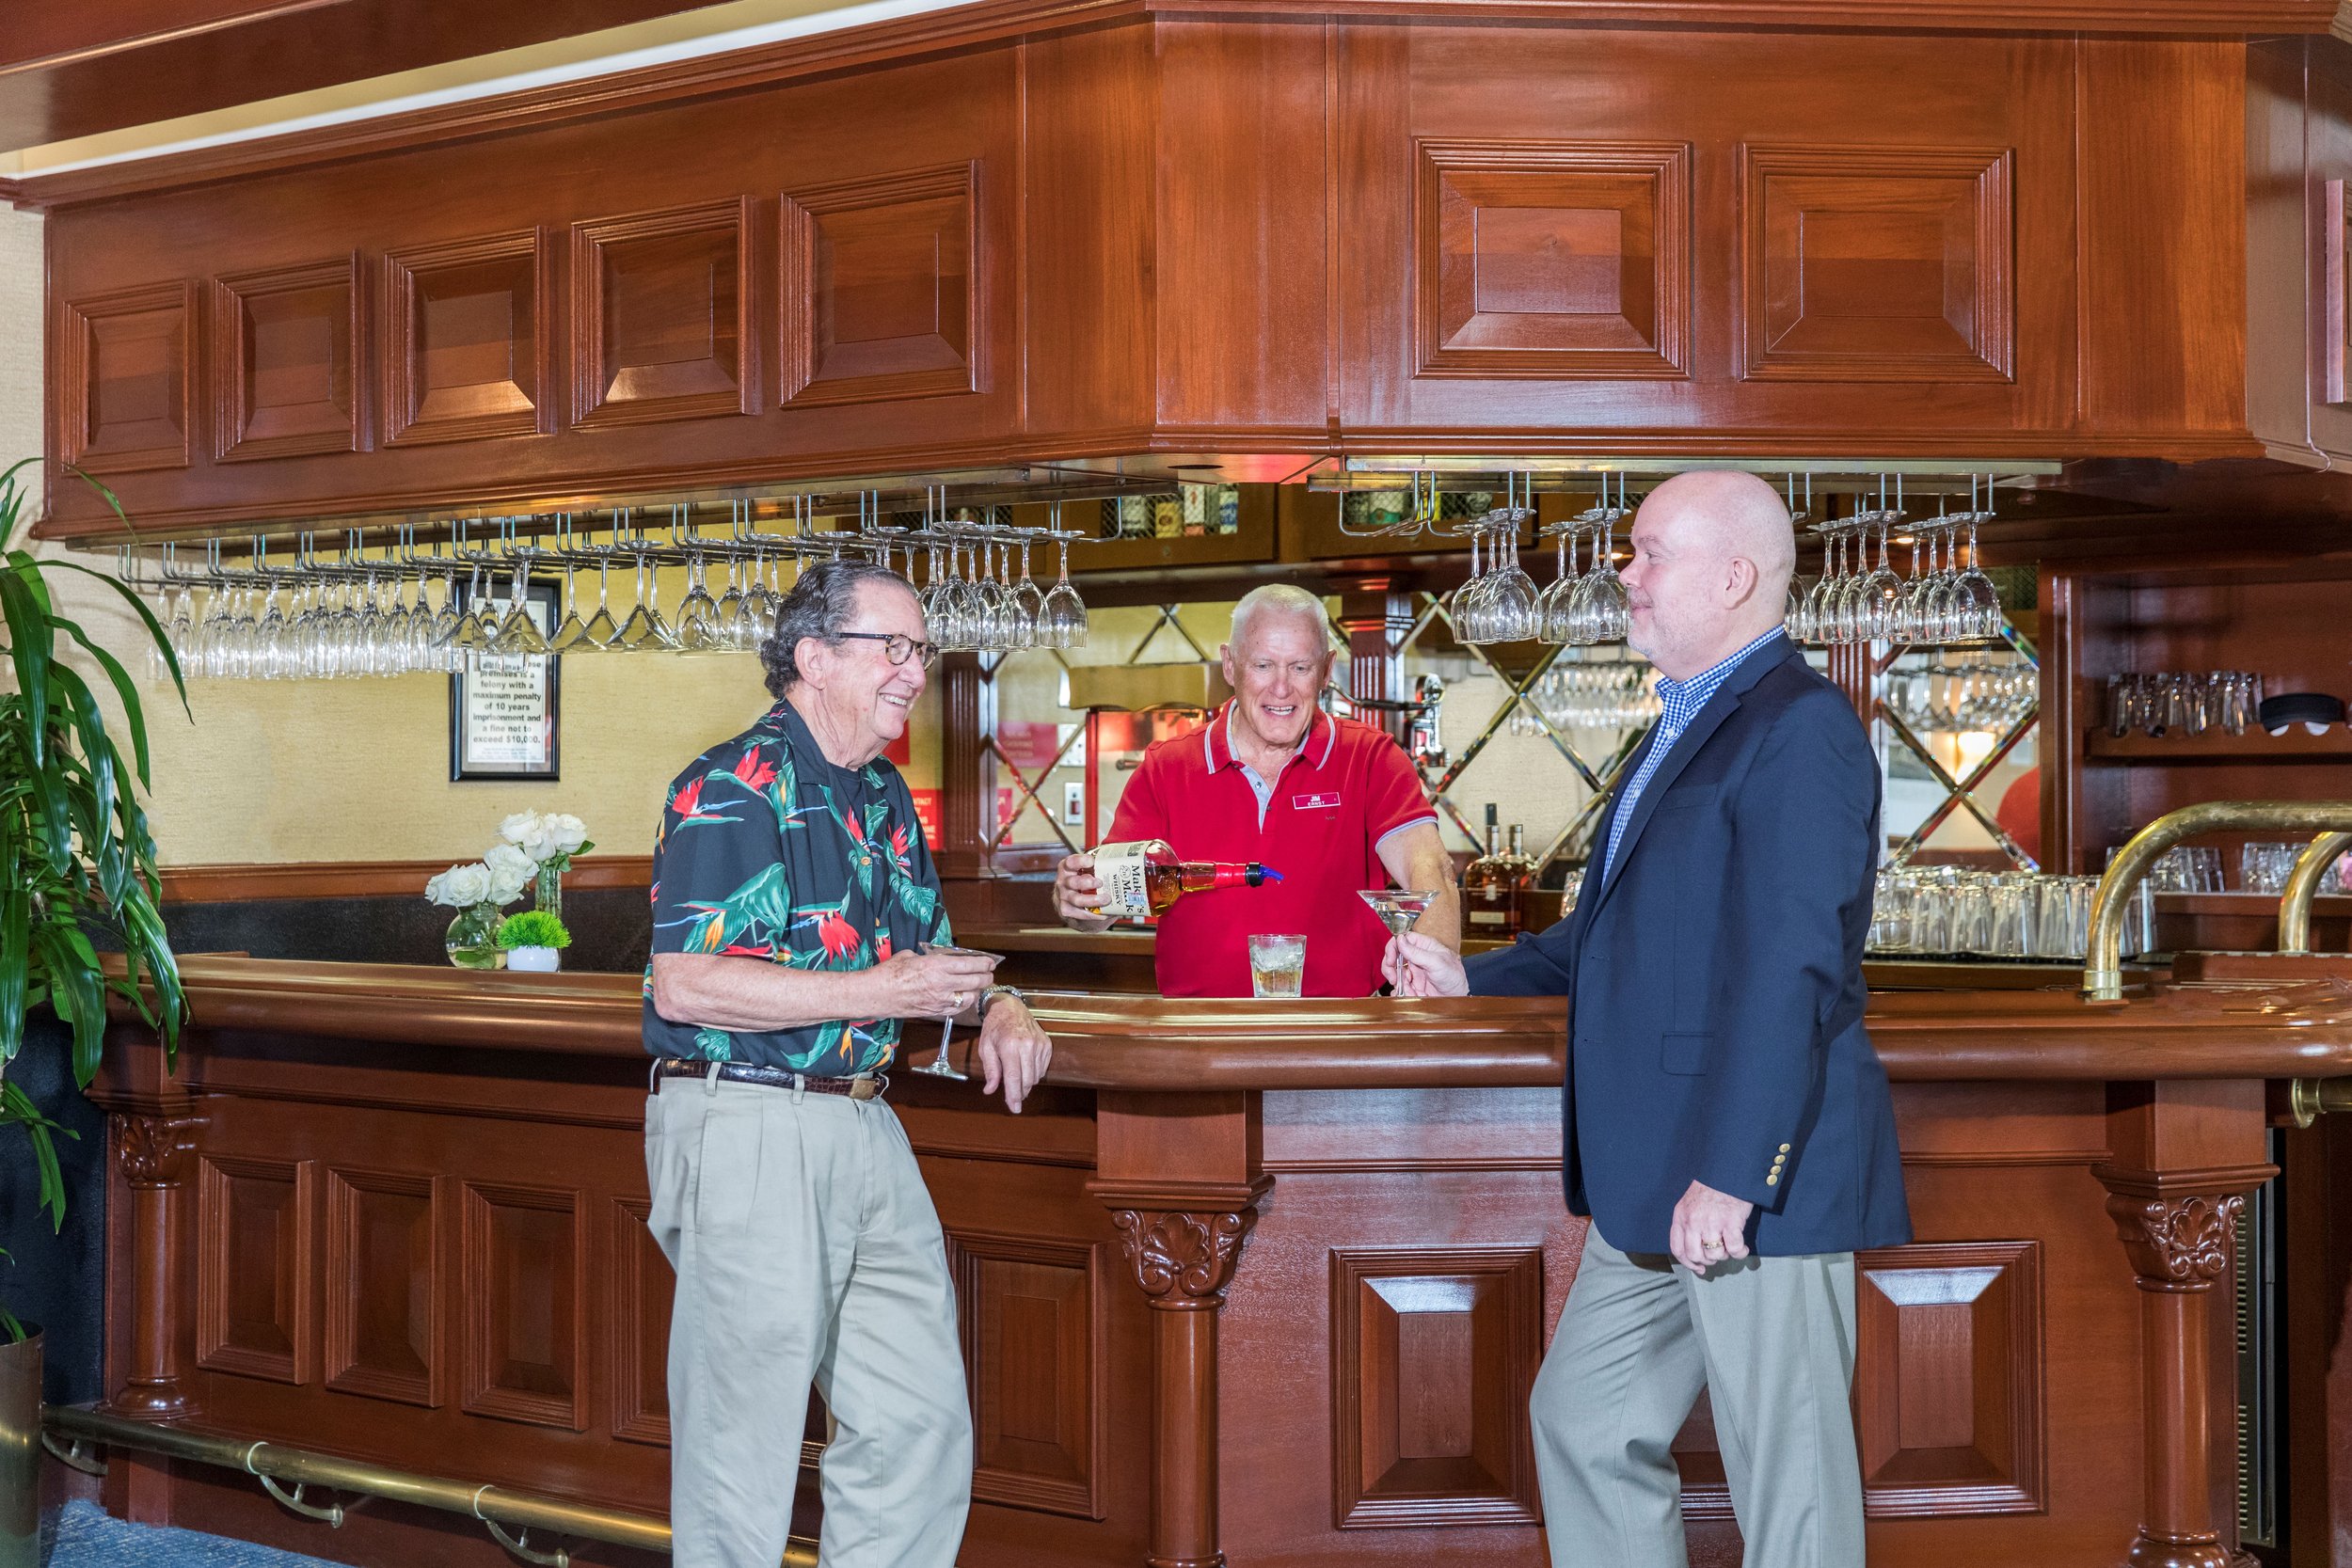
Committed to offering exceptional amenities and services, residents can enjoy fine dining and catering, club 22, walking trails and park, and an indoor pool. Engage in various social activities in the community rooms, woodworking shop, and garden to boost engagement. Enhance health and wellness by joining exercise groups, club fitness, and fitness goals assessments. With the Towers on Park Lane, seniors are guaranteed a one-of-a-kind and truly empowering living.

Quality ratings

Measured by Centers for Medicare & Medicaid Services (CMS)

Overall rating Info The Overall CMS Rating combines results from health inspections, staffing levels and quality measures. Health inspections carry the most weight. Staffing and quality scores can increase or decrease the final rating based on performance compared to state and national standards.
3/5
Texas average: 2.8/5
Health Inspection Info Based on the results of the facility's three most recent standard inspections and any complaint investigations. CMS reviews the number, scope, and severity of deficiencies, with more recent findings weighted more heavily.
2/5
Texas average: 2.8/5
Staffing Info Measures average nursing staff hours per resident per day, including Registered Nurses (RNs) and total nursing staff. Ratings are adjusted based on the level of care residents require and are compared to state and national benchmarks.
2/5
Texas average: 2.1/5
Quality Measures Info Based on clinical and physical health indicators reported to CMS, such as hospital readmissions, falls, pressure ulcers, and improvements in mobility. These measures reflect how well residents' health needs are being managed.
5/5
Texas average: 3.8/5

Nursing care per resident

Info This shows how many total hours of nursing staff time are available per resident each day. Higher numbers usually mean more staff support.
4h 9m per day

This home provides 14% more nursing time per resident than the Texas average.

Texas average: 3h 38m per day

Capacity and availability

Medium-capacity home

Offers a balance of services and community atmosphere.

Total beds 124

This home usually has availability

Lower occupancy suggests more openings may be available.

Lower demand than the Texas average
Occupancy rate 67.9%
Residents per day (avg) 95
Occupancy rate
67.9%
Residents per day (avg)
95

Who this home usually serves

TYPE OF STAY

Primarily short stays

Residents typically stay for brief periods, with frequent admissions and discharges throughout the year.

Might be optimal for
Post-acute recovery Temporary care Transitional stays

Breakdown by payment type

Medicare

16% of new residents, usually for short-term rehab.

Typical stay 28 days

Private pay

80% of new residents, often for short stays.

Typical stay 27 days

Medicaid

4% of new residents, often for long-term daily care.

Typical stay 1 - 2 years

Finances and operations

Governmental community
Operated by state authorities.
Home revenue
$15.4M
Surplus of revenue
$557.4K
Governmental community Operated by state authorities.
Home revenue
$15,422,331.00
Surplus of revenue
$557,353.00
Payroll costs Info The portion of the home's budget spent on staff, including nurses, caregivers, and other employees who support care and operations.
$7.0M
45.1% of revenue
Other operating costs Info All remaining costs needed to run the home, such as food, utilities, building maintenance, supplies and administrative expenses.
$7.9M
Total costs $14.9M
Walk Score
Walk Score: 11 / 100
Car-dependent. Most errands require a car, with limited nearby walkable options.

About this community

Safety & Compliance

Secured Perimeter
Safety Features: 24-hour surveillance, monitored fire alarms, and controlled access.

Care Services

Independent Living

Additional Policies & Features

Minimum Age: 55
Housekeeping: Yes

Dining & Nutrition

Food Description
The Towers on Park Lane offers resort-style dining with two on-site restaurants: The Gardenia for fine dining and The Deli for casual meals.

What does this home offer?

Housing options icon

Housing Options: 1 Bed / 2 Bed / 3 Bed

Building type icon
Building type icon

Building Type: High-rise

Transportation services icon

Transportation Services

Fitness and recreation icon

Fitness and Recreation

Types of Care at The Towers on Park Lane

Independent Living
Contact The Towers on Park Lane

Health Inspection History

Inspections
Total health inspections 14

Texas average 7.4


Last Health inspection on Jul 2025

Total health citations 54

Texas average 25.9

Citations per inspection
3.86

Texas average 3.67


Health citations are formal notices following inspections when they fail to comply with safety and care standards.

7 of 54 citations resulted from standard inspections; 24 of 54 resulted from complaint investigations; and 23 of 54 came from combined inspections (standard and complaint).

Breakdown of citation severity (last 3 years)
Critical Health citations More info 0
100% better than Texas average

Texas average: 2


Serious Health citations More info 0
100% better than Texas average

Texas average: 0.4

0 critical citations More info Texas average: 2

0 serious citations More info Texas average: 0.4

53 moderate citations More info Texas average: 23

1 minor citation More info Texas average: 0.4
Citations history (last 3 years)
Infection Control moderate citation Info Issues related to preventing and controlling infections, including hygiene practices and safety protocols. Jul 17, 2025
Corrected

Quality of Care moderate citation Info Issues related to how well residents receive appropriate treatment and support for their medical and daily care needs. Jul 17, 2025
Corrected

Care Planning moderate citation Info Issues related to creating and updating personalized care plans for residents based on their needs and conditions. Jul 17, 2025
Corrected

Care Planning moderate citation Info Issues related to creating and updating personalized care plans for residents based on their needs and conditions. Jul 17, 2025
Corrected

Compare Independent Living around Bexar County The information below is reported by the Texas Health and Human Services Commission.

The Towers on Park Lane
NH

Nursing Home Licensed facility providing 24/7 skilled nursing care for residents with complex, ongoing medical needs. Staffed by RNs, LPNs, and CNAs. Inspected and star-rated annually by CMS. Accepts Medicare (short-term rehab) and Medicaid (long-term care).

IL

Independent Living Lifestyle-focused communities for older adults offering dining, activities, and transportation with minimal personal care. Best for active, independent seniors who want community without medical support.

San Antonio (Near East Side)
124
-
11
-
-
-
-
-
1 Bed / 2 Bed / 3 Bed
Emerald Oaks Retirement Resort
IL

Independent Living Lifestyle-focused communities for older adults offering dining, activities, and transportation with minimal personal care. Best for active, independent seniors who want community without medical support.

San Antonio
-
-
14
-
-
-
-
-
Studio / 1 Bed / 2 Bed
Affinity at Monterrey Village
IL

Independent Living Lifestyle-focused communities for older adults offering dining, activities, and transportation with minimal personal care. Best for active, independent seniors who want community without medical support.

San Antonio (Far West Side)
-
-
36
-
-
-
-
-
1 Bed / 2 Bed / 3 Bed
Madison Estates-Sky Active Living
IL

Independent Living Lifestyle-focused communities for older adults offering dining, activities, and transportation with minimal personal care. Best for active, independent seniors who want community without medical support.

San Antonio (Northwest Side)
-
-
62
-
-
-
-
-
1 Bed / 2 Bed / 3 Bed

Places of interest near The Towers on Park Lane

Address 12.9 miles from city center

Address 1 Towers Park Ln, San Antonio, TX 78209

Calculate Travel Distance to The Towers on Park Lane

Add your location

Address

Staffing Data (Q2 2025)

This data corresponds to Q2 2025 and is based on CMS Payroll-Based Journal.

Total staff 165
Employees 157
Contractors 8
Staff to resident ratio 1.77:1
18% better than Texas average

Texas average ratio: 1.51:1

Avg staff/day 61
Average shift 8.2 hours
0% compared with Texas average

Texas average: 8.1 hours

Total staff hours (quarter) 45,568
Nursing staff breakdown
Registered Nurse

Manages medical care and health needs.

Total count 7
Average shift length Info Average shift length. Calculated as total hours divided by days worked and average staff per day. 8.7 hours

No contractors work on this role.

Licensed Practical Nurse

Assists with medical care and medications.

Total count 42
Average shift length Info Average shift length. Calculated as total hours divided by days worked and average staff per day. 8.7 hours

This role is partially covered by contractors.

Certified Nursing Assistant

Helps with daily care and mobility.

Total count 53
Average shift length Info Average shift length. Calculated as total hours divided by days worked and average staff per day. 8.3 hours

This role is partially covered by contractors.

Contractor staffing

Total hours from contractors

0.3%

134 contractor hours this quarter

Licensed Practical Nurse: 6 Certified Nursing Assistant: 2
Staff by category
Certified Nursing Assistant5125317,50991100%8.3
Licensed Practical Nurse366428,90691100%8.7
Physical Therapy Aide8082,8997684%6.6
Speech Language Pathologist100102,8558189%7
Medication Aide/Technician120122,83591100%9.4
Registered Nurse7072,0209099%8.7
Physical Therapy Assistant4041,4387178%8
Respiratory Therapy Technician6061,3307785%7.4
RN Director of Nursing7071,1767077%9.2
Qualified Social Worker4048587077%6.9
Dental Services Staff2027626369%8
Nurse Practitioner1016026875%8.9
Dietitian1015836470%9.1
Other Dietary Services Staff1015336571%8.2
Clinical Nurse Specialist5054624246%8.3
Mental Health Service Worker1014565763%8
Administrator1013444347%8
53 Certified Nursing Assistant
% of Days 100%
42 Licensed Practical Nurse
% of Days 100%
8 Physical Therapy Aide
% of Days 84%
10 Speech Language Pathologist
% of Days 89%
12 Medication Aide/Technician
% of Days 100%
7 Registered Nurse
% of Days 99%
4 Physical Therapy Assistant
% of Days 78%
6 Respiratory Therapy Technician
% of Days 85%
7 RN Director of Nursing
% of Days 77%
4 Qualified Social Worker
% of Days 77%
2 Dental Services Staff
% of Days 69%
1 Nurse Practitioner
% of Days 75%
1 Dietitian
% of Days 70%
1 Other Dietary Services Staff
% of Days 71%
5 Clinical Nurse Specialist
% of Days 46%
1 Mental Health Service Worker
% of Days 63%
1 Administrator
% of Days 47%

Facility Characteristics

Source: CMS Long-Term Care Facility Characteristics (Data as of Jan 2026)

Total census
93 residents
Residents by payment source
Medicare
26 residents (28%)
Medicaid
67 residents (72%)
Programs & Services
Residents' Group

Residents meet regularly to discuss policies, care quality, and activities

Active Resident Council

Organized group of residents that meets regularly to discuss facility policies, quality of life, and activities.

Quality of care over time

These measures show how residents usually do over time at this home, based on health outcomes and preventive care.

High-risk clinical events score Info A composite score based on pressure ulcers, falls with injury, weight loss, walking ability decline, and activities of daily living decline. 11.8
37% worse than Texas average

Texas average: 8.6

Functional decline score Info A composite score based on activities of daily living decline, walking ability decline, and incontinence. 23.8
48% worse than Texas average

Texas average: 16.0

Long-stay resident measures
Need for Help with Daily Activities Increased Info Percent of long-stay residents whose need for help with daily activities has increased 20.6%
27% worse than Texas average

Texas average: 16.2%

Walking Ability Worsened Info Percent of long-stay residents whose ability to move independently worsened 29.2%
80% worse than Texas average

Texas average: 16.2%

Low Risk Residents with Bowel/Bladder Incontinence Info Percent of low risk long-stay residents who lose control of their bowels or bladder 21.6%
38% worse than Texas average

Texas average: 15.7%

Falls with Major Injury Info Percent of long-stay residents experiencing one or more falls with major injury 1.1%
65% better than Texas average

Texas average: 3.2%

High Risk Residents with Pressure Ulcers Info Percent of long-stay high risk residents with pressure ulcers 5.3%
20% worse than Texas average

Texas average: 4.4%

Urinary Tract Infection Info Percent of long-stay residents with a urinary tract infection 0.0%
100% better than Texas average

Texas average: 0.8%

Lost Too Much Weight Info Percent of long-stay residents who lose too much weight 2.9%
16% better than Texas average

Texas average: 3.5%

Depressive Symptoms Info Percent of long-stay residents who have depressive symptoms 0.0%
100% better than Texas average

Texas average: 2.9%

Antipsychotic Use Info Percent of long-stay residents who received an antipsychotic medication 2.8%
64% better than Texas average

Texas average: 7.9%

Pneumococcal Vaccine Info Percent of long-stay residents assessed and appropriately given the pneumococcal vaccine 99.3%
In line with Texas average

Texas average: 97.3%

Influenza Vaccine Info Percent of long-stay residents assessed and appropriately given the seasonal influenza vaccine 96.0%
In line with Texas average

Texas average: 97.9%

Short-stay resident measures
Pneumococcal Vaccine Info Percent of short-stay residents assessed and appropriately given the pneumococcal vaccine 98.0%
8% better than Texas average

Texas average: 90.4%

Antipsychotic medication increase Info Percent of short-stay residents who newly received an antipsychotic medication 0.0%
100% better than Texas average

Texas average: 1.4%

Influenza Vaccine Info Percent of short-stay residents assessed and appropriately given the seasonal influenza vaccine 94.7%
8% better than Texas average

Texas average: 88.0%

Guides for Better Senior Living

Care Cost Calculator: See Prices in Your Area

Nursing Home Data Explorer

Don’t Wait Too Long: 7 Red Flag Signs Your Parent Needs Assisted Living Now

The True Cost of Assisted Living in 2025 – And How Families Are Paying For It

Understanding Senior Living Costs: Pricing Models, Discounts & Financial Assistance

Financial Aid for Texas Seniors

Get financial aid guidance

Community Care for the Aged and Disabled (CCAD)

TX Medicaid CCAD

Age 65+ or disabled, Texas resident, Medicaid-eligible, care need (not always nursing home level).

~$2,829/month (300% FBR, individual).

$2,000 (individual), $3,000 (couple).

Large state; rural access challenges.

Texas Community Care Services

TX CCS

Age 60+, Texas resident, at risk of decline.

~$2,000/month (individual, varies).

$5,000 (individual).

Limited funding; high demand in urban areas.

Area Agency on Aging (AAA) Services

Texas AAA Services

Age 60+, TX resident; no income/asset limits.

None; donations encouraged.

Not assessed.

28 AAAs; includes Meals on Wheels in some areas.

Medicare Savings Program (MSP)

Texas Medicare Savings Program

Age 65+ or disabled, TX resident, Medicare Part A/B.

~$2,510/month (QMB), ~$3,380/month (SLMB), ~$3,598/month (QI)—individual.

$9,430 (individual), $14,130 (couple).

Includes Extra Help for Part D; no waitlist.

Low-Income Home Energy Assistance Program (LIHEAP)

Texas Comprehensive Energy Assistance Program (CEAP)

Age 60+ prioritized, TX resident, low-income.

~$3,970/month (185% FPL).

Not assessed.

Priority for elderly/disabled; covers gas, electric, propane.

Family Caregiver Support Program (FCSP)

Texas Family Caregiver Support Program

Caregivers of 60+ needing care or 55+ caregivers of others; TX resident; 2+ ADLs.

No strict cap; prioritizes low-income (~$24,980/year).

Not assessed.

High rural demand; includes grandparent caregivers.

Senior Community Service Employment Program (SCSEP)

Texas SCSEP

Age 55+, unemployed, low-income, TX resident.

~$1,983/month (125% FPL).

Not specified.

Priority for veterans, rural residents; AARP partnership.

VA Aid and Attendance (A&A) and Housebound Benefits

Texas VA Aid and Attendance/Housebound

Age 65+ or disabled veteran/spouse, TX resident, wartime service, ADL help (A&A) or homebound.

Net income < ~$1,984/month (veteran with dependent, A&A); pension offsets income.

~$155,356 (net worth).

High veteran population; supports rural/urban needs.

Property Tax Exemption for Seniors

Texas Senior Property Tax Exemption

Age 65+, TX resident, homeowner (homestead).

None; tax-based eligibility.

Not assessed.

$25,000+ exemption; optional freeze in some counties; saves ~$500-$1,000/year.

Senior Farmers’ Market Nutrition Program (SFMNP)

Texas SFMNP

Age 60+, TX resident, low-income.

~$2,322/month (185% FPL).

Not assessed.

Vouchers (~$50/season); serves ~20,000 via 28 AAAs.

Tour Icon
Planning a tour? Check our touring checklist.
Chat Icon
Thinking of living here? We can help you speak to a current resident