Explore Open Rooms

1 Contact details
2 What type of senior care service are you looking for?
3 What budget do you have in mind for senior care?
4 How soon do you need to find care?
5 Additional details

Thank you for your interest!

Our team will be in touch shortly to help with next steps.

Nursing Home

The Villa at Stamford

Nursing Home

The Villa at Stamford

88 Rock Rimmon Rd, Stamford, CT 06903 View map
Overview of The Villa at Stamford

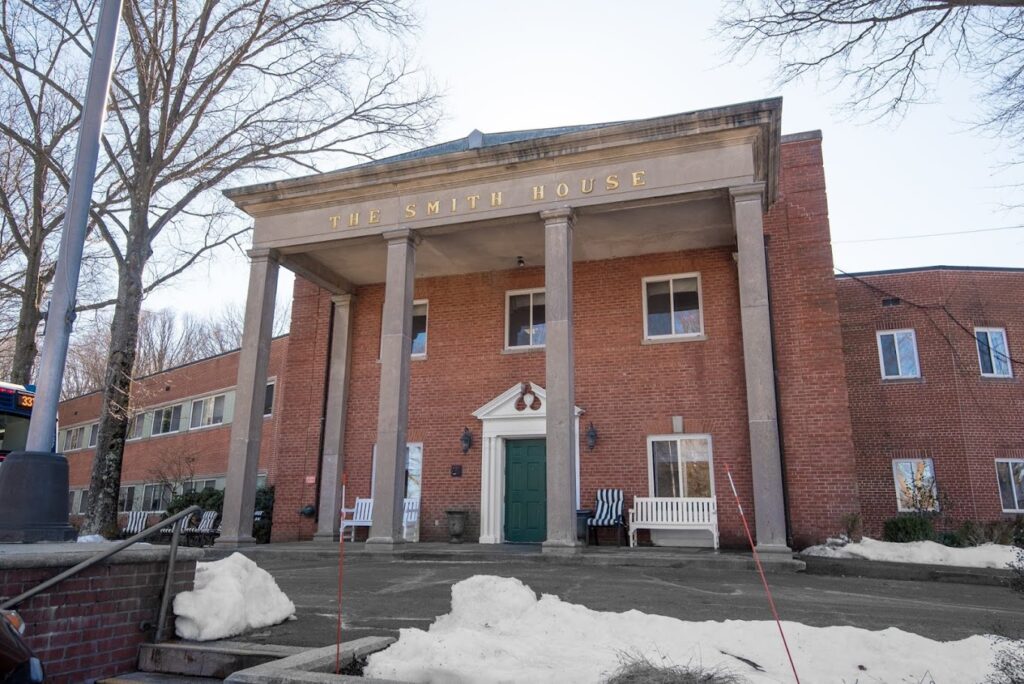
The Villa at Stamford delivers an outstanding level of nursing care; they strive in promoting independence and individuality for their seniors. The nursing home is a modest environment that provides short-term rehabilitation services. They are considered to be the premier nursing home with the highest ratings. It is through the strong will of commitment to providing comfort and relaxation for its seniors that has garnered its well-respected reputation. The Villa at Stamford is where goals are met and purpose is achieved.
The centers of excellence are found in memory care services, short-term rehabilitation, long-term care, and specialty skilled nursing (IV therapy, wound care, and post-surgical orthopedic care).

Quality ratings

Measured by Centers for Medicare & Medicaid Services (CMS)

Overall rating Info The Overall CMS Rating combines results from health inspections, staffing levels and quality measures. Health inspections carry the most weight. Staffing and quality scores can increase or decrease the final rating based on performance compared to state and national standards.
5/5
Connecticut average: 3.4/5
Health Inspection Info Based on the results of the facility's three most recent standard inspections and any complaint investigations. CMS reviews the number, scope, and severity of deficiencies, with more recent findings weighted more heavily.
4/5
Connecticut average: 3.1/5
Staffing Info Measures average nursing staff hours per resident per day, including Registered Nurses (RNs) and total nursing staff. Ratings are adjusted based on the level of care residents require and are compared to state and national benchmarks.
2/5
Connecticut average: 3.4/5
Quality Measures Info Based on clinical and physical health indicators reported to CMS, such as hospital readmissions, falls, pressure ulcers, and improvements in mobility. These measures reflect how well residents' health needs are being managed.
5/5
Connecticut average: 3.6/5

Nursing care per resident

Info This shows how many total hours of nursing staff time are available per resident each day. Higher numbers usually mean more staff support.
3h 11m per day

This home provides 22% less nursing time per resident than the Connecticut average.

Connecticut average: 4h 4m per day

Staffing hours breakdown

Info Hours of care per resident per day, broken down by staff type. Data from CMS Medicare.
Staff type Facility State avg National avg
Registered Nurse (RN) Info Registered nurse hours per resident per day. 27m per day 42m per day 41m per day
Nurse Aide Info Nurse aide hours per resident per day. 2h 15m per day 2h 17m per day 2h 21m per day
Total Nursing (Weekend) Info Total number of nurse staff hours per resident per day on weekends. 3h 24m per day 3h 25m per day 3h 26m per day
Physical Therapist Info Physical therapist staff hours per resident per day. 7m per day 5m per day 4m per day
RN (Weekend) Info Registered nurse hours per resident per day on weekends. 12m per day 28m per day 29m per day

Capacity and availability

Medium-capacity home

Offers a balance of services and community atmosphere.

Total beds 128

This home usually has limited availability

Occupancy is moderate, suggesting balanced demand.

Similar demand to the Connecticut average
Occupancy rate 93%
Residents per day (avg) 119
Occupancy rate
93%
Residents per day (avg)
119

Who this home usually serves

TYPE OF STAY

Mostly short-term rehab stays

Most residents typically stay for a few weeks or months before returning home or moving on.

Might be optimal for
Short stays Recovery Medicare-covered care

Breakdown by payment type

Medicare

54% of new residents, usually for short-term rehab.

Typical stay 1 - 2 months

Private pay

29% of new residents, often for short stays.

Typical stay 1 - 2 months

Medicaid

17% of new residents, often for long-term daily care.

Typical stay 1 - 2 years

Finances and operations

Privately-owned community
Home revenue
$20.0M
Profit
$652.2K
Privately-owned community
Home revenue
$19,960,593.00
Profit
$652,176.00
Payroll costs Info The portion of the home's budget spent on staff, including nurses, caregivers, and other employees who support care and operations.
$7.7M
38.7% of revenue
Other operating costs Info All remaining costs needed to run the home, such as food, utilities, building maintenance, supplies and administrative expenses.
$11.6M
Total costs $19.3M
Years in operation
10 years in operation
A community with a solid operating history and experience delivering ongoing care.
Walk Score
Walk Score: 7 / 100
Car-dependent. Most errands require a car, with limited nearby walkable options.

Services

Alzheimers
Cardiac; Orthopedic And Stroke
Dementia Care
Intergenerational Recreation
Iv Therapy
Pain Management
Pulmonary And Vascular Management
Pulmonary Rehabilitation

About this community

Occupancy

Occupancy rate
93%
In line with Connecticut average
Occupied beds
119 / 128
Average residents 102 per day

License details

Facility type
Chronic & Convalescent Nursing Home
Status Active
Issuance February 9, 2016
Expiration June 30, 2026

Additional licensing details

License number: 2432

Room costs

Private Room (68 rooms) $313 per day
Semi-Private Room (68 rooms) $288 per day

Staffing

Key information about the people who lead and staff this community.

Languages Spoken

Creole Czech French Haitian Hebrew Jamaican Slovak Spanish Ukrainian

Staff Composition (State Data)

Admin
3 FTE
Registered Nurse
12 FTE
Licensed Practical Nurse
15 FTE
Nursing Assistant
49 FTE
Recreation
3 FTE
Social Services
3 FTE
Physical Therapy
6 FTE
Occupational Therapy
4 FTE
Speech Therapy
1 FTE
Dietary
9 FTE
Other Staff
30 FTE

Care Services

Nursing Services
Rehabilitation Services
Respite Care
Memory Care
Skilled Nursing
Licensed Nurses/CNAs
24-Hour Staffing
Short-Term Rehab

All Levels of Care

Short Term Rehab
Specialty Nursing Care
Long Term Care
Memory Care

Additional Policies & Features

Religious Services: Catholic, Congregational, Jewish, Protestant

Amenities & Lifestyle

Private Suites
outdoor lounges
meditation room
Zen Garden
music room
outdoor walking trails

Programs & Activities

Specific Programs
Short Term Rehab, Specialty Nursing Care, Pulmonary Rehabilitation, Long Term Care, Memory Care Unit, Admissions, Volunteer, Careers

Types of Care at The Villa at Stamford

Nursing Home
Contact The Villa at Stamford

Inspection History

In Connecticut, the Department of Public Health, Facility Licensing and Investigations Section conducts mandatory inspections and unannounced surveys to monitor the quality of care in long-term facilities.

14 visits/inspections

11 routine inspections

Breakdown by inspection type
  • 1 renewal/recertification inspection
  • 2 licensing inspections
  • 12 plans of correction
  • 5 statements of deficiencies

Results

14 with issues

3 without issues

Connecticut average: 13 visits/inspections

Latest inspection

Date:August 27, 2025

Inspection history

01-28-2025 Inspection Report
02-02-2022 Inspection Report
02-08-2024 Inspection Report
02-08-2024 Plan of Correction
03-23-2021 Plan of Correction
04-14-2021 Plan of Correction
04-14-2021 Statement of Deficiencies
04-23-2021 Plan of Correction
04-23-2021 Statement of Deficiencies
04-27-2022 Inspection Report
05-07-2024 Inspection Report
06-09-2022 Plan of Correction
06-22-2020 Statement of Deficiencies
06-23-2020 Statement of Deficiencies
06-23-2025 Inspection Report
06-25-2020 Statement of Deficiencies
07-31-2024 Inspection Report
08-13-2019 Inspection Report
08-27-2020 Plan of Correction
08-27-2025 Inspection Report
09-14-2022 Inspection Report
09-28-2020 Plan of Correction
09-29-2020 Plan of Correction
10-07-2020 Plan of Correction
10-21-2024 Inspection Report
12-09-2024 Inspection Report
12-09-2024 Plan of Correction

27 deficiencies

Deficiencies indicate regulatory issues. A higher number implies the facility had several areas requiring improvement.

Inspection Report Summary for The Villa at Stamford

The most recent inspection on August 27, 2025, found no deficiencies during a desk audit verifying compliance. Earlier inspections showed a pattern of some deficiencies primarily related to medical record documentation, resident safety, and infection control practices, with several issues corrected in follow-up reviews. Complaint investigations were mostly unsubstantiated, though a few substantiated cases involved verbal abuse and lapses in resident care, including one substantiated abuse incident in 2019 that led to staff termination. No fines, immediate jeopardy findings, or license actions were listed in the available reports. The facility’s record shows improvement over time, with recent inspections indicating compliance and resolution of prior deficiencies.

Health Inspection History

Inspections
Total health inspections 6

Connecticut average 5.7


Last Health inspection on Jun 2025

Total health citations 20

Connecticut average 32

Citations per inspection
3.33

Connecticut average 5.82


Health citations are formal notices following inspections when they fail to comply with safety and care standards.

17 of 20 citations resulted from standard inspections; and 3 of 20 resulted from complaint investigations.

Breakdown of citation severity (last 3 years)
Critical Health citations More info 0
100% better than Connecticut average

Connecticut average: 0.3


Serious Health citations More info 1
43% worse than Connecticut average

Connecticut average: 0.7

0 critical citations More info Connecticut average: 0.3

1 serious citation More info Connecticut average: 0.7

18 moderate citations More info Connecticut average: 28.8

1 minor citation More info Connecticut average: 2.3
Citations history (last 3 years)
Care Planning moderate citation Info Issues related to creating and updating personalized care plans for residents based on their needs and conditions. Jun 23, 2025
Corrected

Infection Control moderate citation Info Issues related to preventing and controlling infections, including hygiene practices and safety protocols. Jul 30, 2024
Corrected

Nursing Services minor citation Info Issues related to the availability and quality of nursing staff and the care they provide. Jul 30, 2024
Corrected

Quality of Care moderate citation Info Issues related to how well residents receive appropriate treatment and support for their medical and daily care needs. Jul 30, 2024
Corrected

Compare Nursing Homes around Stamford The information below is reported by the Connecticut Department of Public Health, Facility Licensing and Investigations Section.

2 facilities compared · CMS & CT Dept. of Health data · Updated Mar 2026

The Villa at Stamford
NH

Nursing Home Licensed facility providing 24/7 skilled nursing care for residents with complex, ongoing medical needs. Staffed by RNs, LPNs, and CNAs. Inspected and star-rated annually by CMS. Accepts Medicare (short-term rehab) and Medicaid (long-term care).

Stamford (North Stamford)
128
93.3%
+11%
3.18
+20%
-20%
1
20
1
119
7
Smith House Ventures Llc
$19,7M
$7,7M
39.2%
75153
Sunshine Senior Residence
-
NH

Nursing Home Licensed facility providing 24/7 skilled nursing care for residents with complex, ongoing medical needs. Staffed by RNs, LPNs, and CNAs. Inspected and star-rated annually by CMS. Accepts Medicare (short-term rehab) and Medicaid (long-term care).

Stamford (Ridgeway-Bulls Head)
-
-
-
-
-
-
-
-
-
0
0
0
-
85
-
-
-
-
-

Places of interest near The Villa at Stamford

Address 6.1 miles from city center — 5.9 miles to nearest hospital (Stamford Hospital)

Address 88 Rock Rimmon Rd, Stamford, CT 06903

Calculate Travel Distance to The Villa at Stamford

Add your location

Address

Staffing Data (Q2 2025)

This data corresponds to Q2 2025 and is based on CMS Payroll-Based Journal.

Total staff 288
Employees 100
Contractors 188
Staff to resident ratio 2.55:1
36% better than Connecticut average

Connecticut average ratio: 1.88:1

Avg staff/day 69
Average shift 7.8 hours
0% compared with Connecticut average

Connecticut average: 7.5 hours

Total staff hours (quarter) 48,849
Nursing staff breakdown
Registered Nurse

Manages medical care and health needs.

Total count 38
Average shift length Info Average shift length. Calculated as total hours divided by days worked and average staff per day. 8.4 hours

This role is partially covered by contractors.

Licensed Practical Nurse

Assists with medical care and medications.

Total count 73
Average shift length Info Average shift length. Calculated as total hours divided by days worked and average staff per day. 7.9 hours

This role is partially covered by contractors.

Certified Nursing Assistant

Helps with daily care and mobility.

Total count 150
Average shift length Info Average shift length. Calculated as total hours divided by days worked and average staff per day. 7.6 hours

This role is partially covered by contractors.

Contractor staffing

Total hours from contractors

22.8%

11,159 contractor hours this quarter

Certified Nursing Assistant: 109 Licensed Practical Nurse: 52 Registered Nurse: 25 Medical Director: 1 Qualified Social Worker: 1
Staff by category
Certified Nursing Assistant4110915024,12291100%7.6
Licensed Practical Nurse21527311,23991100%7.9
Registered Nurse1325384,53191100%8.4
Physical Therapy Assistant4041,3987582%7.7
Respiratory Therapy Technician3031,3327279%7.9
Physical Therapy Aide3039567684%7.9
Mental Health Service Worker2028706470%6.9
Other Dietary Services Staff4048016470%6.8
Qualified Social Worker1126066774%6.7
Dietitian2025386369%7.7
Administrator1014886571%7.5
Nurse Practitioner1014886571%7.5
RN Director of Nursing1014756167%7.8
Qualified Activities Professional1014575965%7.7
Occupational Therapy Aide1014085459%7.6
Speech Language Pathologist1011371719%8
Medical Director011422%2
150 Certified Nursing Assistant
% of Days 100%
73 Licensed Practical Nurse
% of Days 100%
38 Registered Nurse
% of Days 100%
4 Physical Therapy Assistant
% of Days 82%
3 Respiratory Therapy Technician
% of Days 79%
3 Physical Therapy Aide
% of Days 84%
2 Mental Health Service Worker
% of Days 70%
4 Other Dietary Services Staff
% of Days 70%
2 Qualified Social Worker
% of Days 74%
2 Dietitian
% of Days 69%
1 Administrator
% of Days 71%
1 Nurse Practitioner
% of Days 71%
1 RN Director of Nursing
% of Days 67%
1 Qualified Activities Professional
% of Days 65%
1 Occupational Therapy Aide
% of Days 59%
1 Speech Language Pathologist
% of Days 19%
1 Medical Director
% of Days 2%

Facility Characteristics

Source: CMS Long-Term Care Facility Characteristics (Data as of Jan 2026)

Total census
113 residents
Residents by payment source
Medicare
26 residents (23%)
Medicaid
65 residents (57.5%)
Private pay or other
22 residents (19.5%)
Programs & Services
Residents' Group

Residents meet regularly to discuss policies, care quality, and activities

Family Member Group

Family members meet regularly to discuss policies, care quality, and activities

Active Family Council

Organized group of family members that meets regularly to discuss facility policies, resident care, and activities.

Active Resident Council

Organized group of residents that meets regularly to discuss facility policies, quality of life, and activities.

Quality of care over time

These measures show how residents usually do over time at this home, based on health outcomes and preventive care.

High-risk clinical events score Info A composite score based on pressure ulcers, falls with injury, weight loss, walking ability decline, and activities of daily living decline. 6.2
41% better than Connecticut average

Connecticut average: 10.4

Functional decline score Info A composite score based on activities of daily living decline, walking ability decline, and incontinence. 9.8
54% better than Connecticut average

Connecticut average: 21.1

Long-stay resident measures
Significantly above average Connecticut avg: 3.2 Info CMS star rating based on long-stay quality measure performance. 5 stars = significantly above average, 1 star = significantly below average.
Need for Help with Daily Activities Increased Info Percent of long-stay residents whose need for help with daily activities has increased 5.0%
74% better than Connecticut average

Connecticut average: 18.9%

Walking Ability Worsened Info Percent of long-stay residents whose ability to move independently worsened 4.3%
78% better than Connecticut average

Connecticut average: 19.2%

Low Risk Residents with Bowel/Bladder Incontinence Info Percent of low risk long-stay residents who lose control of their bowels or bladder 20.1%
19% better than Connecticut average

Connecticut average: 24.9%

Falls with Major Injury Info Percent of long-stay residents experiencing one or more falls with major injury 2.9%
16% better than Connecticut average

Connecticut average: 3.5%

High Risk Residents with Pressure Ulcers Info Percent of long-stay high risk residents with pressure ulcers 7.6%
67% worse than Connecticut average

Connecticut average: 4.6%

Urinary Tract Infection Info Percent of long-stay residents with a urinary tract infection 0.0%
100% better than Connecticut average

Connecticut average: 1.7%

Lost Too Much Weight Info Percent of long-stay residents who lose too much weight 11.0%
75% worse than Connecticut average

Connecticut average: 6.3%

Depressive Symptoms Info Percent of long-stay residents who have depressive symptoms 72.4%
378% worse than Connecticut average

Connecticut average: 15.2%

Antipsychotic Use Info Percent of long-stay residents who received an antipsychotic medication 8.2%
52% better than Connecticut average

Connecticut average: 17.2%

Pneumococcal Vaccine Info Percent of long-stay residents assessed and appropriately given the pneumococcal vaccine 99.5%
14% better than Connecticut average

Connecticut average: 87.5%

Influenza Vaccine Info Percent of long-stay residents assessed and appropriately given the seasonal influenza vaccine 100.0%
7% better than Connecticut average

Connecticut average: 93.5%

Hospitalizations per 1,000 days Info Number of hospitalizations per 1,000 long-stay resident days. 2.54
21% worse than Connecticut average

Connecticut average: 2.10

ED visits per 1,000 days Info Number of outpatient emergency department visits per 1,000 long-stay resident days. 1.33
13% better than Connecticut average

Connecticut average: 1.53

Short-stay resident measures
Significantly above average Connecticut avg: 3.3 Info CMS star rating based on short-stay quality measure performance. 5 stars = much above average, 1 star = much below average.
Pneumococcal Vaccine Info Percent of short-stay residents assessed and appropriately given the pneumococcal vaccine 89.9%
28% better than Connecticut average

Connecticut average: 70.1%

Antipsychotic medication increase Info Percent of short-stay residents who newly received an antipsychotic medication 2.2%
45% worse than Connecticut average

Connecticut average: 1.5%

Influenza Vaccine Info Percent of short-stay residents assessed and appropriately given the seasonal influenza vaccine 90.8%
30% better than Connecticut average

Connecticut average: 69.8%

Re-hospitalized after SNF stay Info Percentage of short-stay residents who were re-hospitalized after their nursing home admission. 19.9%
20% better than Connecticut average

Connecticut average: 25.0%

Emergency department visits Info Percentage of short-stay residents who had an outpatient emergency department visit. 10.8%
In line with Connecticut average

Connecticut average: 11.1%

Falls with major injury Info Percentage of SNF residents who experience falls with major injury during their stay. 1.2%
49% worse than Connecticut average

Connecticut average: 0.8%

Ability to care for self at discharge Info Percentage of residents at or above expected ability to care for themselves at discharge. 63.6%
19% better than Connecticut average

Connecticut average: 53.7%

Successful return to home or community Info Rate of successful return to home or community from a skilled nursing facility. 59.6%
18% better than Connecticut average

Connecticut average: 50.6%

Guides for Better Senior Living

Care Cost Calculator: See Prices in Your Area

Nursing Home Data Explorer

Don’t Wait Too Long: 7 Red Flag Signs Your Parent Needs Assisted Living Now

The True Cost of Assisted Living in 2025 – And How Families Are Paying For It

Understanding Senior Living Costs: Pricing Models, Discounts & Financial Assistance

Financial Aid for Connecticut Seniors

Get financial aid guidance

Connecticut Home Care Program for Elders

CHCPE

Age 65+, Connecticut resident, at risk of nursing home placement.

State-funded: ~$1,600/month; Medicaid: ~$2,829/month (300% FBR).

$1,600 (state), $2,000 (Medicaid, individual).

Two tiers (state and Medicaid); waitlists possible.

Statewide Respite Care Program

CT Respite Care

Caregiver of senior with dementia, Connecticut resident.

~$2,500/month (individual, varies).

$40,000 (individual).

Limited to dementia caregivers; capped funding.

Congregate Housing Services Program (CHSP)

Connecticut Congregate Housing Services Program

Age 62+, Connecticut resident, frail but not needing 24/7 care, resides in CHSP-eligible housing.

~$41,000/year (individual, adjusted annually).

Not specified; focus is income-based.

Limited to 14 state-subsidized sites; participants pay 10% of service costs.

Medicare Savings Program (MSP)

Connecticut Medicare Savings Program

Age 65+ or disabled, Connecticut resident, enrolled in Medicare Part A/B.

~$2,510/month (individual, QMB); ~$3,380/month (SLMB); ~$3,598/month (ALMB)—adjusted annually.

None since 2023 policy change.

Three tiers (Qualified Medicare Beneficiary, Specified Low-Income, Additional Low-Income); no asset test.

Senior Community Service Employment Program (SCSEP)

Connecticut SCSEP (federally funded, state-administered)

Age 55+, unemployed, low-income, Connecticut resident.

~$1,983/month (125% FPL, individual).

Not specified; income-focused.

Priority for veterans, rural residents; limited slots (~500/year).

Tour Icon
Planning a tour? Check our touring checklist.
Chat Icon
Thinking of living here? We can help you speak to a current resident