Explore Open Rooms

1 Contact details
2 What type of senior care service are you looking for?
3 What budget do you have in mind for senior care?
4 How soon do you need to find care?
5 Additional details

Thank you for your interest!

Our team will be in touch shortly to help with next steps.

Assisted Living in Virginia

CMS overall rating Info The Overall CMS Rating combines results from health inspections, staffing levels and quality measures. Health inspections carry the most weight. Staffing and quality scores can increase or decrease the final rating based on performance compared to state and national standards.

The Village at Orchard Ridge

400 Clocktower Ridge Drive, WINCHESTER, VA 22603 View map
Overview of The Village at Orchard Ridge
The Village at Orchard Ridge is a Continuing Care Retirement Community located in Winchester, Virginia. It offers a vibrant lifestyle with a range of amenities and services including independent living, assisted living, memory care, and skilled nursing. Residents can enjoy a variety of activities and dining options in a welcoming community.
(540) 431-2800

Quality ratings

Measured by Centers for Medicare & Medicaid Services (CMS)

Overall rating Info The Overall CMS Rating combines results from health inspections, staffing levels and quality measures. Health inspections carry the most weight. Staffing and quality scores can increase or decrease the final rating based on performance compared to state and national standards.
5/5
Virginia average: 3.8/5
Health Inspection Info Based on the results of the facility's three most recent standard inspections and any complaint investigations. CMS reviews the number, scope, and severity of deficiencies, with more recent findings weighted more heavily.
4/5
Virginia average: 3.4/5
Staffing Info Measures average nursing staff hours per resident per day, including Registered Nurses (RNs) and total nursing staff. Ratings are adjusted based on the level of care residents require and are compared to state and national benchmarks.
5/5
Virginia average: 3.6/5
Quality Measures Info Based on clinical and physical health indicators reported to CMS, such as hospital readmissions, falls, pressure ulcers, and improvements in mobility. These measures reflect how well residents' health needs are being managed.
4/5
Virginia average: 4.0/5

Nursing care per resident

Info This shows how many total hours of nursing staff time are available per resident each day. Higher numbers usually mean more staff support.
4h 53m per day

This home provides 2% more nursing time per resident than the Virginia average.

Virginia average: 4h 47m per day

Capacity and availability

Smaller home

May offer a more intimate, personalized care environment.

Total beds 47

This home usually has availability

Lower occupancy suggests more openings may be available.

Lower demand than the Virginia average
Occupancy rate 78.7%
Residents per day 37
Occupancy rate
78.7%
Residents per day
37

Who this home usually serves

TYPE OF STAY

Mostly short-term rehab stays

Most residents typically stay for a few weeks or months before returning home or moving on.

Might be optimal for
Short stays Recovery Medicare-covered care

Breakdown by payment type

Medicare

79% of new residents, usually for short-term rehab.

Typical stay 25 days

Private pay

21% of new residents, often for short stays.

Typical stay 4 - 5 months

Finances and operations

Voluntary non-profit community
Home revenue
$26.8M
Operating deficit
-$5.1M
Voluntary non-profit community
Home revenue
$26,831,106.00
Operating deficit
$-5,053,491.00
Payroll costs Info The portion of the home's budget spent on staff, including nurses, caregivers, and other employees who support care and operations.
$6.5M
24.2% of revenue
Other operating costs Info All remaining costs needed to run the home, such as food, utilities, building maintenance, supplies and administrative expenses.
$25.4M
Total costs $31.9M
Bed community size
47-bed community
A moderately sized community that may balance personal attention with shared amenities and social activities.

About this community

Occupancy

Occupancy rate
79%
In line with Virginia average
Occupied beds
37 / 47
Average residents 98 per day

License Details

Facility TypeAssisted Living Facility
StatusActive

Additional Licensing Details

CMS Certification Number495415

Ownership & Operating Entity

The Village at Orchard Ridge is administrated by Melissa Sellers.

Therapy & Rehabilitation

2 services
Rehabilitation Services
Respite Care

Staffing & Medical

3 services
Nursing Services
Skilled Nursing
24-Hour Staffing

Dining & Nutrition

Food DescriptionThe dining experience at The Village at Orchard Ridge combines a delicious variety of meals with warm and inviting atmospheres.
Contact The Village at Orchard Ridge

Inspection History

In Virginia, the Department of Social Services (for assisted living facilities) and the Department of Health (for nursing homes) perform the inspections required to maintain state and federal licensing.

16 inspections

1 inspection related to complaints

8 inspections with violations (50%)

Virginia average: 14 inspections

Virginia average: 64.3% of inspections with violations

Latest inspection

Date November 6, 2024
Renewal

16 total citations

Citations indicate regulatory violations. A higher number implies the facility had several areas requiring improvement.

Virginia average: 14 citations

16 deficiencies

Deficiencies indicate regulatory issues. A higher number implies the facility had several areas requiring improvement.

Virginia average: 32 deficiencies

Health Inspection History

Inspections
Total health inspections 1

State average 4.2


Last Health inspection on Mar 2024

Total health citations 4

State average 38.4

Citations per inspection
4

State average 8.93


Health citations are formal notices following inspections when they fail to comply with safety and care standards.

All 4 citations resulted from standard inspections.

Breakdown of citation severity (last 3 years)
Critical Health citations More info 0
100% better than State average

State average: 0.4


Serious Health citations More info 0
100% better than State average

State average: 1

0 critical citations More info State average: 0.4

0 serious citations More info State average: 1

4 moderate citations More info State average: 36.3

0 minor citations More info State average: 0.8
Citations history (last 3 years)
Infection Control moderate citation Info Issues related to preventing and controlling infections, including hygiene practices and safety protocols. Mar 06, 2024
Corrected

Quality of Care moderate citation Info Issues related to how well residents receive appropriate treatment and support for their medical and daily care needs. Mar 06, 2024
Corrected

Care Planning moderate citation Info Issues related to creating and updating personalized care plans for residents based on their needs and conditions. Mar 06, 2024
Corrected

Care Planning moderate citation Info Issues related to creating and updating personalized care plans for residents based on their needs and conditions. Mar 06, 2024
Corrected

Compare Assisted Living around Virginia The information below is reported by the Virginia Department of Social Services and Department of Health.

Filter by care type
Brookdale Staunton
AL

Assisted Living A licensed, long-term care setting for seniors or individuals with disabilities who need help with daily activities — like bathing, dressing, and medication management — but not 24-hour skilled nursing. Offers housing, meals, and around-the-clock support while aiming to maximize resident independence.

MC

Memory Care Secured, specialized care for people living with Alzheimer's or dementia. Staff trained in cognitive impairment, with higher staff-to-resident ratios and an environment designed to reduce confusion and wandering risk.

Staunton
144
Yes
16
-
April Sprouse
66.7%
A+
8
62.5%
8
Sancerre Atlee Station
AL

Assisted Living A licensed, long-term care setting for seniors or individuals with disabilities who need help with daily activities — like bathing, dressing, and medication management — but not 24-hour skilled nursing. Offers housing, meals, and around-the-clock support while aiming to maximize resident independence.

IL

Independent Living Lifestyle-focused communities for older adults offering dining, activities, and transportation with minimal personal care. Best for active, independent seniors who want community without medical support.

MC

Memory Care Secured, specialized care for people living with Alzheimer's or dementia. Staff trained in cognitive impairment, with higher staff-to-resident ratios and an environment designed to reduce confusion and wandering risk.

Mechanicsville
120
Yes
30
Studio / 1 Bed / 2 Bed
Lauren Friedman
17.5%
A
18
38.9%
18
Brookdale Harrisonburg
AL

Assisted Living A licensed, long-term care setting for seniors or individuals with disabilities who need help with daily activities — like bathing, dressing, and medication management — but not 24-hour skilled nursing. Offers housing, meals, and around-the-clock support while aiming to maximize resident independence.

MC

Memory Care Secured, specialized care for people living with Alzheimer's or dementia. Staff trained in cognitive impairment, with higher staff-to-resident ratios and an environment designed to reduce confusion and wandering risk.

Harrisonburg
114
No
62
-
Ms. Jennifer Mcnamara
43.0%
A+
10
70%
10
Brookdale Danville Piedmont
AL

Assisted Living A licensed, long-term care setting for seniors or individuals with disabilities who need help with daily activities — like bathing, dressing, and medication management — but not 24-hour skilled nursing. Offers housing, meals, and around-the-clock support while aiming to maximize resident independence.

Danville
99
No
45
-
Carole Maxwell
45.5%
A+
6
100%
6
The Village at Orchard Ridge
NH

Nursing Home Licensed facility providing 24/7 skilled nursing care for residents with complex, ongoing medical needs. Staffed by RNs, LPNs, and CNAs. Inspected and star-rated annually by CMS. Accepts Medicare (short-term rehab) and Medicaid (long-term care).

AL

Assisted Living A licensed, long-term care setting for seniors or individuals with disabilities who need help with daily activities — like bathing, dressing, and medication management — but not 24-hour skilled nursing. Offers housing, meals, and around-the-clock support while aiming to maximize resident independence.

WINCHESTER
20
No
-
-
Melissa Sellers
78.7%
-
16
50%
16

Living Spaces & Floor Plans

York Floor Plan
Download PDF
Wellington Floor Plan
Download PDF
Rome Floor Plan
Download PDF
Melrose Floor Plan
Download PDF
McIntosh II Floor Plan
Download PDF
Geneva II Floor Plan
Download PDF
Geneva Floor Plan
Download PDF
Gala Floor Plan
Download PDF
Empire Floor Plan
Download PDF
Cortland Floor Plan
Download PDF
Cameo Floor Plan
Download PDF
Braeburn II Floor Plan
Download PDF
Braeburn Floor Plan
Download PDF
Beacon Floor Plan
Download PDF
Sycamore Floor Plan
Download PDF

Places of interest near The Village at Orchard Ridge

Address 0.0 miles from city center
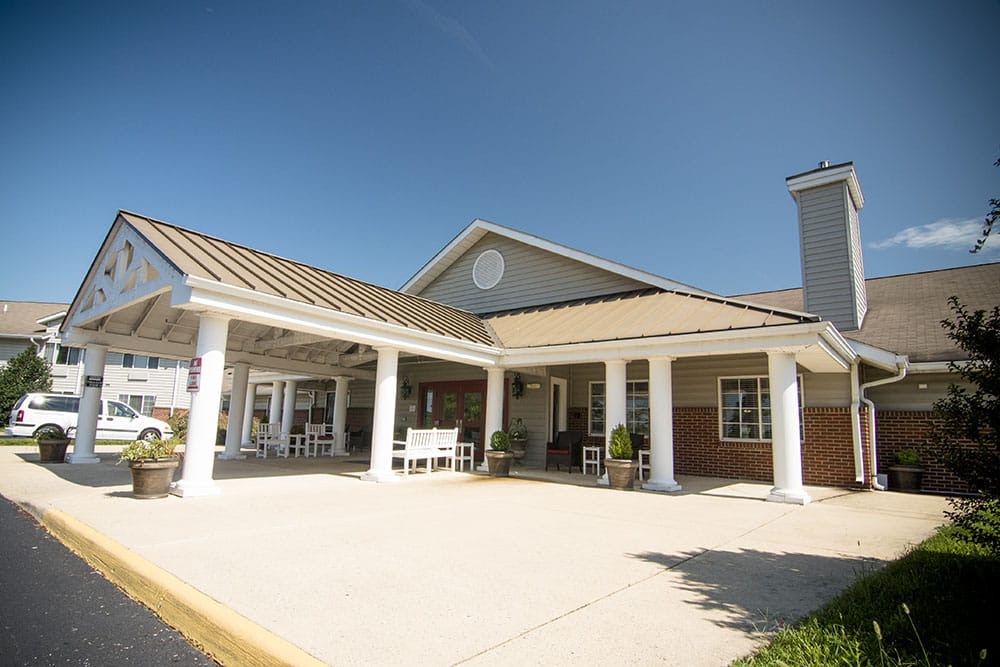
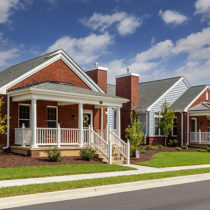
Address 400 Clocktower Ridge Drive, WINCHESTER, VA 22603

Calculate Travel Distance to The Village at Orchard Ridge

Add your location

Address

Staffing Data (Q2 2025)

This data corresponds to Q2 2025 and is based on CMS Payroll-Based Journal.

Total staff 75
Employees 68
Contractors 7
Staff to resident ratio 3.75:1
125% better than Virginia average

Virginia average ratio: 1.67:1

Avg staff/day 19
Average shift 5.9 hours
26% worse than Virginia average

Virginia average: 8 hours

Total staff hours (quarter) 10,138
Nursing staff breakdown
Registered Nurse

Manages medical care and health needs.

Total count 8
Average shift length Info Average shift length. Calculated as total hours divided by days worked and average staff per day. 8.8 hours

No contractors work on this role.

Licensed Practical Nurse

Assists with medical care and medications.

Total count 15
Average shift length Info Average shift length. Calculated as total hours divided by days worked and average staff per day. 9.2 hours

This role is partially covered by contractors.

Certified Nursing Assistant

Helps with daily care and mobility.

Total count 28
Average shift length Info Average shift length. Calculated as total hours divided by days worked and average staff per day. 8.2 hours

This role is partially covered by contractors.

Contractor staffing

Total hours from contractors

3.6%

368 contractor hours this quarter

Licensed Practical Nurse: 2 Certified Nursing Assistant: 1 Occupational Therapy Aide: 1 Medical Director: 1 Clinical Nurse Specialist: 1 Occupational Therapy Assistant: 1
Staff by category
Certified Nursing Assistant271284,32991100%8.2
Registered Nurse8081,80391100%8.8
Licensed Practical Nurse132151,54991100%9.2
Nurse Practitioner1014896976%7.1
Other Dietary Services Staff3034307380%2.4
Mental Health Service Worker1013676268%5.9
Physical Therapy Aide3033506673%5.1
Speech Language Pathologist6063456774%1.9
Administrator1011836268%3
Occupational Therapy Aide0111045257%2
Medical Director011542831%1.9
Clinical Nurse Specialist0114867%8
Respiratory Therapy Technician202425257%0.8
Physical Therapy Assistant101226470%0.3
Occupational Therapy Assistant0111589%1.8
Qualified Social Worker202101820%0.6
28 Certified Nursing Assistant
% of Days 100%
8 Registered Nurse
% of Days 100%
15 Licensed Practical Nurse
% of Days 100%
1 Nurse Practitioner
% of Days 76%
3 Other Dietary Services Staff
% of Days 80%
1 Mental Health Service Worker
% of Days 68%
3 Physical Therapy Aide
% of Days 73%
6 Speech Language Pathologist
% of Days 74%
1 Administrator
% of Days 68%
1 Occupational Therapy Aide
% of Days 57%
1 Medical Director
% of Days 31%
1 Clinical Nurse Specialist
% of Days 7%
2 Respiratory Therapy Technician
% of Days 57%
1 Physical Therapy Assistant
% of Days 70%
1 Occupational Therapy Assistant
% of Days 9%
2 Qualified Social Worker
% of Days 20%

Facility Characteristics

Source: CMS Long-Term Care Facility Characteristics (Data as of Jan 2026)

Total census
20 residents
Residents by payment source
Medicare
10 residents (50%)
Private pay or other
10 residents (50%)
Programs & Services
Residents' Group

Residents meet regularly to discuss policies, care quality, and activities

Family Member Group

Family members meet regularly to discuss policies, care quality, and activities

Nurse Aide Training

State-approved Nurse Aide Training and Competency Evaluation Program on-site

CCRC

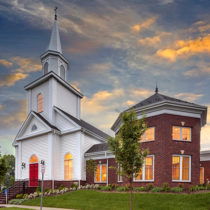
Part of a Continuing Care Retirement Community offering multiple care levels

Active Family Council

Organized group of family members that meets regularly to discuss facility policies, resident care, and activities.

Active Resident Council

Organized group of residents that meets regularly to discuss facility policies, quality of life, and activities.

Quality of care over time

These measures show how residents usually do over time at this home, based on health outcomes and preventive care.

High-risk clinical events score Info A composite score based on pressure ulcers, falls with injury, weight loss, walking ability decline, and activities of daily living decline. 3.5
66% better than Virginia average

Virginia average: 10.1

Functional decline score Info A composite score based on activities of daily living decline, walking ability decline, and incontinence. 31.4
59% worse than Virginia average

Virginia average: 19.7

Long-stay resident measures
Low Risk Residents with Bowel/Bladder Incontinence Info Percent of low risk long-stay residents who lose control of their bowels or bladder 31.4%
39% worse than Virginia average

Virginia average: 22.6%

Falls with Major Injury Info Percent of long-stay residents experiencing one or more falls with major injury 0.0%
100% better than Virginia average

Virginia average: 3.6%

High Risk Residents with Pressure Ulcers Info Percent of long-stay high risk residents with pressure ulcers 6.9%
29% worse than Virginia average

Virginia average: 5.4%

Urinary Tract Infection Info Percent of long-stay residents with a urinary tract infection 2.9%
90% worse than Virginia average

Virginia average: 1.5%

Depressive Symptoms Info Percent of long-stay residents who have depressive symptoms 2.9%
80% better than Virginia average

Virginia average: 14.9%

Antipsychotic Use Info Percent of long-stay residents who received an antipsychotic medication 25.0%
95% worse than Virginia average

Virginia average: 12.9%

Pneumococcal Vaccine Info Percent of long-stay residents assessed and appropriately given the pneumococcal vaccine 91.7%
In line with Virginia average

Virginia average: 91.3%

Short-stay resident measures
Pneumococcal Vaccine Info Percent of short-stay residents assessed and appropriately given the pneumococcal vaccine 64.5%
14% worse than Virginia average

Virginia average: 74.9%

Antipsychotic medication increase Info Percent of short-stay residents who newly received an antipsychotic medication 0.4%
64% better than Virginia average

Virginia average: 1.2%

Influenza Vaccine Info Percent of short-stay residents assessed and appropriately given the seasonal influenza vaccine 56.3%
24% worse than Virginia average

Virginia average: 73.6%

Guides for Better Senior Living

Care Cost Calculator: See Prices in Your Area

Nursing Home Data Explorer

Don’t Wait Too Long: 7 Red Flag Signs Your Parent Needs Assisted Living Now

The True Cost of Assisted Living in 2025 – And How Families Are Paying For It

Understanding Senior Living Costs: Pricing Models, Discounts & Financial Assistance

Financial Aid for Virginia Seniors

Get financial aid guidance

Commonwealth Coordinated Care Plus (CCC Plus)

VA Medicaid CCC Plus

Age 65+ or disabled, Virginia resident, Medicaid-eligible, nursing home-level care need.

~$2,829/month (300% FBR, individual).

$2,000 (individual), $3,000 (couple).

Managed care model; high demand in urban areas.

Virginia Respite Care Grant Program

VA Respite Grant

Caregiver of someone 60+, Virginia resident.

~$2,500/month (individual, varies).

$40,000 (individual).

Limited grants; rural/urban balance.

Adult Services Program

Virginia Adult Services (AS)

Age 60+ (or disabled 18+), VA resident, need significant care (2+ ADLs), not Medicaid-eligible.

Varies by locality; typically < ~$2,510/month (200% FPL).

Limited assets (excludes home, car); varies by DSS.

Serves ~5,000 annually; focuses on low-income independence.

Auxiliary Grant Program

Virginia Auxiliary Grant (AG)

Age 65+ (or disabled 18+), VA resident, living in approved ALF/foster care, SSI-eligible or low-income.

~$1,041/month (individual, SSI level + $20 disregard); higher with medical deductions.

$2,000 (individual).

Serves 4,000; personal needs allowance ($90/month).

Medicare Savings Program (MSP)

Virginia Medicare Savings Program

Age 65+ or disabled, VA resident, Medicare Part A/B.

~$2,510/month (QMB), ~$3,380/month (SLMB), ~$3,598/month (QI)—individual.

$9,430 (individual), $14,130 (couple).

Includes Extra Help for Part D; no waitlist.

Energy Assistance Program (EAP)

Virginia Energy Assistance Program

Age 60+ prioritized, VA resident, low-income household.

~$3,970/month (185% FPL).

Not assessed.

Fuel, Crisis, Cooling components; serves ~100,000 households.

Senior Community Service Employment Program (SCSEP)

Virginia SCSEP

Age 55+, unemployed, low-income, VA resident.

~$1,983/month (125% FPL).

Not specified.

Priority for veterans, rural residents; AARP/Goodwill partnership.

VA Aid and Attendance (A&A) and Housebound Benefits

Virginia VA Aid and Attendance/Housebound

Age 65+ or disabled veteran/spouse, VA resident, wartime service, ADL help (A&A) or homebound.

Net income < ~$1,984/month (veteran with dependent, A&A); pension offsets income.

~$155,356 (net worth).

High veteran population; supports rural/urban needs.

Property Tax Relief for the Elderly and Disabled

Virginia Property Tax Relief

Age 65+ or disabled, VA resident, homeowner, income/asset limits vary by locality.

~$50,000-$75,000/year (household, e.g., Fairfax: $72,000; Richmond: $50,000).

Varies (e.g., Fairfax: $400,000 net worth; Richmond: $100,000).

Offered in 90% of localities; saves ~$500-$2,000/year.

Senior Farmers’ Market Nutrition Program (SFMNP)

Virginia SFMNP

Age 60+, VA resident, low-income.

~$2,322/month (185% FPL).

Not assessed.

Vouchers (~$50-$75/season); serves ~15,000 via AAAs.

Tour Icon
Planning a tour? Check our touring checklist.
Chat Icon
Thinking of living here? We can help you speak to a current resident