


Total staff
155
Employees
153
Contractors
2
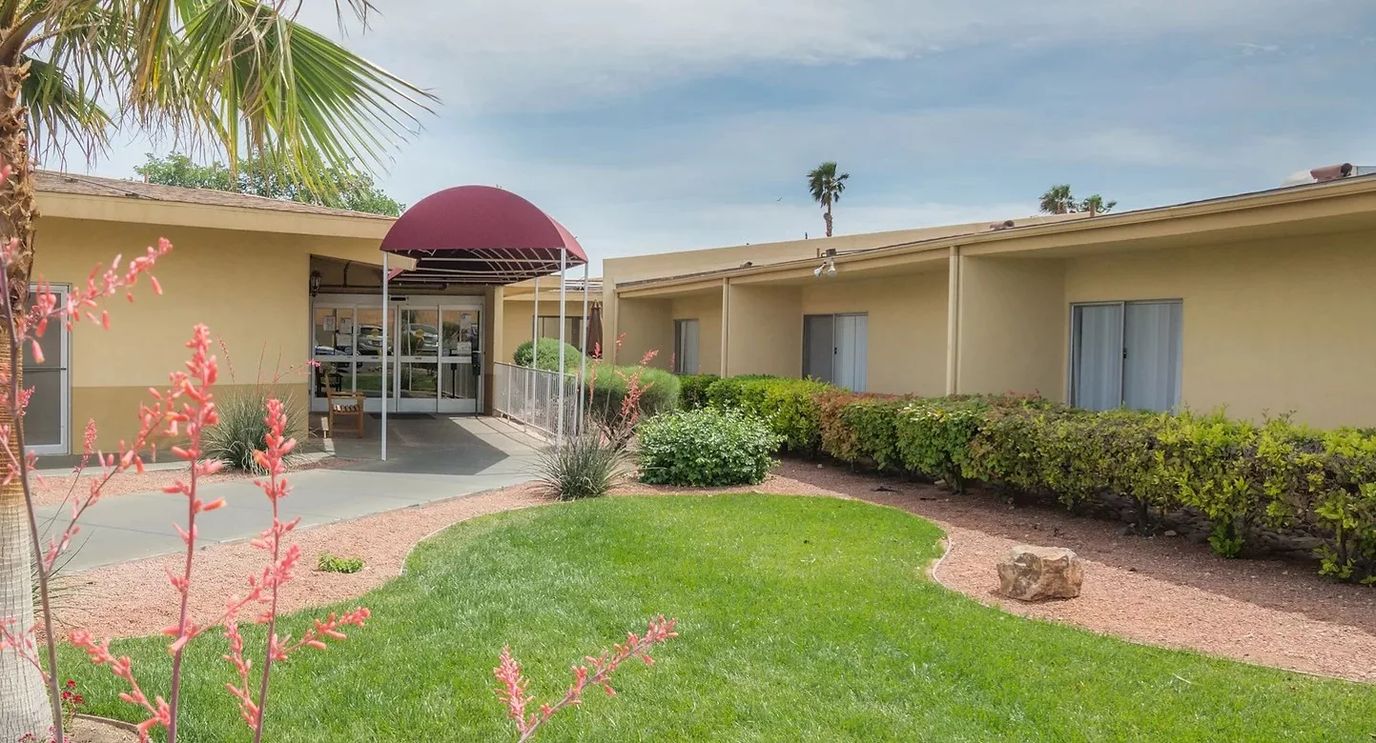
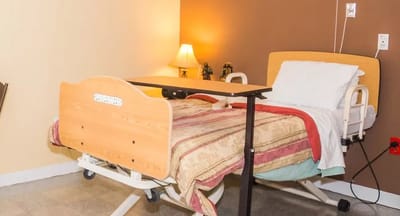

Torrey Pines Rehabilitation Hospital is a 95-bed skilled nursing facility at 1701 S Torrey Pines Drive in Las Vegas, Clark County, Nevada, operated by Torrey Pines Rehabilitation Hospital LLC. The facility primarily serves Medicare beneficiaries seeking short-term post-acute rehabilitation, with an average 94-day stay. Medicaid residents comprise 14% of admissions, and a small private-pay population rounds out the census. The facility is privately owned and maintains near-capacity occupancy at 98.1% of beds.
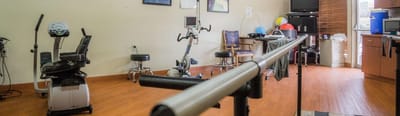
CMS ratings place Torrey Pines at 2 stars overall, with a 1-star health inspection rating (29.7% below Nevada average) and a 1-star quality measures rating that trails state performance by 17.2%. These ratings reflect substantial gaps between staffing presence and clinical outcomes. Though total nursing hours reach 4h 35m per resident daily (4th highest among Nevada skilled nursing facilities), physical therapist availability is notably strong at 40% above the state average.
The facility reported no federal penalties or payment denials over the past three years.
Quality indicators reveal significant concerns for the facility’s primary population (short-stay rehabilitation).
Re-hospitalization after discharge occurs in 26.3% of cases, slightly above the Nevada average of 23.4%. More strikingly, only 30.4% of short-stay residents successfully return to home or community settings, versus 50.6% statewide. Long-stay residents experience troubling antipsychotic medication use at 26% (nearly double the state average of 14.1%) and high-risk pressure ulcer rates at 8.1% (48% worse than state average). One bright spot: falls with major injury remain low at 0.8% among long-stay residents, substantially better than the 2.5% state rate.
Operating loss reached $4.4 million in 2023, and payroll consumes only 26.3% of revenue, the lowest ratio among Nevada skilled nursing facilities. This pattern is consistent with high occupancy but marginal reimbursement margins.
Torrey Pines fits post-acute Medicare rehabilitation admissions, though recovery and discharge outcomes suggest that careful discharge planning and care coordination may determine success in achieving community transitions.
| Staff type | Hours / Day / Resident | vs state avg |
|---|---|---|
|
Registered Nurse (RN)
| 55m per day | ▼ 14% State avg: 1h 4m per day · National avg: 41m per day |
|
LPN / LVN
| 48m per day | ▼ 11% State avg: 54m per day · National avg: 52m per day |
|
Nurse Aide
| 2h 28m per day | ▲ 4% State avg: 2h 23m per day · National avg: 2h 21m per day |
|
Weekend Total Nursing
| 3h 47m per day | ■ Avg State avg: 3h 51m per day · National avg: 3h 26m per day |
|
Physical Therapist
| 7m per day | ▲ 42% State avg: 5m per day · National avg: 4m per day |
|
Weekend RN
| 43m per day | ▼ 16% State avg: 51m per day · National avg: 29m per day |
Reporting period: October 1 – December 31, 2025 (Q4 2025). Source: CMS Payroll-Based Journal report.
Manages medical care and health needs.
Assists with medical care and medications.
Helps with daily care and mobility.
Total hours from contractors
130 contractor hours this quarter
| Certified Nursing Assistant | 75 | 0 | 75 | 21,382 | 92 | 100% | 7.6 |
| Registered Nurse | 22 | 0 | 22 | 6,690 | 92 | 100% | 7.8 |
| Licensed Practical Nurse | 20 | 0 | 20 | 6,408 | 92 | 100% | 8 |
| Other Dietary Services Staff | 9 | 0 | 9 | 3,241 | 92 | 100% | 7.9 |
| Speech Language Pathologist | 4 | 0 | 4 | 1,782 | 74 | 80% | 7.9 |
| Dental Services Staff | 3 | 0 | 3 | 1,229 | 86 | 93% | 8.7 |
| Physical Therapy Aide | 4 | 0 | 4 | 1,142 | 75 | 82% | 7.6 |
| Respiratory Therapy Technician | 3 | 0 | 3 | 1,021 | 74 | 80% | 7.7 |
| Qualified Social Worker | 2 | 0 | 2 | 976 | 64 | 70% | 8.3 |
| Clinical Nurse Specialist | 1 | 0 | 1 | 751 | 67 | 73% | 11.2 |
| Dietitian | 2 | 0 | 2 | 605 | 72 | 78% | 8.4 |
| Physical Therapy Assistant | 3 | 0 | 3 | 585 | 68 | 74% | 6.9 |
| Administrator | 1 | 0 | 1 | 512 | 64 | 70% | 8 |
| Nurse Practitioner | 1 | 0 | 1 | 512 | 64 | 70% | 8 |
| RN Director of Nursing | 1 | 0 | 1 | 512 | 53 | 58% | 9.7 |
| Mental Health Service Worker | 2 | 0 | 2 | 512 | 67 | 73% | 5.5 |
| Medical Director | 0 | 2 | 2 | 130 | 39 | 42% | 3.3 |
Federal penalties imposed by CMS for regulatory violations, including civil money penalties (fines) and denials of payment for new Medicare/Medicaid admissions.
Source: CMS Penalties Database
No penalties in the past 3 years
No civil money penalties or payment denials were reported in the last 3 years.
These measures show how residents usually do over time at this home, based on health outcomes and preventive care.
Nevada average: 9.7
Nevada average: 17.5
Nevada average: 15.6%
Nevada average: 20.8%
Nevada average: 16.9%
Nevada average: 2.5%
Nevada average: 5.5%
Nevada average: 1.4%
Nevada average: 5.4%
Nevada average: 4.2%
Nevada average: 14.1%
Nevada average: 91.0%
Nevada average: 89.6%
Nevada average: 1.82
Nevada average: 1.50
Nevada average: 83.9%
Nevada average: 2.0%
Nevada average: 80.7%
Nevada average: 23.4%
Nevada average: 9.8%
Nevada average: 0.8%
Nevada average: 53.7%
Nevada average: 50.6%
Quality measures are calculated from Minimum Data Set (MDS) assessments. For most measures, lower percentages indicate better care quality.
85% of new residents, usually for short-term rehab.
1% of new residents, often for short stays.
14% of new residents, often for long-term daily care.
Source: CMS Long-Term Care Facility Characteristics (Data as of Jan 2026)
Residents meet regularly to discuss policies, care quality, and activities
Organized group of residents that meets regularly to discuss facility policies, quality of life, and activities.
Data sourced from CMS Long-Term Care Facility Characteristics quarterly report. Payer mix reflects the current resident census by primary payment source.
Historical financial and operational data for Torrey Pines Rehabilitation Hospital from 2012–2023, based on CMS SNF Cost Reports.
Key figures below are for fiscal year ending in 12/2023.
Based on CMS SNF Cost Report for fiscal year ending in 12/2023.
Most residents typically stay for a few weeks or months before returning home or moving on.
Most new residents arrive under Medicare (85% of admissions), and a typical Medicare stay runs around 2 months.
Coverage residents most often arrive under.
Coverage residents most often leave under.
![]() 5.5 miles from city center
5.5 miles from city center
![]() Estimated distance in miles from Las Vegas's city center to Torrey Pines Rehabilitation Hospital's address, calculated via Google Maps.
— 3.73 miles to nearest hospital (University Medical Center)
Estimated distance in miles from Las Vegas's city center to Torrey Pines Rehabilitation Hospital's address, calculated via Google Maps.
— 3.73 miles to nearest hospital (University Medical Center)
Add your location
Info below is compiled from CMS reports & the NV Dept. of Health & Human Services, senior community websites & trusted data sources such as Walk Score & BBB.
Communities are listed from highest to lowest based on our ranking methodology.
| Las Ventanas at Summerlin | NH IL MC SNF | Las Vegas (Summerlin) | 60
Facility
60
NV AVG
42
Rank
#84 / 321 |
95.5%
Facility
95.5%
NV AVG
79.4
Rank
#60 / 263 | +20% | 5.10
Facility
5.10
NV AVG
4.03
Rank
#2 / 40 | +49% | +26% | $0
Facility
$0
NV AVG
$34.1k
Rank
#1 / 42 | 19
Facility
19
NV AVG
36.2
Rank
#2 / 42 | 4.8
Facility
4.8
NV AVG
7.1
Rank
#7 / 42 | - | 57 | - |
62
Facility
62
NV AVG
45
Rank
#96 / 415 | Humangood Nevada | $30.5MFiscal year ending 12/2023
Facility
$30.5MFiscal year ending 12/2023
NV AVG
$18.7M
Rank
#6 / 42 | $12.4MFiscal year ending 12/2023
Facility
$12.4MFiscal year ending 12/2023
NV AVG
$6.3M
Rank
#6 / 42 | 40.6%Fiscal year ending 12/2023
Facility
40.6%Fiscal year ending 12/2023
NV AVG
34.9%
Rank
#31 / 42 | 295086 | ||||
| Life Care Center of Las Vegas | NH SNF | Las Vegas (Twin Lakes) | 178
Facility
178
NV AVG
42
Rank
#13 / 321 |
93.8%
Facility
93.8%
NV AVG
79.4
Rank
#68 / 263 | +18% | 3.74
Facility
3.74
NV AVG
4.03
Rank
#12 / 40 | -43% | -7% | $0
Facility
$0
NV AVG
$34.1k
Rank
#1 / 42 | 34
Facility
34
NV AVG
36.2
Rank
#19 / 42 | 8.5
Facility
8.5
NV AVG
7.1
Rank
#30 / 42 | - | 167 | - |
63
Facility
63
NV AVG
45
Rank
#86 / 415 | Clarissa Dewese | $20.7MFiscal year ending 12/2023
Facility
$20.7MFiscal year ending 12/2023
NV AVG
$18.7M
Rank
#10 / 42 | $12.1MFiscal year ending 12/2023
Facility
$12.1MFiscal year ending 12/2023
NV AVG
$6.3M
Rank
#10 / 42 | 58.6%Fiscal year ending 12/2023
Facility
58.6%Fiscal year ending 12/2023
NV AVG
34.9%
Rank
#19 / 42 | 295052 | ||||
| Advanced Health Care of Las Vegas | NH SNF | Las Vegas | 38
Facility
38
NV AVG
42
Rank
#98 / 321 |
89.5%
Facility
89.5%
NV AVG
79.4
Rank
#95 / 263 | +13% | 3.63
Facility
3.63
NV AVG
4.03
Rank
#15 / 40 | +13% | -10% | $0
Facility
$0
NV AVG
$34.1k
Rank
#1 / 42 | 11
Facility
11
NV AVG
36.2
Rank
#1 / 42 | 3.7
Facility
3.7
NV AVG
7.1
Rank
#2 / 42 | - | 34 | A+ |
23
Facility
23
NV AVG
45
Rank
#330 / 415 | Joseph Walker | $10.3MFiscal year ending 12/2023
Facility
$10.3MFiscal year ending 12/2023
NV AVG
$18.7M
Rank
#37 / 42 | $4.8MFiscal year ending 12/2023
Facility
$4.8MFiscal year ending 12/2023
NV AVG
$6.3M
Rank
#40 / 42 | 46.6%Fiscal year ending 12/2023
Facility
46.6%Fiscal year ending 12/2023
NV AVG
34.9%
Rank
#29 / 42 | 295090 | ||||
| Marquis Centennial Hills | NH HOS RC SNF | Las Vegas (La Madre Foothills) | 115
Facility
115
NV AVG
42
Rank
#51 / 321 | - | - | 3.52
Facility
3.52
NV AVG
4.03
Rank
#19 / 40 | -11% | -13% | $0
Facility
$0
NV AVG
$34.1k
Rank
#1 / 42 | 29
Facility
29
NV AVG
36.2
Rank
#11 / 42 | 4.8
Facility
4.8
NV AVG
7.1
Rank
#7 / 42 | - | 182 | - |
31
Facility
31
NV AVG
45
Rank
#299 / 415 | Jacob Atwood | $14.9MFiscal year ending 12/2023
Facility
$14.9MFiscal year ending 12/2023
NV AVG
$18.7M
Rank
#25 / 42 | $8.8MFiscal year ending 12/2023
Facility
$8.8MFiscal year ending 12/2023
NV AVG
$6.3M
Rank
#22 / 42 | 59.3%Fiscal year ending 12/2023
Facility
59.3%Fiscal year ending 12/2023
NV AVG
34.9%
Rank
#18 / 42 | 295089 | ||||
| Torrey Pines Rehabilitation Hospital | NH SNF | Las Vegas (Charleston) | 95
Facility
95
NV AVG
42
Rank
#67 / 321 |
98.9%
Facility
98.9%
NV AVG
79.4
Rank
#55 / 263 | +25% | 4.58
Facility
4.58
NV AVG
4.03
Rank
#3 / 40 | -5% | +14% | $0
Facility
$0
NV AVG
$34.1k
Rank
#1 / 42 | 30
Facility
30
NV AVG
36.2
Rank
#15 / 42 | 5.0
Facility
5.0
NV AVG
7.1
Rank
#9 / 42 | - | 94 | - |
51
Facility
51
NV AVG
45
Rank
#177 / 415 | Torrey Pines Rehabilitation Hospital LLC | $17.4MFiscal year ending 12/2023
Facility
$17.4MFiscal year ending 12/2023
NV AVG
$18.7M
Rank
#3 / 42 | $9.3MFiscal year ending 12/2023
Facility
$9.3MFiscal year ending 12/2023
NV AVG
$6.3M
Rank
#20 / 42 | 53.6%Fiscal year ending 12/2023
Facility
53.6%Fiscal year ending 12/2023
NV AVG
34.9%
Rank
#42 / 42 | 295045 |
Torrey Pines Rehabilitation Hospital is located in Las Vegas, Nevada.
Here are the financial assistance programs available to residents in Nevada.
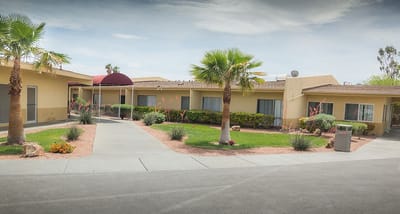
Torrey Pines Rehabilitation Hospital is in the Charleston neighborhood.
Torrey Pines Rehabilitation Hospital has a walk score of 51. Moderately walkable. Some errands can be accomplished on foot, with a mix of nearby amenities.
Torrey Pines Rehabilitation Hospital's occupancy is 98.1%.
No, Torrey Pines Rehabilitation Hospital has a no-pet policy.
Torrey Pines Rehabilitation Hospital is registered as a for-profit.
Yes — there are 4 photos of Torrey Pines Rehabilitation Hospital in the photo gallery on this page.
Torrey Pines Rehabilitation Hospital is located at 1701 S Torrey Pines Dr, Las Vegas, NV 89146.
Care Cost Calculator: See Prices in Your Area
Nursing Home Data Explorer
Don’t Wait Too Long: 7 Red Flag Signs Your Parent Needs Assisted Living Now
The True Cost of Assisted Living in 2025 – And How Families Are Paying For It
Understanding Senior Living Costs: Pricing Models, Discounts & Financial Assistance


