Overview of Trinity Grove

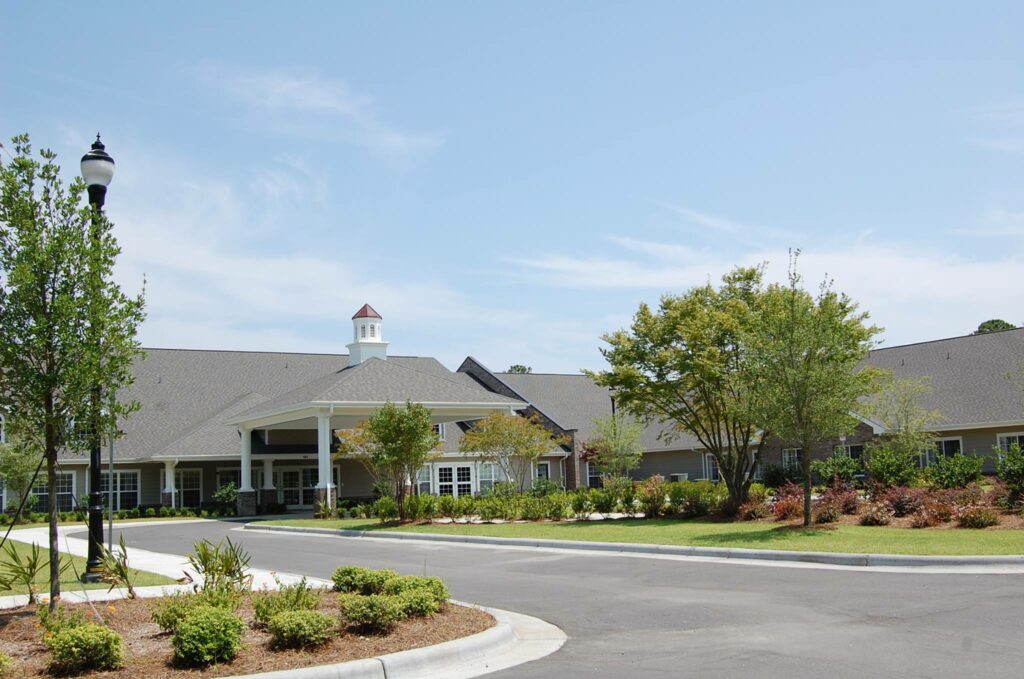
Trinity Grove, located in Wilmington, NC, is a distinguished senior living community primarily providing skilled nursing services with a focus on memory care. The accommodation options at Trinity Grove include private or semi-private rooms, each equipped with private bathrooms to ensure residents’ comfort and privacy. The community is dedicated to comprehensive healthcare services, offering 24-hour skilled nursing care, physician coverage, licensed dietician and social worker support, and various therapies such as speech, physical, and occupational therapies.

Residents at Trinity Grove enjoy a range of amenities designed to enhance their living experience. The community provides restaurant-style meals, snacks, and beverages, ensuring a delightful dining experience. Trinity Grove also offers modern conveniences such as wireless internet, cable TV, and personal telephone options. Leisure opportunities, outings, special events, an internet cafe, hair salon, and barber shop further contribute to a vibrant and engaging community. Courtyards, gardens, and amenities such as a children’s playground and transportation services add to the overall comfort and convenience at Trinity Grove.

(910) 442-3000

Quality ratings

Measured by Centers for Medicare & Medicaid Services (CMS)

Overall rating Info Official CMS rating based on health inspections, staffing and quality measures.
3/5
North Carolina average: 2.8/5
Health Inspection Info Official CMS rating based on deficiencies found during state health inspections.
2/5
North Carolina average: 2.8/5
Staffing Info Official CMS rating based on nurse staffing hours per resident per day.
5/5
North Carolina average: 2.7/5
Quality Measures Info Official CMS rating based on clinical outcomes for residents.
4/5
North Carolina average: 3.2/5

Nursing care per resident

Info Average daily nursing hours per resident (adjusted for acuity). Higher values indicate more nursing time per resident.
5h 13m per day

This home provides 31% more nursing time per resident than the state average.

North Carolina average: 3h 59m per day

Staffing hours breakdown

Info Hours of care per resident per day, broken down by staff type. Data from CMS Medicare.
Staff type Facility State avg National avg
Registered Nurse (RN) Info Registered nurse hours per resident per day. 58m per day 35m per day 41m per day
LPN / LVN Info Licensed Practical Nurse / Licensed Vocational Nurse hours per resident per day. 42m per day 52m per day 52m per day
Nurse Aide Info Nurse aide hours per resident per day. 2h 42m per day 2h 19m per day 2h 21m per day
Total Nursing (Weekend) Info Total number of nurse staff hours per resident per day on weekends. 3h 51m per day 3h 20m per day 3h 26m per day
Physical Therapist Info Physical therapist staff hours per resident per day. 5m per day 5m per day 4m per day
RN (Weekend) Info Registered nurse hours per resident per day on weekends. 29m per day 23m per day 29m per day

Capacity and availability

Medium-capacity home

Offers a balance of services and community atmosphere.

Total beds 100

This home usually has limited availability

Occupancy is moderate, suggesting balanced demand.

Similar demand to the North Carolina average
Occupancy rate 94.3%
Residents per day (avg) 95
Occupancy rate
94.3%
Residents per day (avg)
95

Who this home usually serves

TYPE OF STAY

Mostly short-term rehab stays

Most residents typically stay for a few weeks or months before returning home or moving on.

Might be optimal for
Short stays Recovery Medicare-covered care

Breakdown by payment type

Medicare

66% of new residents, usually for short-term rehab.

Typical stay 29 days

Private pay

33% of new residents, often for short stays.

Typical stay 4 - 5 months

Medicaid

1% of new residents, often for long-term daily care.

Typical stay 7 years

Finances and operations

Voluntary non-profit home
Church
Home revenue
$20.4M
Surplus of revenue
$561.9K
Voluntary non-profit home Church
Home revenue
$20,425,017.00
Surplus of revenue
$561,907.00
Payroll costs Info The portion of the home's budget spent on staff, including nurses, caregivers, and other employees who support care and operations.
$6.1M
30% of revenue
Other operating costs Info All remaining costs needed to run the home, such as food, utilities, building maintenance, supplies and administrative expenses.
$13.7M
Total costs $19.9M

Types of Care at Trinity Grove

Skilled Nursing Memory Care
Contact Trinity Grove

Compare Nursing Homes around Wilmington

The information below is reported by the North Carolina Department of Health and Human Services, Division of Health Service Regulation.
Trinity Grove
AL

Assisted Living For seniors needing help with daily tasks but not full-time nursing.

MC

Memory Care Specialized care for those with Memory Loss, Alzheimer's, or dementia, ensuring safety and support.

SNF

Nursing Homes 24/7 care needed

Wilmington
100
No
19
-
94.3%
$20,176,401.00
$6,122,528.00
30.3%
94.60
3/5
5.2232
2/5
5/5
4/5
3
16
4
+41%
+31%
+23%
Peak Resources Wilmington
AL

Assisted Living For seniors needing help with daily tasks but not full-time nursing.

HC

Hospice Care

IL

Independent Living For self-sufficient seniors seeking community and minimal assistance.

SNF

Nursing Homes 24/7 care needed

Wilmington (Lakeside Park)
110
No
33
DEBORAH JEAN NUNN MRTL TR
86.2%
$9,970,542.00
$4,270,322.00
42.8%
87.50
1/5
3.8512
2/5
2/5
1/5
1
23
1
-38%
-3%
+13%
Bradley Creek Health Center
AL

Assisted Living For seniors needing help with daily tasks but not full-time nursing.

MC

Memory Care Specialized care for those with Memory Loss, Alzheimer's, or dementia, ensuring safety and support.

SNF

Nursing Homes 24/7 care needed

Wilmington
-
No
18
-
-
-
-
-
-
-
-
-
-
-
-
-
-
-
-
-

Places of interest near Trinity Grove

Address 5 miles from city center — 3.39 miles to nearest hospital (DaVita New Hanover Dialysis)

Address 631 Junction Creek Dr, Wilmington, NC 28412

Calculate Travel Distance to Trinity Grove

Add your location

Address

Staffing Data

Source: CMS Payroll-Based Journal (Q2 2025)

165
Total Staff
135
Employees
30
Contractors
47,090
Total Hours (Quarter)
68
Avg Staff/Day
7.6
Avg Shift (hrs)
Nursing Staff Breakdown
Role Count Avg Shift (hrs) Uses Contractors?
Registered Nurse218.6 No
Licensed Practical Nurse208.7 No
Certified Nursing Assistant807.5 No
Staff by Category
Administration
2 staff
7.8hs shift avg
Nursing Staff
121 staff
7.8hs shift avg
Physicians & Practitioners
9 staff
7.9hs shift avg
Therapy Services
21 staff
6.3hs shift avg
Activities & Recreation
0 staff
0hs shift avg
Social Services
8 staff
6.9hs shift avg
Dietary Services
2 staff
7.6hs shift avg
Other Services
2 staff
8hs shift avg
Contractor Analysis
12%
of total hours from contractors
5,635 contractor hours this quarter
Qualified Social Worker: 6 Other Physician: 2 Speech Language Pathologist: 7 Occupational Therapy Aide: 2 Physical Therapy Aide: 5 Physical Therapy Assistant: 3 Respiratory Therapy Technician: 3 Medical Director: 1 Occupational Therapy Assistant: 1
Role Employees Contractors Total Staff Total Hours Days Worked % of Days Avg Shift (hrs)
Certified Nursing Assistant8008024,08591100%7.5
Licensed Practical Nurse200205,93391100%8.7
Registered Nurse210215,29791100%8.6
Clinical Nurse Specialist6062,2857886%7.9
Speech Language Pathologist0771,4888492%7
Qualified Social Worker0661,1117178%6.3
Other Social Services Staff2021,0136774%7.8
Dental Services Staff2029446571%8
Physical Therapy Aide0559367785%6.6
Respiratory Therapy Technician0337387886%6.2
Physical Therapy Assistant0337076875%6.3
Administrator1014966268%8
Dietitian1014886167%8
Nurse Practitioner1014725965%8
Other Dietary Services Staff1014456268%7.2
Other Physician0222703336%7.9
Medical Director0112102831%7.5
Occupational Therapy Aide0221124752%2.4
Occupational Therapy Assistant011631213%5.2

Health Inspection History

Inspections
Total health inspections 5

North Carolina average 4


Last Health inspection on Sep 2025

Total health citations 16
Citations per inspection
3.2

Health citations are formal notices following inspections when they fail to comply with safety and care standards.

11 of 16 citations resulted from standard inspections; 4 of 16 resulted from complaint investigations; and 1 of 16 came from combined inspections (standard and complaint).

Breakdown of citation severity (last 3 years)
Critical Health citations More info 2
54% worse than North Carolina average

North Carolina average: 1.3


Serious Health citations More info 2
122% worse than North Carolina average

North Carolina average: 0.9

2 critical citations More info North Carolina average: 1.3

2 serious citations More info North Carolina average: 0.9

10 moderate citations More info North Carolina average: 17.1

2 minor citations More info North Carolina average: 1.6
Citations history (last 3 years)
Abuse/Neglect serious citation Sep 18, 2025
Corrected

Infection Control moderate citation Sep 18, 2025
Corrected

Nursing Services minor citation Sep 18, 2025
Corrected

Resident Rights moderate citation Sep 18, 2025
Corrected

Facility Characteristics

Source: CMS Long-Term Care Facility Characteristics (Data as of Jan 2026)

Ownership: Non-Profit (Church)
Part of: Lutheran Services Carolinas
Resident Census by Payment Source
92 Total Residents
Medicare 19 (20.7%)
Medicaid 27 (29.3%)
Private Pay/Other 46 (50%)
Specialized Care Beds
25 Total Specialty Beds
25% of Bed Capacity
25
Alzheimer's / Dementia Beds
25%
Programs & Services
Residents' Group
CCRC
Family Engagement

Active councils help families stay involved in care decisions and facility operations.

Quality of care over time

These measures show how residents usually do over time at this home, based on health outcomes and preventive care.

High-risk clinical events score Info A composite score based on pressure ulcers, falls with injury, weight loss, walking ability decline, and activities of daily living decline. 10.4
9% better than North Carolina average

North Carolina average: 11.5

Functional decline score Info A composite score based on activities of daily living decline, walking ability decline, and incontinence. 23.4
13% worse than North Carolina average

North Carolina average: 20.6

Long-stay resident measures
Need for Help with Daily Activities Increased Info Percent of long-stay residents whose need for help with daily activities has increased 15.4%
13% better than North Carolina average

North Carolina average: 17.5%

Walking Ability Worsened Info Percent of long-stay residents whose ability to move independently worsened 20.8%
11% better than North Carolina average

North Carolina average: 23.3%

Low Risk Residents with Bowel/Bladder Incontinence Info Percent of low risk long-stay residents who lose control of their bowels or bladder 34.0%
59% worse than North Carolina average

North Carolina average: 21.4%

Falls with Major Injury Info Percent of long-stay residents experiencing one or more falls with major injury 3.4%
8% better than North Carolina average

North Carolina average: 3.6%

High Risk Residents with Pressure Ulcers Info Percent of long-stay high risk residents with pressure ulcers 9.0%
43% worse than North Carolina average

North Carolina average: 6.3%

Urinary Tract Infection Info Percent of long-stay residents with a urinary tract infection 4.4%
68% worse than North Carolina average

North Carolina average: 2.6%

Lost Too Much Weight Info Percent of long-stay residents who lose too much weight 3.7%
50% better than North Carolina average

North Carolina average: 7.4%

Depressive Symptoms Info Percent of long-stay residents who have depressive symptoms 3.9%
12% better than North Carolina average

North Carolina average: 4.4%

Antipsychotic Use Info Percent of long-stay residents who received an antipsychotic medication 21.1%
58% worse than North Carolina average

North Carolina average: 13.4%

Pneumococcal Vaccine Info Percent of long-stay residents assessed and appropriately given the pneumococcal vaccine 97.3%
6% better than North Carolina average

North Carolina average: 91.6%

Influenza Vaccine Info Percent of long-stay residents assessed and appropriately given the seasonal influenza vaccine 91.3%
In line with North Carolina average

North Carolina average: 94.1%

Hospitalizations per 1,000 days Info Number of hospitalizations per 1,000 long-stay resident days. 1.57
11% better than North Carolina average

North Carolina average: 1.77

ED visits per 1,000 days Info Number of outpatient emergency department visits per 1,000 long-stay resident days. 1.26
31% better than North Carolina average

North Carolina average: 1.82

Short-stay resident measures
Pneumococcal Vaccine Info Percent of short-stay residents assessed and appropriately given the pneumococcal vaccine 78.9%
In line with North Carolina average

North Carolina average: 79.9%

Antipsychotic medication increase Info Percent of short-stay residents who newly received an antipsychotic medication 0.0%
100% better than North Carolina average

North Carolina average: 1.5%

Influenza Vaccine Info Percent of short-stay residents assessed and appropriately given the seasonal influenza vaccine 80.3%
In line with North Carolina average

North Carolina average: 78.1%

Re-hospitalized after SNF stay Info Percentage of short-stay residents who were re-hospitalized after their nursing home admission. 20.6%
10% better than North Carolina average

North Carolina average: 22.9%

Emergency department visits Info Percentage of short-stay residents who had an outpatient emergency department visit. 10.0%
24% better than North Carolina average

North Carolina average: 13.2%

Falls with major injury Info Percentage of SNF residents who experience falls with major injury during their stay. 1.2%
51% worse than North Carolina average

North Carolina average: 0.8%

Ability to care for self at discharge Info Percentage of residents at or above expected ability to care for themselves at discharge. 60.4%
13% better than North Carolina average

North Carolina average: 53.7%

Successful return to home or community Info Rate of successful return to home or community from a skilled nursing facility. 61.5%
22% better than North Carolina average

North Carolina average: 50.6%

Penalties and fines

Federal penalties imposed by CMS for regulatory violations, including civil money penalties (fines) and denials of payment for new Medicare/Medicaid admissions.

Source: CMS Penalties Database (Data as of Jan 2026)

Total fines amount $138K
81% higher than North Carolina average

North Carolina average: $76K

Number of fines 4
71% more fines than North Carolina average

North Carolina average: 2.3

Payment Denials Info Serious action where Medicare and/or Medicaid temporarily stops payments for new residents until issues are fixed. 0
100% fewer payment denials than North Carolina average

North Carolina average: 0.4

Fines amount comparison
This facility $138K
North Carolina average $76K
Penalty History

Penalties are imposed by CMS for violations of federal nursing home regulations.

Civil Money Penalty Info Fines imposed for noncompliance, which can be assessed per day or per instance of violation. Sep 18, 2025
$100K
Civil Money Penalty Info Fines imposed for noncompliance, which can be assessed per day or per instance of violation. Oct 10, 2024
$21K
Civil Money Penalty Info Fines imposed for noncompliance, which can be assessed per day or per instance of violation. Aug 5, 2024
$9K
Civil Money Penalty Info Fines imposed for noncompliance, which can be assessed per day or per instance of violation. Aug 5, 2024
$9K

Last updated: Jan 2026

Guides for Better Senior Living

Care Cost Calculator: See Prices in Your Area

Nursing Home Data Explorer

Don’t Wait Too Long: 7 Red Flag Signs Your Parent Needs Assisted Living Now

The True Cost of Assisted Living in 2025 – And How Families Are Paying For It

Understanding Senior Living Costs: Pricing Models, Discounts & Financial Assistance

Financial Aid for North Carolina Seniors

Get financial aid guidance

Community Alternatives Program for Disabled Adults

NC Medicaid CAP/DA

Age 65+ or disabled, North Carolina resident, Medicaid- eligible, nursing home-level care need.

~$2,829/month (300% FBR, individual).

$2,000 (individual), $3,000 (couple).

High demand; waitlists common in urban areas.

North Carolina Senior Care Options

NC SCO (via NFCSP)

Caregiver of someone 60+ (or with dementia), North Carolina resident.

No strict limit; prioritizes low-income.

Not applicable.

Limited slots; rural/urban balance.

Program of All-Inclusive Care for the Elderly (PACE)

North Carolina PACE (e.g., PACE of the Triad)

Age 55+, NC resident (specific counties), NFLOC, safe with PACE support.

~$2,829/month (Medicaid-eligible); private pay option available.

$2,000 (individual), $3,000 (couple) for Medicaid enrollees.

Available in 10+ counties (e.g., Guilford, Wake); multiple providers (e.g., PACE of the Southern Piedmont).

In-Home Aide Services

North Carolina In-Home Aide Services

Age 60+, NC resident, unable to perform 1+ ADL, at risk of nursing home placement.

No strict cap; prioritizes low-income (~$24,980/year).

Not assessed; need-based.

Family can be aides; varies by county funding.

Medicare Savings Program (MSP)

North Carolina Medicare Savings Program

Age 65+ or disabled, NC resident, Medicare Part A/B.

~$2,510/month (QMB), ~$3,380/month (SLMB), ~$3,598/month (QI)—individual.

$9,430 (individual), $14,130 (couple).

Three tiers; no waitlist; includes Extra Help for Part D.

Low-Income Energy Assistance Program (LIHEAP)

North Carolina LIHEAP

Age 60+ prioritized, NC resident, low-income household.

~$3,970/month (individual, 185% FPL).

Not assessed; income-focused.

Covers oil, gas, electric; emergency aid via Crisis Intervention Program (CIP).

Senior Community Service Employment Program (SCSEP)

North Carolina SCSEP

Age 55+, unemployed, low-income, NC resident.

~$1,983/month (125% FPL).

Not specified; income-focused.

Priority for veterans, rural residents; AARP partnership.

VA Aid and Attendance (A&A) and Housebound Benefits

North Carolina VA Aid and Attendance/Housebound

Age 65+ or disabled veteran/spouse, NC resident, wartime service, need for ADL help (A&A) or homebound.

Net income < ~$1,984/month (veteran with dependent, A&A); pension offsets income.

~$155,356 (net worth limit).

High veteran demand in rural/urban areas.

Urgent Repair Program (URP)

North Carolina Urgent Repair Program

Age 60+ prioritized, NC resident, homeowner, low-income.

~$30,258/year (50% AMI, varies by county).

Not strictly assessed; home value considered.

Forgivable at $2,000/year; statewide via local partners.

State/County Special Assistance (SA)

North Carolina Special Assistance

Age 65+ (or disabled), NC resident, in licensed adult care home, low-income.

~$1,255/month (individual, 100% FPL); varies by facility rate.

$2,000 (individual).

Covers assisted living; counties supplement state funds.

Who we are

Your Senior Care Partner, Every Step of the Way

We help families find affordable senior communities and unlock same day discounts, Medicaid, and Medicare options tailored to your needs.

Contact us Today
Tour Icon
Planning a tour? Check our touring checklist.
Chat Icon
Thinking of living here? We can help you speak to a current resident