Trinity Grove
Nursing Home, Skilled Nursing & Memory Care · Wilmington, NC
CMS overall rating Info The Overall CMS Rating is scored from 1 to 5 stars and combines results from health inspections, staffing levels, and quality measures. Health inspections carry the most weight. Staffing and quality scores can increase or decrease the final rating based on performance compared to state and national standards.

Trinity Grove

Nursing Home, Skilled Nursing & Memory Care · Wilmington, NC
CMS overall rating Info The Overall CMS Rating is scored from 1 to 5 stars and combines results from health inspections, staffing levels, and quality measures. Health inspections carry the most weight. Staffing and quality scores can increase or decrease the final rating based on performance compared to state and national standards.
Calculator: See prices in your area
Trinity Grove accepts Medicare, Medicaid, and private pay.

Overview of Trinity Grove

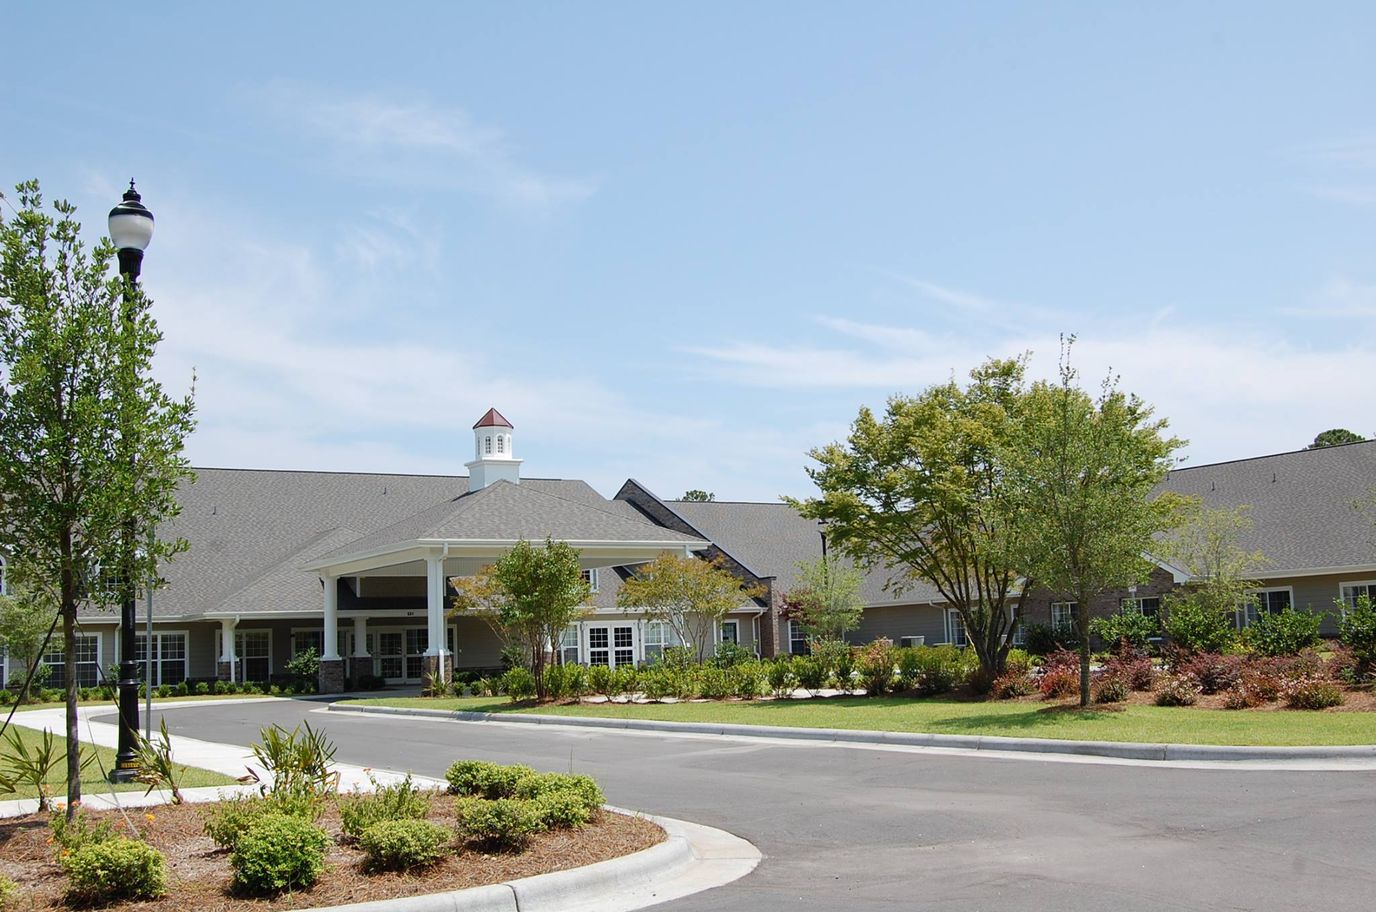
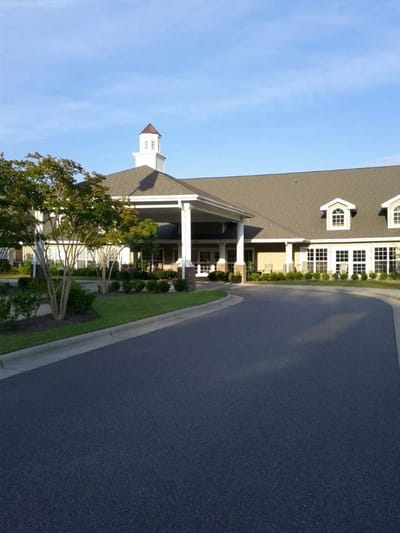
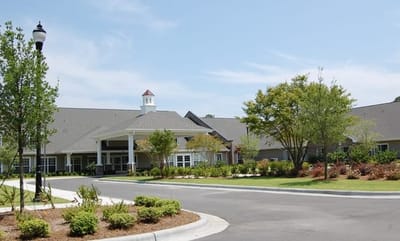
Trinity Grove, located in Wilmington, NC, is a distinguished senior living community primarily providing skilled nursing services with a focus on memory care. The accommodation options at Trinity Grove include private or semi-private rooms, each equipped with private bathrooms to ensure residents’ comfort and privacy. The community is dedicated to comprehensive healthcare services, offering 24-hour skilled nursing care, physician coverage, licensed dietician and social worker support, and various therapies such as speech, physical, and occupational therapies.

Residents at Trinity Grove enjoy a range of amenities designed to enhance their living experience. The community provides restaurant-style meals, snacks, and beverages, ensuring a delightful dining experience. Trinity Grove also offers modern conveniences such as wireless internet, cable TV, and personal telephone options. Leisure opportunities, outings, special events, an internet cafe, hair salon, and barber shop further contribute to a vibrant and engaging community. Courtyards, gardens, and amenities such as a children’s playground and transportation services add to the overall comfort and convenience at Trinity Grove.

(910) 442-3000

Quality ratings

Measured by Centers for Medicare & Medicaid Services (CMS)

Overall rating Info The Overall CMS Rating combines results from health inspections, staffing levels and quality measures. Health inspections carry the most weight. Staffing and quality scores can increase or decrease the final rating based on performance compared to state and national standards.
▲ 7.3% Above NC avg. ▲ 7.3% Above NC avg.Click the badge to see the full State ranking.Click here to see the full State ranking.
Health Inspection Info Based on the results of the facility's three most recent standard inspections and any complaint investigations. CMS reviews the number, scope, and severity of deficiencies, with more recent findings weighted more heavily.
▼ 29.2% Below NC avg. ▼ 29.2% Below NC avg.Click the badge to see the full State ranking.Click here to see the full State ranking.
Staffing Info Measures average nursing staff hours per resident per day, including Registered Nurses (RNs) and total nursing staff. Ratings are adjusted based on the level of care residents require and are compared to state and national benchmarks.
▲ 88.0% Above NC avg. ▲ 88.0% Above NC avg.Click the badge to see the full State ranking.Click here to see the full State ranking.
Quality Measures Info Based on clinical and physical health indicators reported to CMS, such as hospital readmissions, falls, pressure ulcers, and improvements in mobility. These measures reflect how well residents' health needs are being managed.
▲ 26.0% Above NC avg. ▲ 26.0% Above NC avg.Click the badge to see the full State ranking.Click here to see the full State ranking.

Staffing hours breakdown

Info Daily nursing hours per resident by staff type, reported to CMS. Higher is generally better — compare this facility to state and national averages to see where staffing stands.

Hours per resident per day — compared to North Carolina state averages

Total nursing care / resident Info This home is ranked 19th out of 90 homes in North Carolina. Total adjusted nursing hours per resident per day, combining RN, LPN, and aide time. CMS adjusts this for case-mix so facilities can be fairly compared.
5h 13m per day
Rank #19 / 90Nurse hours — State benchmarkedThis home is ranked 19th out of 90 homes in North Carolina. Shows adjusted nurse hours per resident per day benchmarked to the North Carolina average, with a ranking across 90 North Carolina SNFs. More hours mean more direct care. The national average is about 3.5 hrs; below 3.0 is a red flag.Click the rank badge to see the full State ranking.Click here to see the full State ranking.
This facility North Carolina avg (3h 59m per day)
vs North Carolina avg
+31%

1 of 6 metrics below state avg

Standout metric Registered Nurse (RN) is +66% above state avg
Staff typeHours / Day / Residentvs state avg
Registered Nurse (RN) Info RNs hold the highest nursing license and can assess residents, interpret test results, and direct care plans. More RN hours per day often signals stronger clinical oversight and faster response to health changes. 58m per day ▲ 66% State avg: 35m per day · National avg: 41m per day
LPN / LVN Info Licensed Practical Nurses (LPNs) or Licensed Vocational Nurses (LVNs) deliver routine hands-on care — medication administration, wound dressing, and monitoring vital signs. They work under RN supervision and make up a large share of daily bedside care. 42m per day ▼ 19% State avg: 52m per day · National avg: 52m per day
Nurse Aide Info Certified Nurse Aides (CNAs) provide the most direct day-to-day assistance: bathing, dressing, feeding, and mobility. Nurse aide hours are typically the largest staffing category and directly affect residents' quality of life. 2h 42m per day ▲ 17% State avg: 2h 19m per day · National avg: 2h 21m per day
Weekend Total Nursing Info Combined nursing hours (RN + LPN + Nurse Aide) per resident per day on weekends. Staffing often drops on weekends — this figure reveals whether the facility maintains adequate coverage outside of weekday hours. 3h 53m per day ▲ 16% State avg: 3h 20m per day · National avg: 3h 26m per day
Physical Therapist Info Hours per resident per day provided by licensed Physical Therapists (PTs) or PT Assistants. PT services help residents recover mobility after injury or illness and are especially important for post-acute (short-stay) rehabilitation. 5m per day ■ Avg State avg: 5m per day · National avg: 4m per day
Weekend RN Info Registered nurse hours specifically on weekends. Facilities sometimes reduce RN presence on Saturdays and Sundays — a low weekend RN figure compared to weekday hours can indicate reduced clinical oversight when most administrative staff are absent. 29m per day ▲ 26% State avg: 23m per day · National avg: 29m per day

Types of Care at Trinity Grove

Skilled Nursing Memory Care

Capacity and availability

This home usually has limited availability

Occupancy between 85% and 95% suggests balanced demand.

Higher occupancy than the North Carolina average: 76.4%
Occupancy rate 94.3% Rank #40 / 264Occupancy rate — State benchmarkedThis home is ranked 40th out of 264 homes in North Carolina. Shows this facility's occupancy rate versus the North Carolina average, with its Statewide rank out of 264. Higher occupancy signals strong local demand and financial stability.Click the rank badge to see the full State ranking.Click here to see the full State ranking.
Avg. Length of Stay 92 days
Occupancy rate
94.3% Rank #40 / 264Occupancy rate — State benchmarkedThis home is ranked 40th out of 264 homes in North Carolina. Shows this facility's occupancy rate versus the North Carolina average, with its Statewide rank out of 264. Higher occupancy signals strong local demand and financial stability.Click the rank badge to see the full State ranking.Click here to see the full State ranking.
Avg. Length of Stay
92 days
Walk Score
Walk Score: 19 / 100 Rank #385 / 572Walk Score — State benchmarkedThis home is ranked 385th out of 572 homes in North Carolina. Shows how walkable this facility's neighborhood is compared to the average Walk Score across North Carolina SNFs. Higher scores benefit residents, families, and staff.Click the rank badge to see the full State ranking.Click here to see the full State ranking.
Car-dependent. Most errands require a car, with limited nearby walkable options.

About this community

About the Community

The community has four small neighborhoods designed with beautifully appointed rooms and welcoming gathering places for dining and socializing.

Safety & Compliance

Safety FeaturesSecure courtyard and garden areas

Therapy & Rehabilitation

1 service
Rehabilitation Services

Amenities & Lifestyle

Gym
Chapel
Restaurant
Courtyard
Garden
ActivitiesResidents are encouraged to maintain their individuality and make choices about their time with a variety of recreational, learning, and spiritual activities available each day.
Branded ProgramsNew Pathways, Eden Alternative, Wellspring
Wellness ProgramNew Pathways encourages the development of resident-directed practices and a culture centered on being more homelike and less hospital-like.
Specific Programsspecialized memory care, speech, physical, and occupational therapies
Religious ServicesYes

Dining & Nutrition

Food DescriptionTrinity Grove provides restaurant-style meals, snacks, and beverages in a dining program that emphasizes resident choice.
Meal Plan OptionsRestaurant-style, Buffet

Contact Trinity Grove

Staffing Data

Reporting period: October 1 – December 31, 2025 (Q4 2025). Source: CMS Payroll-Based Journal report.

Total staff 171
Employees 136
Contractors 35
Staff to resident ratio 1.86:1
0% compared with North Carolina average
North Carolina average ratio: 1.80:1 North Carolina average ratio: 1.80:1See full North Carolina ranking
Avg staff/day 63
Average shift 7.7 hours
0% compared with North Carolina average
North Carolina average: 8 hours North Carolina average shift: 8 hoursSee full North Carolina ranking
Total staff hours (quarter) 44,476

Nursing staff breakdown

Q4 2025 · Oct 1 – Dec 31 More info This data comes from the CMS Payroll-Based Journal report covering October 1 – December 31, 2025.
Registered Nurse

Manages medical care and health needs.

RN Staff 19
Average shift length Info Average shift length. Calculated as total hours divided by days worked and average staff per day. 8.3 hours

No contractors work on this role.

Licensed Practical Nurse

Assists with medical care and medications.

LPN Staff 20
Average shift length Info Average shift length. Calculated as total hours divided by days worked and average staff per day. 9.4 hours

No contractors work on this role.

Certified Nursing Assistant

Helps with daily care and mobility.

CNA Staff 80
Average shift length Info Average shift length. Calculated as total hours divided by days worked and average staff per day. 7.5 hours

No contractors work on this role.

Contractor staffing

Q4 2025 · Oct 1 – Dec 31 More info This data comes from the CMS Payroll-Based Journal report covering October 1 – December 31, 2025.

Total hours from contractors

11.5%

5,095 contractor hours this quarter

Qualified Social Worker: 7 Speech Language Pathologist: 6 Physical Therapy Assistant: 6 Physical Therapy Aide: 5 Respiratory Therapy Technician: 3 Other Physician: 2 Medical Director: 2 Occupational Therapy Assistant: 2 Occupational Therapy Aide: 1 Feeding Assistant: 1

Staff by category

Q4 2025 · Oct 1 – Dec 31 More info This data comes from the CMS Payroll-Based Journal report covering October 1 – December 31, 2025.
Certified Nursing Assistant8008021,3629199%7.5
Licensed Practical Nurse200206,8549199%9.4
Registered Nurse190194,9629199%8.3
Clinical Nurse Specialist5051,9819098%7.2
Speech Language Pathologist0661,4558795%6.9
Qualified Social Worker0771,0956672%6.9
Dental Services Staff3039786571%7.8
Other Dietary Services Staff2029756773%7.8
Physical Therapy Aide0558237885%6.2
Physical Therapy Assistant0667327076%6.3
Respiratory Therapy Technician0336727480%6.1
Other Social Services Staff2025566470%7.8
Nurse Practitioner1015036368%8
Administrator1014886166%8
Dietitian1014565762%8
Medication Aide/Technician1012243942%5.7
Other Physician0221041314%8
Occupational Therapy Aide112864347%1.9
Occupational Therapy Assistant022791415%5.2
Medical Director022581921%3
Feeding Assistant01136910%4
80 Certified Nursing Assistant
% of Days 99%
20 Licensed Practical Nurse
% of Days 99%
19 Registered Nurse
% of Days 99%
5 Clinical Nurse Specialist
% of Days 98%
6 Speech Language Pathologist
% of Days 95%
7 Qualified Social Worker
% of Days 72%
3 Dental Services Staff
% of Days 71%
2 Other Dietary Services Staff
% of Days 73%
5 Physical Therapy Aide
% of Days 85%
6 Physical Therapy Assistant
% of Days 76%
3 Respiratory Therapy Technician
% of Days 80%
2 Other Social Services Staff
% of Days 70%
1 Nurse Practitioner
% of Days 68%
1 Administrator
% of Days 66%
1 Dietitian
% of Days 62%
1 Medication Aide/Technician
% of Days 42%
2 Other Physician
% of Days 14%
2 Occupational Therapy Aide
% of Days 47%
2 Occupational Therapy Assistant
% of Days 15%
2 Medical Director
% of Days 21%
1 Feeding Assistant
% of Days 10%

Penalties and fines

Includes penalties issued in 2024-2025

Federal penalties imposed by CMS for regulatory violations, including civil money penalties (fines) and denials of payment for new Medicare/Medicaid admissions.

Source: CMS Penalties Database (Data as of Jan 2026)

Total fines amount $138K Rank #75 / 97Federal fines — State benchmarkedThis home is ranked 75th out of 97 homes in North Carolina. Shows this facility's cumulative CMS federal fine dollars versus the North Carolina average among facilities with fines, and where it ranks among 97 skilled nursing facilities in the pool. Lower total dollars mean a better rank.Click the rank badge to see the full State ranking.Click here to see the full State ranking.
81% higher than North Carolina average

North Carolina average: $76K

Number of fines 4
71% more fines than North Carolina average

North Carolina average: 2.3

Payment Denials Info Serious action where Medicare and/or Medicaid temporarily stops payments for new residents until issues are fixed. 0
100% fewer payment denials than North Carolina average

North Carolina average: 0.4

Fines amount comparison
This facility $138K
North Carolina average $76K
Penalty History

Penalties are imposed by CMS for violations of federal nursing home regulations.

4 penalties in the past 3 years

Multiple penalties were reported in the last 3 years.

Civil Money Penalty Info Fines imposed for noncompliance, which can be assessed per day or per instance of violation. Sep 18, 2025
$100K
Civil Money Penalty Info Fines imposed for noncompliance, which can be assessed per day or per instance of violation. Oct 10, 2024
$21K
Civil Money Penalty Info Fines imposed for noncompliance, which can be assessed per day or per instance of violation. Aug 5, 2024
$9K
Civil Money Penalty Info Fines imposed for noncompliance, which can be assessed per day or per instance of violation. Aug 5, 2024
$9K

Last updated: Jan 2026

Quality of care over time

These measures show how residents usually do over time at this home, based on health outcomes and preventive care.

High-risk clinical events score Info A composite score based on pressure ulcers, falls with injury, weight loss, walking ability decline, and activities of daily living decline. 10.4
9% better than North Carolina average

North Carolina average: 11.5

Functional decline score Info A composite score based on activities of daily living decline, walking ability decline, and incontinence. 23.4
13% worse than North Carolina average

North Carolina average: 20.6

Long-stay resident measures
Below average North Carolina avg: 2.9 Info CMS star rating based on long-stay quality measure performance. 5 stars = significantly above average, 1 star = significantly below average.
Need for Help with Daily Activities Increased Info Percent of long-stay residents whose need for help with daily activities has increased 15.4%
13% better than North Carolina average

North Carolina average: 17.5%

Walking Ability Worsened Info Percent of long-stay residents whose ability to move independently worsened 20.8%
11% better than North Carolina average

North Carolina average: 23.3%

Low Risk Residents with Bowel/Bladder Incontinence Info Percent of low risk long-stay residents who lose control of their bowels or bladder 34.0%
59% worse than North Carolina average

North Carolina average: 21.4%

Falls with Major Injury Info Percent of long-stay residents experiencing one or more falls with major injury 3.4%
8% better than North Carolina average

North Carolina average: 3.6%

High Risk Residents with Pressure Ulcers Info Percent of long-stay high risk residents with pressure ulcers 9.0%
43% worse than North Carolina average

North Carolina average: 6.3%

Urinary Tract Infection Info Percent of long-stay residents with a urinary tract infection 4.4%
68% worse than North Carolina average

North Carolina average: 2.6%

Lost Too Much Weight Info Percent of long-stay residents who lose too much weight 3.7%
50% better than North Carolina average

North Carolina average: 7.4%

Depressive Symptoms Info Percent of long-stay residents who have depressive symptoms 3.9%
12% better than North Carolina average

North Carolina average: 4.4%

Antipsychotic Use Info Percent of long-stay residents who received an antipsychotic medication 21.1%
58% worse than North Carolina average

North Carolina average: 13.4%

Pneumococcal Vaccine Info Percent of long-stay residents assessed and appropriately given the pneumococcal vaccine 97.3%
6% better than North Carolina average

North Carolina average: 91.6%

Influenza Vaccine Info Percent of long-stay residents assessed and appropriately given the seasonal influenza vaccine 91.3%
In line with North Carolina average

North Carolina average: 94.1%

Hospitalizations per 1,000 days Info Number of hospitalizations per 1,000 long-stay resident days. 1.57
11% better than North Carolina average

North Carolina average: 1.77

ED visits per 1,000 days Info Number of outpatient emergency department visits per 1,000 long-stay resident days. 1.26
31% better than North Carolina average

North Carolina average: 1.82

Short-stay resident measures
Above average North Carolina avg: 2.9 Info CMS star rating based on short-stay quality measure performance. 5 stars = much above average, 1 star = much below average.
Pneumococcal Vaccine Info Percent of short-stay residents assessed and appropriately given the pneumococcal vaccine 78.9%
In line with North Carolina average

North Carolina average: 79.9%

Antipsychotic medication increase Info Percent of short-stay residents who newly received an antipsychotic medication 0.0%
100% better than North Carolina average

North Carolina average: 1.5%

Influenza Vaccine Info Percent of short-stay residents assessed and appropriately given the seasonal influenza vaccine 80.3%
In line with North Carolina average

North Carolina average: 78.1%

Re-hospitalized after SNF stay Info Percentage of short-stay residents who were re-hospitalized after their nursing home admission. 20.6%
10% better than North Carolina average

North Carolina average: 22.9%

Emergency department visits Info Percentage of short-stay residents who had an outpatient emergency department visit. 10.0%
24% better than North Carolina average

North Carolina average: 13.2%

Falls with major injury Info Percentage of SNF residents who experience falls with major injury during their stay. 1.2%
51% worse than North Carolina average

North Carolina average: 0.8%

Ability to care for self at discharge Info Percentage of residents at or above expected ability to care for themselves at discharge. 60.4%
13% better than North Carolina average

North Carolina average: 53.7%

Successful return to home or community Info Rate of successful return to home or community from a skilled nursing facility. 61.5%
22% better than North Carolina average

North Carolina average: 50.6%

Breakdown by payment type

Medicare

66% of new residents, usually for short-term rehab.

Typical stay 29 days

Private pay

33% of new residents, often for short stays.

Typical stay 4 - 5 months

Medicaid

1% of new residents, often for long-term daily care.

Typical stay 7 years

Facility Characteristics

Source: CMS Long-Term Care Facility Characteristics (Data as of Jan 2026)

Total residents 92
Medicare
19
20.7% of residents
Medicaid
27
29.3% of residents
Private pay or other
46
50% of residents
Programs & Services
Residents Group

Residents meet regularly to discuss policies, care quality, and activities

CCRC

Part of a Continuing Care Retirement Community offering multiple care levels

Active Resident Council

Organized group of residents that meets regularly to discuss facility policies, quality of life, and activities.

Finances and operations

Voluntary non-profit community
Operated by a church.
Home revenue
$20.4M
Surplus of revenue
$561.9K
Voluntary non-profit community Operated by a church.
Home revenue
$20.4M Rank #33 / 97Revenue — State benchmarkedThis home is ranked 33rd out of 97 homes in North Carolina. Shows this facility's annual revenue compared to the North Carolina SNF average. Higher revenue generally means more resources for staffing and capital — read alongside Payroll %.Click the rank badge to see the full State ranking.Click here to see the full State ranking.
Surplus of revenue
$561.9K
Payroll costs Info The portion of the home's budget spent on staff, including nurses, caregivers, and other employees who support care and operations. Rank #35 / 97Payroll — State benchmarkedThis home is ranked 35th out of 97 homes in North Carolina. Shows total annual staff payroll benchmarked to the North Carolina average. Higher payroll investment relative to peers often signals better staffing and less reliance on cheaper contract labor.Click the rank badge to see the full State ranking.Click here to see the full State ranking.
$8.3M
40.6% of revenue Rank #67 / 97Payroll % — State benchmarkedThis home is ranked 67th out of 97 homes in North Carolina. Shows payroll as a percentage of revenue versus the North Carolina average. Well-run North Carolina SNFs typically land around 49–62% — the top third Statewide. Below 25% may signal understaffing or heavy agency use — read with Staffing ratings.Click the rank badge to see the full State ranking.Click here to see the full State ranking.
Other operating costs Info All remaining costs needed to run the home, such as food, utilities, building maintenance, supplies and administrative expenses.
$11.6M
Total costs $19.9M

Who this home usually serves

TYPE OF STAY

Mostly short-term rehab stays

Most residents typically stay for a few weeks or months before returning home or moving on.

Places of interest near Trinity Grove

Address 5.0 miles from city center Info Estimated distance in miles from Wilmington's city center to Trinity Grove's address, calculated via Google Maps. — 3.39 miles to nearest hospital (DaVita New Hanover Dialysis)

Calculate Travel Distance to Trinity Grove

Add your location

Address

Financial Assistance for
Nursing Home in North Carolina

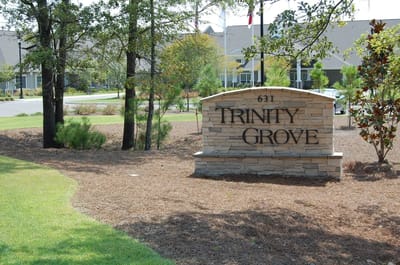
Trinity Grove is located in Wilmington, North Carolina.
Here are the financial assistance programs available to residents in North Carolina.

Get Financial aid guidance

Community Alternatives Program for Disabled Adults

NC Medicaid CAP/DA

Age 65+ or disabled
General North Carolina resident, Medicaid- eligible, nursing home-level care need.
Income Limits (2025) ~$2,829/month 300% FBR, individual
Asset Limits $2,000 (individual), $3,000 (couple).
NC

High demand; waitlists common in urban areas.

Benefits
Personal care (5-7 hours/day) Respite (240 hours/year) Adult day care ($60/day) Home modifications ($1,500 avg.)

North Carolina Senior Care Options

NC SCO (via NFCSP)

Age Caregiver of someone 60+ (or with dementia)
General North Carolina resident.
Income Limits No strict limit; prioritizes low-income.
Asset Limits Not applicable.
NC

Limited slots; rural/urban balance.

Benefits
In-home respite (4-6 hours/day) Adult day care (~$60/day) Short-term facility care (up to 5 days)

Program of All-Inclusive Care for the Elderly (PACE)

North Carolina PACE (e.g., PACE of the Triad)

Age 55+
General NC resident (specific counties), NFLOC, safe with PACE support.
Income Limits (2025) ~$2,829/month (Medicaid-eligible); private pay option available.
Asset Limits $2,000 (individual), $3,000 (couple) for Medicaid enrollees.
NC

Available in 10+ counties (e.g., Guilford, Wake); multiple providers (e.g., PACE of the Southern Piedmont).

Benefits
Personal care (5-7 hours/day) Medical care Meals Transportation Respite Therapies

In-Home Aide Services

North Carolina In-Home Aide Services

Age 60+
General NC resident, unable to perform 1+ ADL, at risk of nursing home placement.
Income Limits (2025) No strict cap; prioritizes low-income ~$24,980/year
Asset Limits Not assessed; need-based.
NC

Family can be aides; varies by county funding.

Benefits
Personal care (5-20 hours/week) Meal prep Respite (~5 days/year) Errands

Medicare Savings Program (MSP)

North Carolina Medicare Savings Program

Age 65+ or disabled
General NC resident, Medicare Part A/B.
Income Limits (2025) ~$2,510/month (QMB), ~$3,380/month (SLMB), ~$3,598/month (QI)—individual.
Asset Limits $9,430 (individual), $14,130 (couple).
NC

Three tiers; no waitlist; includes Extra Help for Part D.

Benefits
Covers Part B premiums ($174.70/month) Deductibles ($240/year) Copays (~20%)

VA Aid and Attendance (A&A) and Housebound Benefits

North Carolina VA Aid and Attendance/Housebound

Age 65+ or disabled veteran/spouse
General NC resident, wartime service, need for ADL help (A&A) or homebound.
Income Limits (2025) Net income < ~$1,984/month (veteran with dependent, A&A); pension offsets income.
Asset Limits ~$155,356 net worth limit
NC

High veteran demand in rural/urban areas.

Benefits
Cash (~$1,433-$2,642/month veteran, ~$951-$1,318 spouse) for care costs (e.g., in-home, assisted living)

Urgent Repair Program (URP)

North Carolina Urgent Repair Program

Age 60+ prioritized
General NC resident, homeowner, low-income.
Income Limits (2025) ~$30,258/year 50% AMI, varies by county
Asset Limits Not strictly assessed; home value considered.
NC

Forgivable at $2,000/year; statewide via local partners.

Benefits
Repairs (~$8,000-$12,000 avg.) for safety (e.g., roofs, heating, accessibility)

State/County Special Assistance (SA)

North Carolina Special Assistance

Age 65+ (or disabled)
General NC resident, in licensed adult care home, low-income.
Income Limits (2025) ~$1,255/month (individual, 100% FPL); varies by facility rate.
Asset Limits $2,000 individual
NC

Covers assisted living; counties supplement state funds.

Benefits
Cash (~$1,200-$1,500/month) for room/board; Medicaid covers care services

Compare Nursing Home around Wilmington

The information below is reported by the North Carolina Department of Health and Human Services, Division of Health Service Regulation.

5 facilities compared · CMS & NC Dept. of Health data

Filter by care type
Carolina Bay at Autumn Hall
NH

Nursing Home Licensed facility providing 24/7 skilled nursing care for residents with complex, ongoing medical needs. Staffed by RNs, LPNs, and CNAs. Inspected and star-rated annually by CMS. Accepts Medicare (short-term rehab) and Medicaid (long-term care).

AL

Assisted Living A licensed, long-term care setting for seniors or individuals with disabilities who need help with daily activities — like bathing, dressing, and medication management — but not 24-hour skilled nursing. Offers housing, meals, and around-the-clock support while aiming to maximize resident independence.

MC

Memory Care Secured, specialized care for people living with Alzheimer's or dementia. Staff trained in cognitive impairment, with higher staff-to-resident ratios and an environment designed to reduce confusion and wandering risk.

Wilmington (Windemere)108 89.5% +17%4.36 +14%+10%$063.0-28 18 Wilmington Ah Senior Housing Jv Opco LLC$14.0M$5.2M37.5%345571
Trinity Grove
NH

Nursing Home Licensed facility providing 24/7 skilled nursing care for residents with complex, ongoing medical needs. Staffed by RNs, LPNs, and CNAs. Inspected and star-rated annually by CMS. Accepts Medicare (short-term rehab) and Medicaid (long-term care).

AL

Assisted Living A licensed, long-term care setting for seniors or individuals with disabilities who need help with daily activities — like bathing, dressing, and medication management — but not 24-hour skilled nursing. Offers housing, meals, and around-the-clock support while aiming to maximize resident independence.

MC

Memory Care Secured, specialized care for people living with Alzheimer's or dementia. Staff trained in cognitive impairment, with higher staff-to-resident ratios and an environment designed to reduce confusion and wandering risk.

Wilmington100 94.3% +23%5.22 +21%+31%$38.2k163.2495 19 -$20.4M$8.3M40.6%345554
Champions Assisted Living at the Davis Community
NH

Nursing Home Licensed facility providing 24/7 skilled nursing care for residents with complex, ongoing medical needs. Staffed by RNs, LPNs, and CNAs. Inspected and star-rated annually by CMS. Accepts Medicare (short-term rehab) and Medicaid (long-term care).

AL

Assisted Living A licensed, long-term care setting for seniors or individuals with disabilities who need help with daily activities — like bathing, dressing, and medication management — but not 24-hour skilled nursing. Offers housing, meals, and around-the-clock support while aiming to maximize resident independence.

IL

Independent Living Lifestyle-focused communities for older adults offering dining, activities, and transportation with minimal personal care. Best for active, independent seniors who want community without medical support.

MC

Memory Care Secured, specialized care for people living with Alzheimer's or dementia. Staff trained in cognitive impairment, with higher staff-to-resident ratios and an environment designed to reduce confusion and wandering risk.

N

Nursing

Wilmington179 60.7% -21%3.39 -19%-15%$12.0k143.5396 6 Charles Long$33.7M$16.6M49.2%345160
Liberty Commons
NH

Nursing Home Licensed facility providing 24/7 skilled nursing care for residents with complex, ongoing medical needs. Staffed by RNs, LPNs, and CNAs. Inspected and star-rated annually by CMS. Accepts Medicare (short-term rehab) and Medicaid (long-term care).

AL

Assisted Living A licensed, long-term care setting for seniors or individuals with disabilities who need help with daily activities — like bathing, dressing, and medication management — but not 24-hour skilled nursing. Offers housing, meals, and around-the-clock support while aiming to maximize resident independence.

HC

Home Care Professional care delivered in the person's own home — from companionship and errands to skilled nursing and therapy. Allows seniors to age in place. Medicare covers skilled home health when medically necessary.

Wilmington (Liberty Commons Center)122 41.9% -45%3.66 -31%-8%$21.0k225.55108 52 Charles Duff$13.6M$6.2M45.6%345468
Peak Resources Wilmington
NH

Nursing Home Licensed facility providing 24/7 skilled nursing care for residents with complex, ongoing medical needs. Staffed by RNs, LPNs, and CNAs. Inspected and star-rated annually by CMS. Accepts Medicare (short-term rehab) and Medicaid (long-term care).

AL

Assisted Living A licensed, long-term care setting for seniors or individuals with disabilities who need help with daily activities — like bathing, dressing, and medication management — but not 24-hour skilled nursing. Offers housing, meals, and around-the-clock support while aiming to maximize resident independence.

HC

Home Care Professional care delivered in the person's own home — from companionship and errands to skilled nursing and therapy. Allows seniors to age in place. Medicare covers skilled home health when medically necessary.

IL

Independent Living Lifestyle-focused communities for older adults offering dining, activities, and transportation with minimal personal care. Best for active, independent seniors who want community without medical support.

RC

Respite Care Short-term temporary care — days to weeks — to give family caregivers a break. Full care provided during the stay. Often used after hospitalization or to trial a facility before a permanent placement decision.

Wilmington (Lakeside Park)110 86.2% +13%3.85 -52%-3%$35.5k235.8188 33 Deborah Jean Nunn Mrtl Tr$10.1M$4.9M48.7%345537

Frequently Asked Questions about Trinity Grove

Is Trinity Grove in a walkable area?

Trinity Grove has a walk score of 19. Car-dependent. Most errands require a car, with limited nearby walkable options.

What is the occupancy rate at Trinity Grove?

Trinity Grove's occupancy is 94.3%.

Are there photos of Trinity Grove?

Yes — there are 6 photos of Trinity Grove in the photo gallery on this page.

What is the phone number of Trinity Grove?

(910) 442-3000 will put you in contact with the team at Trinity Grove.

Is Trinity Grove Medicare or Medicaid certified?

Yes — Trinity Grove is a CMS-certified provider of Medicare and Medicaid.

Guides for Better Senior Living

Care Cost Calculator: See Prices in Your Area

Nursing Home Data Explorer

Don’t Wait Too Long: 7 Red Flag Signs Your Parent Needs Assisted Living Now

The True Cost of Assisted Living in 2025 – And How Families Are Paying For It

Understanding Senior Living Costs: Pricing Models, Discounts & Financial Assistance

Explore Open Rooms
1 Contact details
2 What type of senior care service are you looking for?
3 What budget do you have in mind for senior care?
4 How soon do you need to find care?
5 Additional details

Thank you for your interest!

Our team will be in touch shortly to help with next steps.