University Park Nursing & Rehabilitation

Nursing Home

University Park Nursing & Rehabilitation

4511 Coronado Ave, Wichita Falls, TX 76310 View Map
Nursing Home
icon
Care Cost Calculator: See Prices in Your Area Care Cost Calculator: See Prices in Your Area icon
Overview of University Park Nursing & Rehabilitation

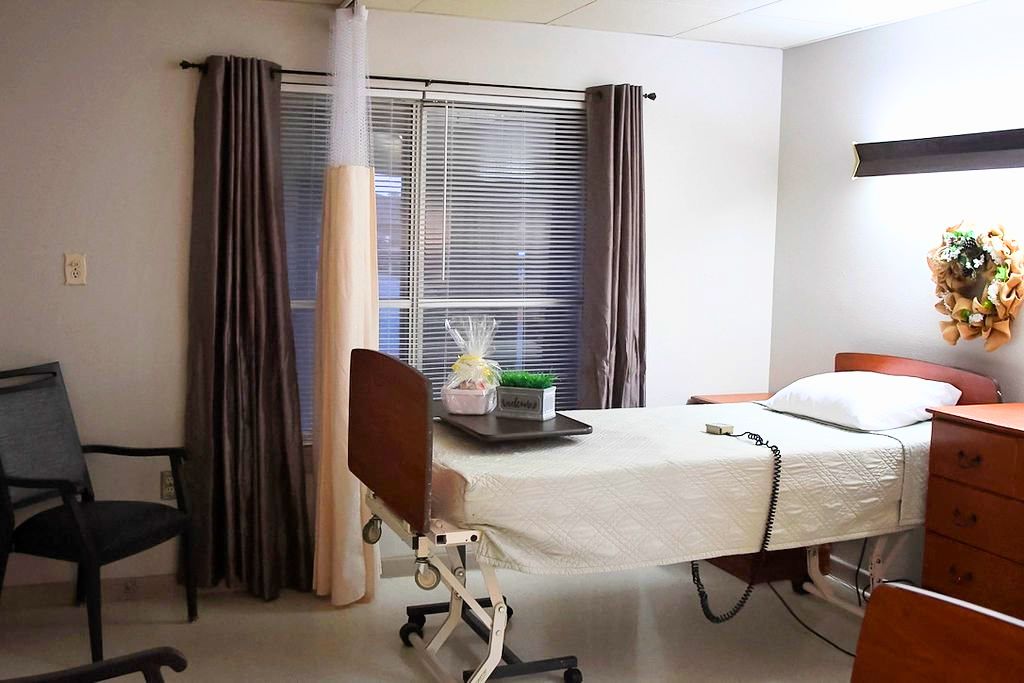
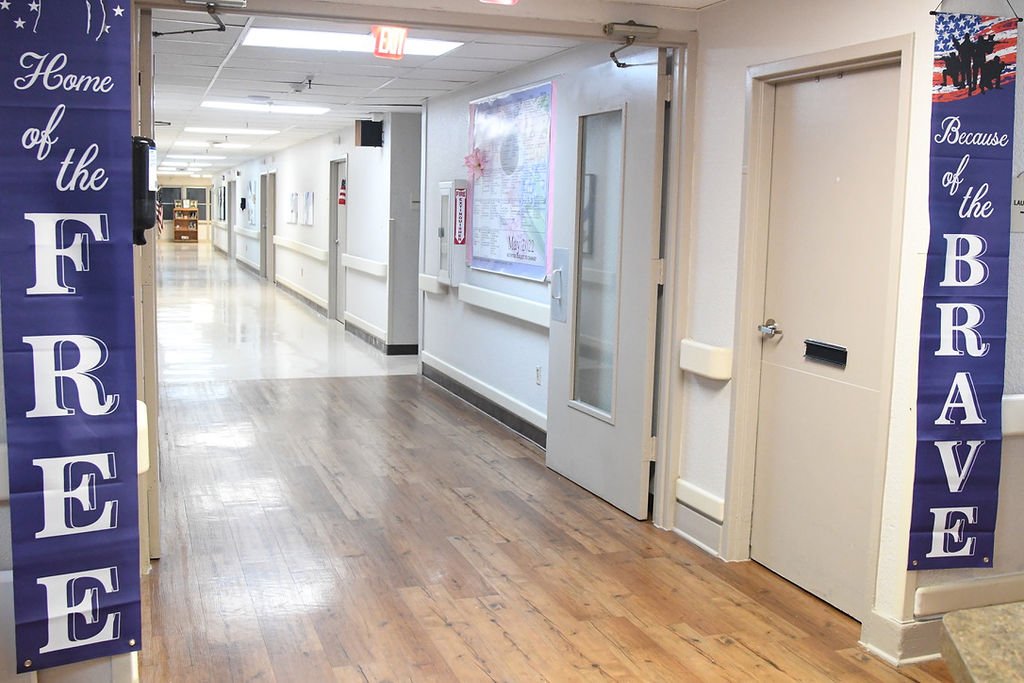
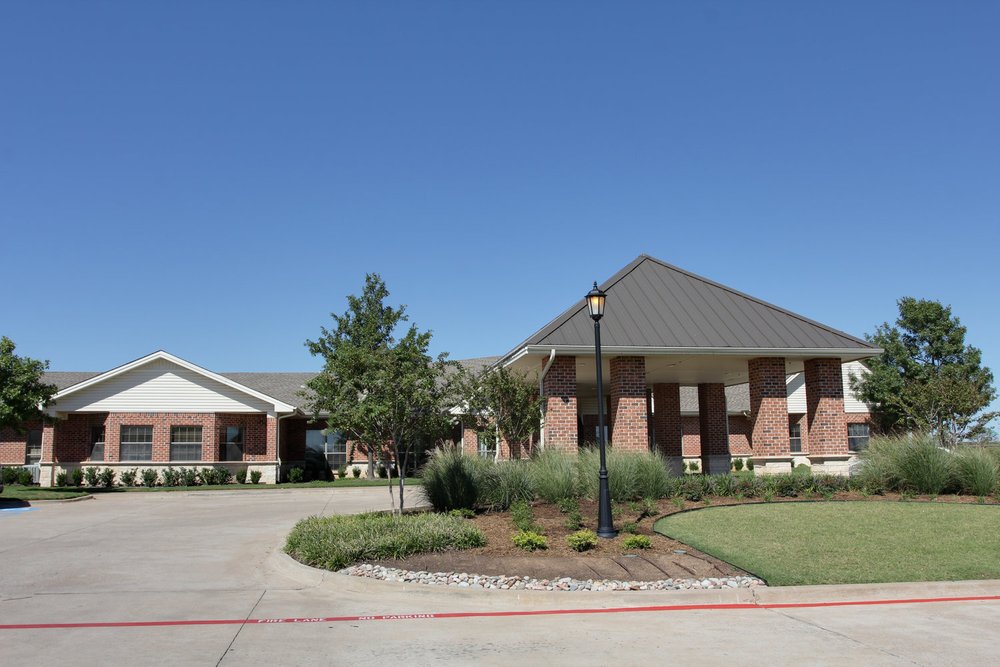
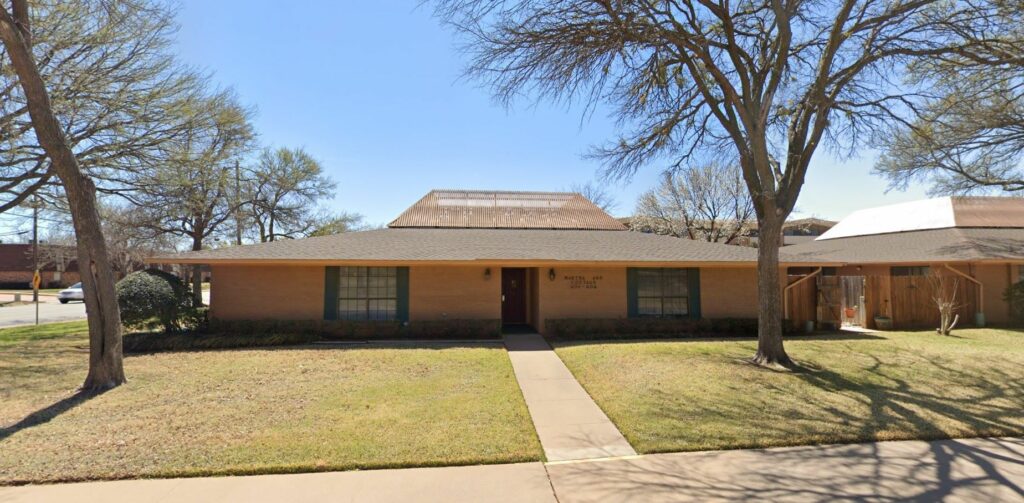
University Park Nursing & Rehabilitation is a long-term nursing home and rehabilitation facility located in Wichita Falls, TX. This nursing home also provides respite care services, and hospice care. Part of their long-term nursing program includes 24/7 care and supervision, medication management, diabetes management, and assistance with daily activities.

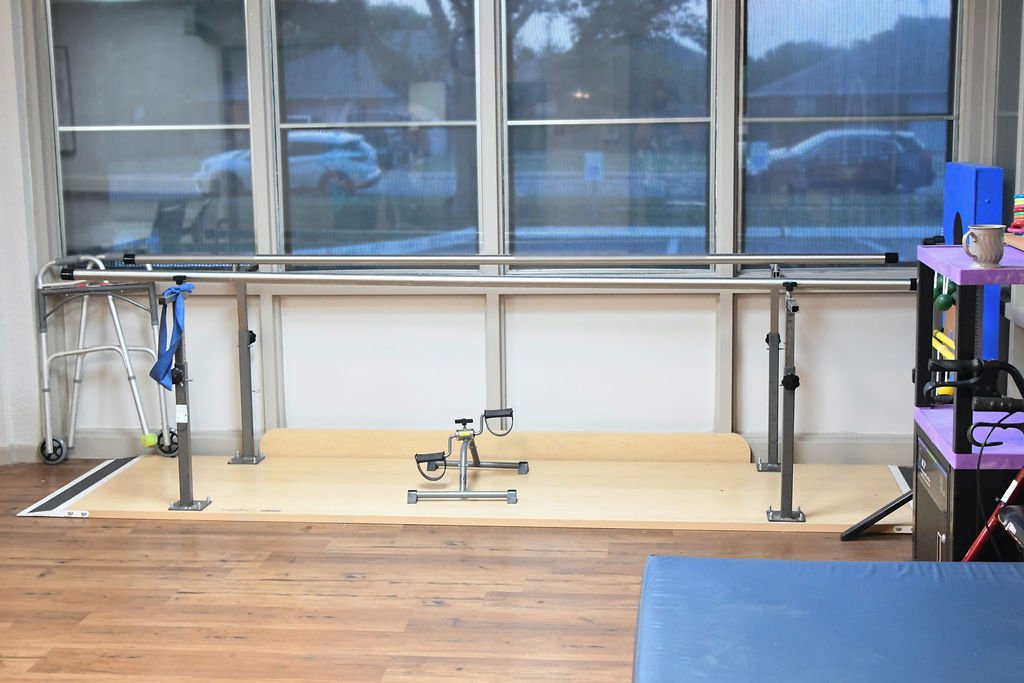
Their long-term nursing residents are also provided nutritional services, to ensure that their dietary needs are met, as well as beauty and barber services as part of their regular grooming routine. Laundry and housekeeping services are also provided in the facility to ensure the residents’ environment are sanitized and safe. Other medical services such as podiatry and optometry are also offered, as well as physical, occupational, and speech therapy.

Quality ratings

Measured by Centers for Medicare & Medicaid Services (CMS)

Overall rating Info Official CMS rating based on health inspections, staffing and quality measures.
3/5
Texas average: 2.8/5
Health Inspection Info Official CMS rating based on deficiencies found during state health inspections.
3/5
Texas average: 2.8/5
Staffing Info Official CMS rating based on nurse staffing hours per resident per day.
2/5
Texas average: 2.1/5
Quality Measures Info Official CMS rating based on clinical outcomes for residents.
4/5
Texas average: 3.8/5

Nursing care per resident

Info Average daily nursing hours per resident (adjusted for acuity). Higher values indicate more nursing time per resident.
3h 49m per day

This home provides 5% more nursing time per resident than the state average.

Texas average: 3h 38m per day

Staffing hours breakdown

Info Hours of care per resident per day, broken down by staff type. Data from CMS Medicare.
Staff type Facility State avg National avg
Registered Nurse (RN) Info Registered nurse hours per resident per day. 26m per day 26m per day 41m per day
LPN / LVN Info Licensed Practical Nurse / Licensed Vocational Nurse hours per resident per day. 48m per day 57m per day 52m per day
Nurse Aide Info Nurse aide hours per resident per day. 1h 53m per day 2h 1m per day 2h 21m per day
Total Nursing (Weekend) Info Total number of nurse staff hours per resident per day on weekends. 2h 39m per day 2h 59m per day 3h 26m per day
Physical Therapist Info Physical therapist staff hours per resident per day. 1m per day 4m per day 4m per day
RN (Weekend) Info Registered nurse hours per resident per day on weekends. 16m per day 21m per day 29m per day

Capacity and availability

Smaller home

May offer a more intimate, personalized care environment.

Total beds 98

This home usually has availability

Lower occupancy suggests more openings may be available.

Lower demand than the Texas average
Occupancy rate 84.6%
Residents per day (avg) 90
Occupancy rate
84.6%
Residents per day (avg)
90

Who this home usually serves

TYPE OF STAY

Mix of rehab and long-term care

This home supports both short-term rehab and long-term care, with residents staying for a wide range of durations.

Breakdown by payment type

Medicare

28% of new residents, usually for short-term rehab.

Typical stay 1 - 2 months

Private pay

38% of new residents, often for short stays.

Typical stay 3 - 4 months

Medicaid

34% of new residents, often for long-term daily care.

Typical stay 10 - 11 months

Finances and operations

Governmental home
Facility District
Home revenue
$7.4M
Surplus of revenue
$1.3M
Governmental home Facility District
Home revenue
$7,375,349.00
Surplus of revenue
$1,300,795.00
Payroll costs Info The portion of the home's budget spent on staff, including nurses, caregivers, and other employees who support care and operations.
$3.1M
41.5% of revenue
Other operating costs Info All remaining costs needed to run the home, such as food, utilities, building maintenance, supplies and administrative expenses.
$3.0M
Total costs $6.1M
Bed community size
98-bed community
A larger shared setting that may offer more common spaces and organized community services.
Years in operation
54 years in operation
A longer operating history, which may indicate experience navigating regulations and delivering ongoing care.
Walk Score
Walk Score: 40 / 100
Somewhat walkable. A few nearby services may be reachable on foot, but most trips require transportation.

Services

MEDICARE/MEDICAID

About this community

Facility Type
Nursing
License Date
January 7, 2023
License Expiration
January 7, 2026

Additional licensing details

License number: 311507
Year opened: 9/1/1971
CMS Certification Number: 455916
County: WICHITA

Ownership & operating entity

University Park Nursing & Rehabilitation is administrated by STORMI WELCH.

Management company: WICHITA FALLS I ENTERPRISES, LLC
Owner: WEST WHARTON COUNTY HOSPITAL DISTRICT
Ownership type: HOSPITAL DISTRICT/AUTHORITY

Type Of Units

Medicaid and Medicare
98 units
Total beds
98 units

Staffing

Key information about the people who lead and staff this community.

Leadership

Contact: Ms. Susan Johnson, Administrator
Administrator email: [email protected]

Care Services

Nursing Services
Rehabilitation Services
Respite Care
Skilled Nursing
Licensed Nurses/CNAs
Short-Term Rehab

Programs & Activities

Specific Programs
Rehab-to-Home, Nursing Restorative Programs, Respite Care, Wound Care, Physical, Occupational, and Speech Therapy, Surgery Recovery, Stroke and Neurological Conditions, Cardiac Related Illnesses, Diabetes Management, Podiatry, Dentistry, Optometry, Hospice, Transportation Services, Medication Management, Nutritional Services, Beauty & Barber Services, Laundry & Housekeeping, Religious Services, Engaging Activities
Religious Services
Yes

Dining & Nutrition

Food Description
Healthy, nutritious, and delicious meals prepared for residents daily.
Meals Included
Yes

Types of Care at University Park Nursing & Rehabilitation

Skilled Nursing Respite Care Hospice Care
Contact University Park Nursing & Rehabilitation

Compare Nursing Homes around Wichita Falls

The information below is reported by the Texas Health and Human Services Commission.
Senior Care Health & Rehabilitation
SNF

Nursing Homes 24/7 care needed

Wichita Falls
144
No
23
HOOD, DELANA
89.4%
$30,521,298.00
$6,171,773.00
20.2%
124.60
5/5
3.0225
5/5
2/5
5/5
1
10
-
+11%
-17%
+41%
University Park Nursing & Rehabilitation
HC

Hospice Care

SNF

Nursing Homes 24/7 care needed

RC

Respite Care

Wichita Falls
98
No
40
WICHITA FALLS I ENTERPRISES, LLC
84.6%
$5,965,890.00
$3,058,224.00
51.3%
89.60
3/5
3.8247
3/5
2/5
4/5
1
32
-
-27%
+5%
+33%
Nexion Midwestern Healthcare Center
SNF

Nursing Homes 24/7 care needed

Wichita Falls
121
No
6
DECATUR HOSPITAL AUTHORITY
61.2%
$6,993,886.00
$3,255,130.00
46.5%
77.40
1/5
4.6329
1/5
4/5
4/5
1
32
3
-23%
+28%
-4%
Perkins-Prothro Health Care Center
SNF

Nursing Homes 24/7 care needed

Wichita Falls
-
No
42
-
-
-
-
-
-
-
-
-
-
-
-
-
-
-
-
-
The Gables at Rolling Meadows
SNF

Nursing Homes 24/7 care needed

Wichita Falls
86
No
50
WICHITA FALLS RETIREMENT FOUNDATION
52.7%
$8,371,810.00
$4,226,280.00
50.5%
-
-
-
-
-
-
-
-
-
-
-
-17%

Places of interest near University Park Nursing & Rehabilitation

Address 5.9 miles from city center — 0.5 miles to nearest hospital (Palliative Care)
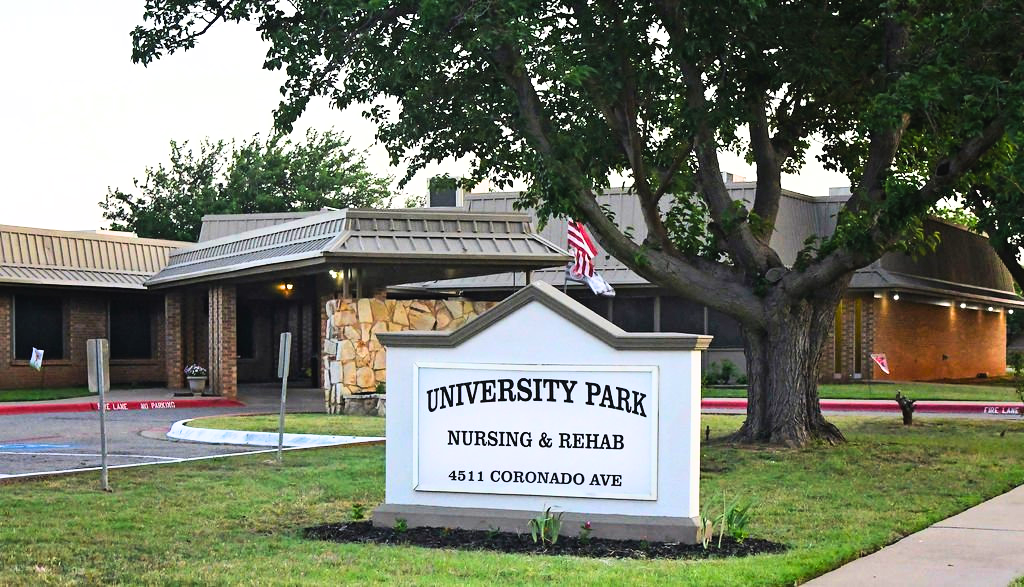
Address 4511 Coronado Ave, Wichita Falls, TX 76310

Calculate Travel Distance to University Park Nursing & Rehabilitation

Add your location

Address

Staffing Data

Source: CMS Payroll-Based Journal (Q2 2025)

128
Total Staff
126
Employees
2
Contractors
29,256
Total Hours (Quarter)
45
Avg Staff/Day
7.1
Avg Shift (hrs)
Nursing Staff Breakdown
Role Count Avg Shift (hrs) Uses Contractors?
Registered Nurse710.5 No
Licensed Practical Nurse148.5 No
Certified Nursing Assistant656.8 No
Staff by Category
Administration
2 staff
7.7hs shift avg
Nursing Staff
96 staff
7.4hs shift avg
Physicians & Practitioners
2 staff
7.9hs shift avg
Therapy Services
21 staff
4.4hs shift avg
Activities & Recreation
2 staff
5.2hs shift avg
Social Services
3 staff
2.9hs shift avg
Dietary Services
1 staff
8.3hs shift avg
Other Services
1 staff
7.8hs shift avg
Contractor Analysis
0.2%
of total hours from contractors
50 contractor hours this quarter
Occupational Therapy Aide: 1 Medical Director: 1
Role Employees Contractors Total Staff Total Hours Days Worked % of Days Avg Shift (hrs)
Certified Nursing Assistant6506515,17991100%6.8
Licensed Practical Nurse140144,75491100%8.5
Registered Nurse7071,8267077%10.5
RN Director of Nursing5051,6108391%9.1
Medication Aide/Technician5051,1938998%7.2
Speech Language Pathologist5057527481%5.7
Nurse Practitioner1016047684%7.9
Mental Health Service Worker1015126673%7.8
Dietitian1015086167%8.3
Administrator1015046369%8
Clinical Nurse Specialist1014645965%7.9
Physical Therapy Aide7074297987%3.4
Physical Therapy Assistant4043687481%4
Respiratory Therapy Technician4042244448%4.6
Qualified Social Worker3031916571%2.9
Therapeutic Recreation Specialist202891719%5.2
Occupational Therapy Aide011441112%4
Medical Director011633%2

Health Inspection History

Inspections
Total health inspections 8

Texas average 7.4


Last Health inspection on Jun 2025

Total health citations 32
Citations per inspection
4

Health citations are formal notices following inspections when they fail to comply with safety and care standards.

19 of 32 citations resulted from standard inspections; and 13 of 32 resulted from complaint investigations.

Breakdown of citation severity (last 3 years)
Critical Health citations More info 0
100% better than Texas average

Texas average: 2


Serious Health citations More info 0
100% better than Texas average

Texas average: 0.4

0 critical citations More info Texas average: 2

0 serious citations More info Texas average: 0.4

30 moderate citations More info Texas average: 23

2 minor citations More info Texas average: 0.4
Citations history (last 3 years)
Nutrition moderate citation Jun 19, 2025
Corrected

Nutrition moderate citation Jun 19, 2025
Corrected

Nutrition moderate citation Jun 19, 2025
Corrected

Nutrition moderate citation Jun 19, 2025
Corrected

Facility Characteristics

Source: CMS Long-Term Care Facility Characteristics (Data as of Jan 2026)

Ownership: For-Profit LLC
Part of: Creative Solutions in Health Care
Resident Census by Payment Source
89 Total Residents
Medicare 6 (6.7%)
Medicaid 60 (67.4%)
Private Pay/Other 23 (25.8%)
Programs & Services
Residents' Group
Family Engagement

Active councils help families stay involved in care decisions and facility operations.

Quality of care over time

These measures show how residents usually do over time at this home, based on health outcomes and preventive care.

High-risk clinical events score Info A composite score based on pressure ulcers, falls with injury, weight loss, walking ability decline, and activities of daily living decline. 11.1
29% worse than Texas average

Texas average: 8.6

Functional decline score Info A composite score based on activities of daily living decline, walking ability decline, and incontinence. 17.5
9% worse than Texas average

Texas average: 16.0

Long-stay resident measures
Need for Help with Daily Activities Increased Info Percent of long-stay residents whose need for help with daily activities has increased 18.8%
17% worse than Texas average

Texas average: 16.2%

Walking Ability Worsened Info Percent of long-stay residents whose ability to move independently worsened 19.3%
19% worse than Texas average

Texas average: 16.2%

Low Risk Residents with Bowel/Bladder Incontinence Info Percent of low risk long-stay residents who lose control of their bowels or bladder 14.3%
8% better than Texas average

Texas average: 15.7%

Falls with Major Injury Info Percent of long-stay residents experiencing one or more falls with major injury 2.1%
35% better than Texas average

Texas average: 3.2%

High Risk Residents with Pressure Ulcers Info Percent of long-stay high risk residents with pressure ulcers 4.9%
11% worse than Texas average

Texas average: 4.4%

Urinary Tract Infection Info Percent of long-stay residents with a urinary tract infection 0.3%
63% better than Texas average

Texas average: 0.8%

Lost Too Much Weight Info Percent of long-stay residents who lose too much weight 10.5%
203% worse than Texas average

Texas average: 3.5%

Depressive Symptoms Info Percent of long-stay residents who have depressive symptoms 1.3%
56% better than Texas average

Texas average: 2.9%

Antipsychotic Use Info Percent of long-stay residents who received an antipsychotic medication 2.4%
70% better than Texas average

Texas average: 7.9%

Pneumococcal Vaccine Info Percent of long-stay residents assessed and appropriately given the pneumococcal vaccine 100.0%
In line with Texas average

Texas average: 97.3%

Influenza Vaccine Info Percent of long-stay residents assessed and appropriately given the seasonal influenza vaccine 100.0%
In line with Texas average

Texas average: 97.9%

Hospitalizations per 1,000 days Info Number of hospitalizations per 1,000 long-stay resident days. 1.68
21% better than Texas average

Texas average: 2.13

ED visits per 1,000 days Info Number of outpatient emergency department visits per 1,000 long-stay resident days. 0.52
75% better than Texas average

Texas average: 2.07

Short-stay resident measures
Pneumococcal Vaccine Info Percent of short-stay residents assessed and appropriately given the pneumococcal vaccine 100.0%
11% better than Texas average

Texas average: 90.4%

Antipsychotic medication increase Info Percent of short-stay residents who newly received an antipsychotic medication 3.1%
112% worse than Texas average

Texas average: 1.4%

Influenza Vaccine Info Percent of short-stay residents assessed and appropriately given the seasonal influenza vaccine 100.0%
14% better than Texas average

Texas average: 88.0%

Re-hospitalized after SNF stay Info Percentage of short-stay residents who were re-hospitalized after their nursing home admission. 33.6%
30% worse than Texas average

Texas average: 25.9%

Emergency department visits Info Percentage of short-stay residents who had an outpatient emergency department visit. 2.1%
83% better than Texas average

Texas average: 12.0%

Falls with major injury Info Percentage of SNF residents who experience falls with major injury during their stay. 0.0%
100% better than Texas average

Texas average: 0.8%

Successful return to home or community Info Rate of successful return to home or community from a skilled nursing facility. 36.0%
29% worse than Texas average

Texas average: 50.6%

Penalties and fines

Federal penalties imposed by CMS for regulatory violations, including civil money penalties (fines) and denials of payment for new Medicare/Medicaid admissions.

Source: CMS Penalties Database (Data as of Jan 2026)

Total fines amount $10K
87% lower than Texas average

Texas average: $80K

Number of fines 1
60% fewer fines than Texas average

Texas average: 2.5

Payment Denials Info Serious action where Medicare and/or Medicaid temporarily stops payments for new residents until issues are fixed. 1
354% more payment denials than Texas average

Texas average: 0.2

Fines amount comparison
This facility $10K
Texas average $80K
Penalty History

Penalties are imposed by CMS for violations of federal nursing home regulations.

Civil Money Penalty Info Fines imposed for noncompliance, which can be assessed per day or per instance of violation. Mar 13, 2023
$10K
Payment Denial Info Serious action where Medicare and/or Medicaid temporarily stops payments for new residents until issues are fixed. Mar 13, 2023
36 days

Last updated: Jan 2026

Guides for Better Senior Living

Care Cost Calculator: See Prices in Your Area

Nursing Home Data Explorer

Don’t Wait Too Long: 7 Red Flag Signs Your Parent Needs Assisted Living Now

The True Cost of Assisted Living in 2025 – And How Families Are Paying For It

Understanding Senior Living Costs: Pricing Models, Discounts & Financial Assistance

Financial Aid for Texas Seniors

Get financial aid guidance

Community Care for the Aged and Disabled (CCAD)

TX Medicaid CCAD

Age 65+ or disabled, Texas resident, Medicaid-eligible, care need (not always nursing home level).

~$2,829/month (300% FBR, individual).

$2,000 (individual), $3,000 (couple).

Large state; rural access challenges.

Texas Community Care Services

TX CCS

Age 60+, Texas resident, at risk of decline.

~$2,000/month (individual, varies).

$5,000 (individual).

Limited funding; high demand in urban areas.

Area Agency on Aging (AAA) Services

Texas AAA Services

Age 60+, TX resident; no income/asset limits.

None; donations encouraged.

Not assessed.

28 AAAs; includes Meals on Wheels in some areas.

Medicare Savings Program (MSP)

Texas Medicare Savings Program

Age 65+ or disabled, TX resident, Medicare Part A/B.

~$2,510/month (QMB), ~$3,380/month (SLMB), ~$3,598/month (QI)—individual.

$9,430 (individual), $14,130 (couple).

Includes Extra Help for Part D; no waitlist.

Low-Income Home Energy Assistance Program (LIHEAP)

Texas Comprehensive Energy Assistance Program (CEAP)

Age 60+ prioritized, TX resident, low-income.

~$3,970/month (185% FPL).

Not assessed.

Priority for elderly/disabled; covers gas, electric, propane.

Family Caregiver Support Program (FCSP)

Texas Family Caregiver Support Program

Caregivers of 60+ needing care or 55+ caregivers of others; TX resident; 2+ ADLs.

No strict cap; prioritizes low-income (~$24,980/year).

Not assessed.

High rural demand; includes grandparent caregivers.

Senior Community Service Employment Program (SCSEP)

Texas SCSEP

Age 55+, unemployed, low-income, TX resident.

~$1,983/month (125% FPL).

Not specified.

Priority for veterans, rural residents; AARP partnership.

VA Aid and Attendance (A&A) and Housebound Benefits

Texas VA Aid and Attendance/Housebound

Age 65+ or disabled veteran/spouse, TX resident, wartime service, ADL help (A&A) or homebound.

Net income < ~$1,984/month (veteran with dependent, A&A); pension offsets income.

~$155,356 (net worth).

High veteran population; supports rural/urban needs.

Property Tax Exemption for Seniors

Texas Senior Property Tax Exemption

Age 65+, TX resident, homeowner (homestead).

None; tax-based eligibility.

Not assessed.

$25,000+ exemption; optional freeze in some counties; saves ~$500-$1,000/year.

Senior Farmers’ Market Nutrition Program (SFMNP)

Texas SFMNP

Age 60+, TX resident, low-income.

~$2,322/month (185% FPL).

Not assessed.

Vouchers (~$50/season); serves ~20,000 via 28 AAAs.

Who we are

Your Senior Care Partner, Every Step of the Way

We help families find affordable senior communities and unlock same day discounts, Medicaid, and Medicare options tailored to your needs.

Contact us Today