Villa Pueblo Senior Living Community

Villa Pueblo Senior Living Community

1111 Bonforte Blvd, Pueblo, CO 81001 View Map

Villa Pueblo Senior Living Community is a Senior Living Home in Colorado

Villa Pueblo Senior Living… is a Senior Living Home in Colorado

icon
Care Cost Calculator: See Prices in Your Area Care Cost Calculator: See Prices in Your Area icon
Overview of Villa Pueblo Senior Living Community

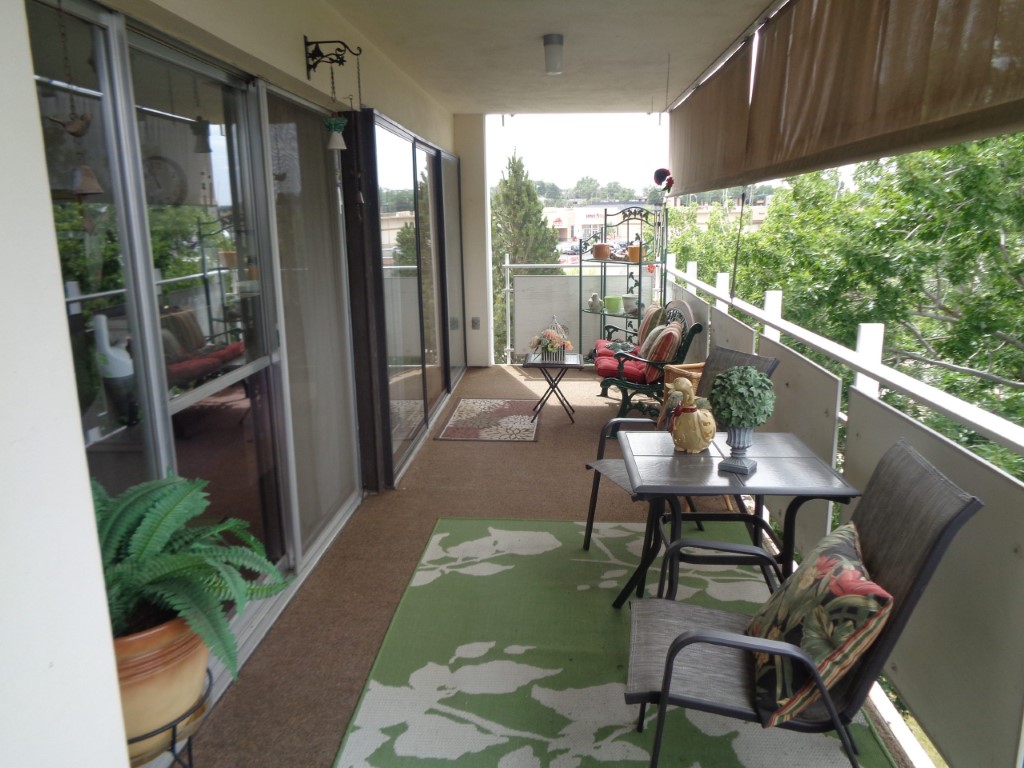
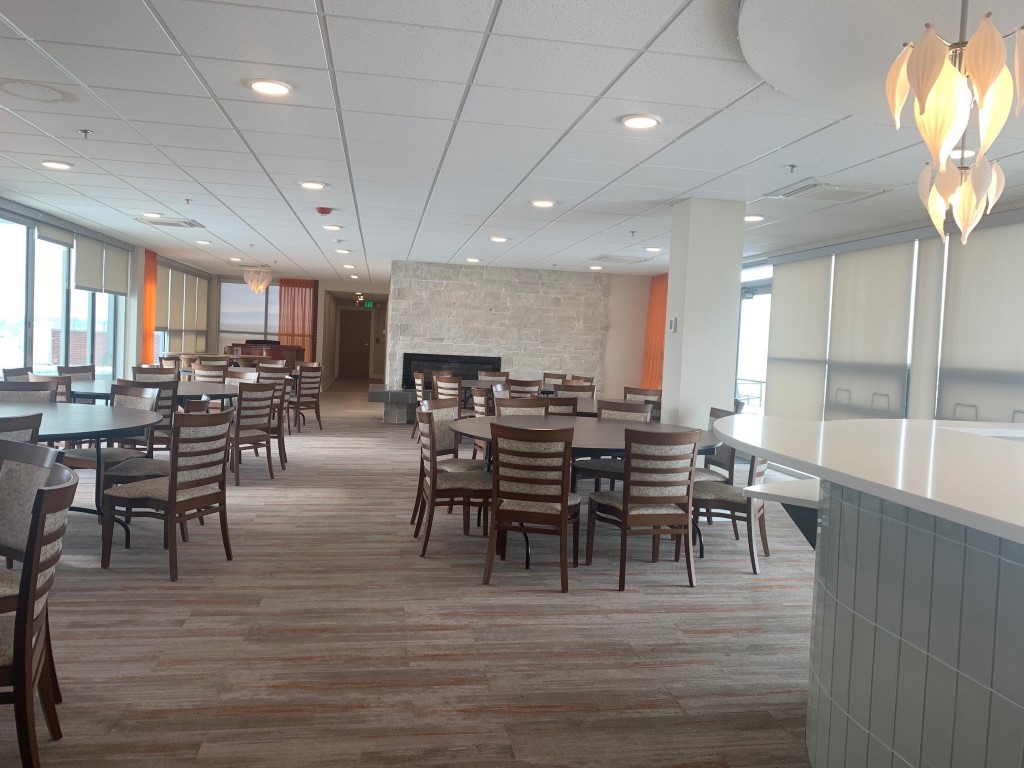
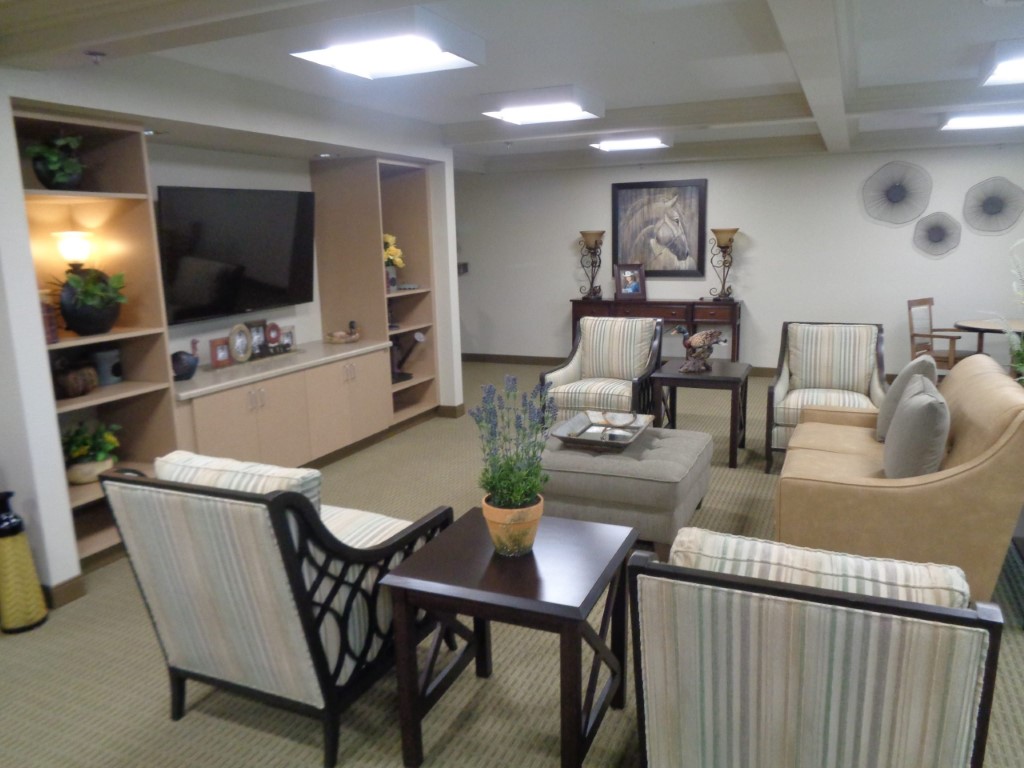
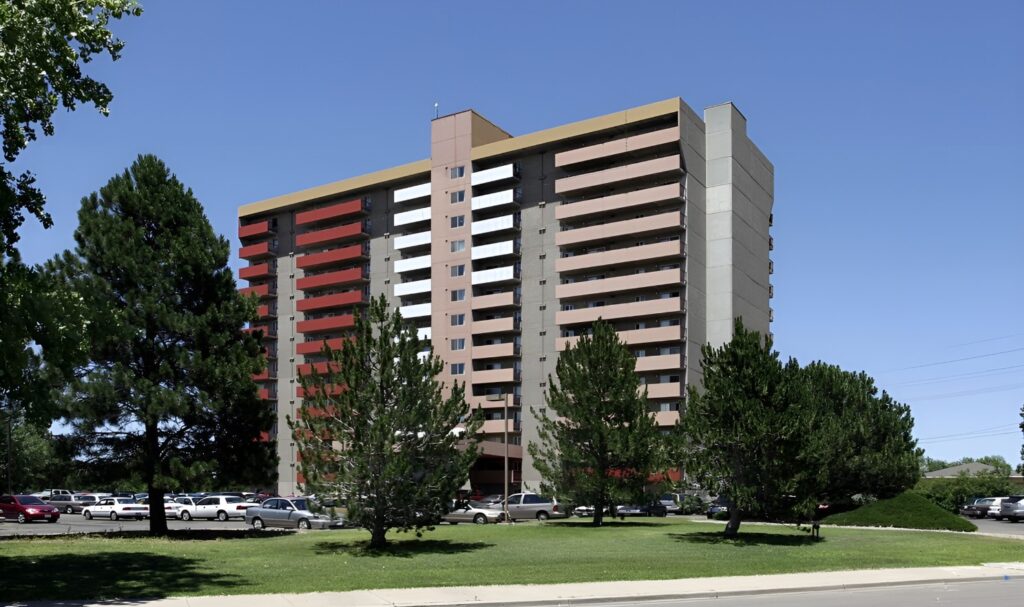
Enjoy the best of your golden years at Villa Pueblo Senior Living Community, an esteemed community in Pueblo, CO, offering independent living, assisted living, rehabilitation, and skilled nursing. With specially designed and cozy accommodations, alongside top-notch, personalized care, residents can live a comfortable and safe lifestyle. The community also promotes a vibrant and welcoming environment, so residents can feel a sense of belonging during their stay.

With many recreation places and delightful local amenities nearby, residents will not run out of things to do for leisure and wellness. Mealtimes promote social interactions and satisfy dietary needs with delightful and healthy dining options. Residents are guaranteed to thrive in retirement with the community’s dedicated care and state-of-the-art amenities.

(719) 545‑5911
Home Information PAVILION AT VILLA PUEBLO, THE
  • Occupancy levels track close to the statewide midpoint, indicating balanced availability. Bed capacity aligns with the typical community size in the state, allowing steady admissions. Residents generally stay for shorter periods than state peers, pointing to quicker turnover.

  • Home revenue ranks in the upper tier statewide, reflecting strong billing volume. Payroll spending sits in the top tier, showing a strong investment in staffing resources. Total income mirrors statewide norms, reflecting a balanced margin profile.

  • Medicare nights track the statewide midpoint, keeping volumes steady. Medicaid nights sit above most state facilities, underscoring deep Title XIX coverage. Private pay nights hover around the statewide average, supporting a diversified mix.

Occupancy
Beds
90
Occupancy
84.9%
Total Bed Days Available
36865
Avg. Length of Stay
82 days
Avg. Residents per Day
68
Finance
Home Revenue
$15,403,724.00
Payroll Costs
$5,505,343.00
Profit
$-464,767.00
Total Home Costs
$12,944,649.00
Payroll % of Revenue Info Percentage of home revenue spent on payroll costs.
35.7%
House Specifics:
CCN
65121
Owner Name
1111 BONFORTE BLVD, LLC
Rural vs. Urban
Urban
County
Pueblo
Type of Control
Voluntary Nonprofit — Church
Operations
Total Admissions
352
Total Discharges
348
% Medicaid Admissions
15%
% Medicare Admissions
45%
% Private Pay Admissions
40%
% Medicaid Discharges
13%
% Medicare Discharges
46%
% Private Pay Discharges
41%
Quality Ratings
Overall Rating Info CMS 5-star rating based on health inspections, staffing, and quality measures.
2 / 5
Health Inspection Rating Info Rating based on deficiencies found during state health inspections.
2 / 5
Staffing Rating Info Rating based on nurse staffing hours per resident per day.
2 / 5
QM Rating Info Quality Measures rating based on clinical outcomes for residents.
3 / 5
Nurse Hours / Resident / Day Info Total nurse staffing hours per resident per day.
3.40 hrs
Number of Fines
1
Medicaid, Medicare & Private
Medicare Nights Info Number of resident nights paid by Medicare for short-term or rehab care.
18549
Medicaid Nights Info Resident nights covered by Medicaid for long-term care or support services.
5264
Free Market Nights Info Nights paid privately by residents or families, without Medicare/Medicaid coverage.
6730

What does this home offer?

Check icon

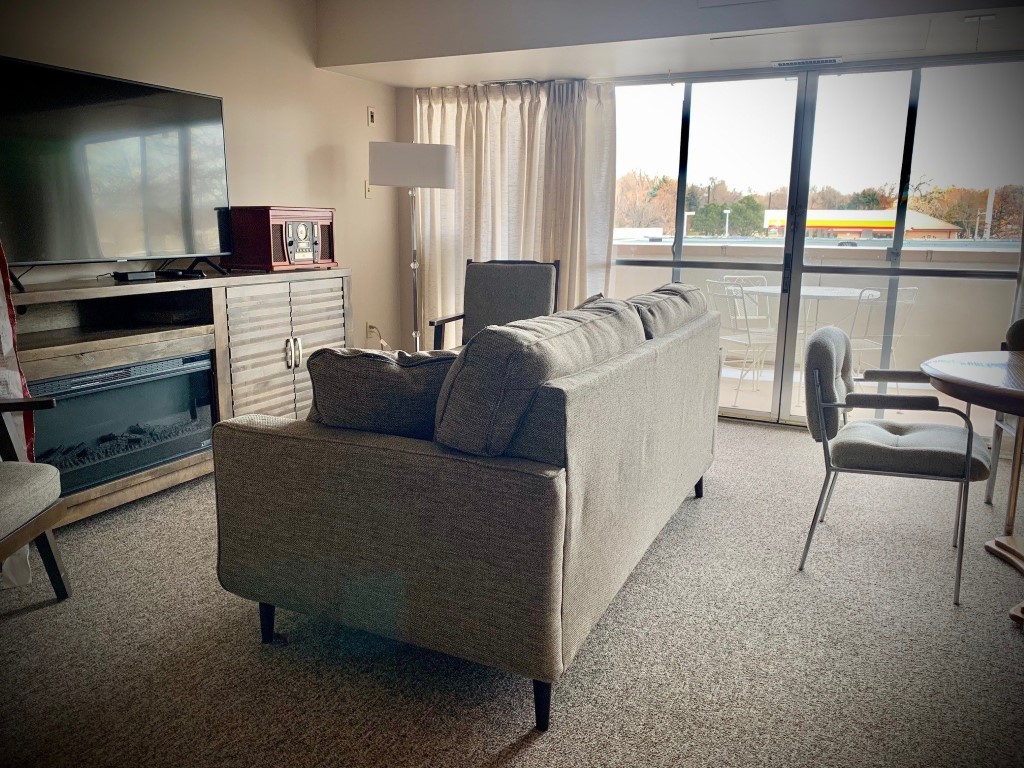
Room Sizes: 476 - 1,092 sq. ft

Check icon

Housing Options: Studio / 1 Bed / 2 Bed

Check icon

Building Type: High-rise

Check icon

Dining Services

Check icon

Beauty Services

Check icon

Transportation Services

Check icon

Housekeeping Services

Check icon

Social and Recreational Activities

Types of Care at Villa Pueblo Senior Living Community

Independent Living
Contact Villa Pueblo Senior Living Community

Places of interest near Villa Pueblo Senior Living Community

Address 2.2 miles from city center

Address 1111 Bonforte Blvd, Pueblo, CO 81001

Calculate Travel Distance to Villa Pueblo Senior Living Community

Add your location

Address

Comparison Chart

The information below is reported by the Colorado Department of Public Health and Environment, Health Facilities Division.
Compare Senior Living around Pueblo
Oakshire Trails
IL

For self-sufficient seniors seeking community and minimal assistance.

Pueblo
-
No
46
-
-
-
-
-
-
-
-
-
-
-
-
1 Bed / 2 Bed
Villa Pueblo Senior Living Community
IL

For self-sufficient seniors seeking community and minimal assistance.

Pueblo
90
No
70
1111 BONFORTE BLVD, LLC
84.9%
$15,403,724.00
$5,505,343.00
35.7%
67.80
2/5
3.4018
2/5
2/5
3/5
1
Studio / 1 Bed / 2 Bed
Richmond Senior Apartments
IL

For self-sufficient seniors seeking community and minimal assistance.

Pueblo
51
No
72
-
-
-
-
-
-
-
-
-
-
-
-
Apartments
Azteca Apartments
IL

For self-sufficient seniors seeking community and minimal assistance.

Pueblo
201
No
64
-
-
-
-
-
-
-
-
-
-
-
-
1 Bed
Presbyterian Towers
IL

For self-sufficient seniors seeking community and minimal assistance.

Pueblo
-
No
62
-
-
-
-
-
-
-
-
-
-
-
-
Studio / 1 Bed / 2 Bed

Staffing Data

Source: CMS Payroll-Based Journal (Q2 2025)

172
Total Staff
72
Employees
100
Contractors
26,156
Total Hours (Quarter)
34
Avg Staff/Day
8.5
Avg Shift (hrs)
Nursing Staff Breakdown
Role Count Avg Shift (hrs) Uses Contractors?
Registered Nurse449.4 Yes
Licensed Practical Nurse219.5 Yes
Certified Nursing Assistant838.5 Yes
Staff by Category
Administration
3 staff
7.8hs shift avg
Nursing Staff
148 staff
8.9hs shift avg
Physicians & Practitioners
3 staff
10.1hs shift avg
Therapy Services
10 staff
5.9hs shift avg
Activities & Recreation
1 staff
6.7hs shift avg
Social Services
2 staff
5.4hs shift avg
Dietary Services
4 staff
8.2hs shift avg
Other Services
1 staff
8hs shift avg
Contractor Analysis
21.3%
of total hours from contractors
5,566 contractor hours this quarter
Certified Nursing Assistant: 40 Licensed Practical Nurse: 13 Registered Nurse: 31 Physical Therapy Aide: 2 Speech Language Pathologist: 3 Physical Therapy Assistant: 1 Occupational Therapy Aide: 1 Respiratory Therapy Technician: 2 Qualified Social Worker: 2 Therapeutic Recreation Specialist: 1 Medical Director: 1 Nurse Practitioner: 2 Occupational Therapy Assistant: 1
Role Employees Contractors Total Staff Total Hours Days Worked % of Days Avg Shift (hrs)
Certified Nursing Assistant43408311,99791100%8.5
Registered Nurse1331444,29691100%9.4
Licensed Practical Nurse813213,58191100%9.5
Administrator2021,0166470%8
Other Dietary Services Staff4048976774%8.2
Nurse Practitioner0227736774%11.5
Speech Language Pathologist0337547582%6.4
Physical Therapy Assistant0115626470%8.8
Physical Therapy Aide0225366774%7
Clinical Nurse Specialist1014915864%8.5
Dental Services Staff1014725965%8
Therapeutic Recreation Specialist0113595459%6.7
Qualified Social Worker0222174044%5.4
Occupational Therapy Aide0111123640%3.1
Respiratory Therapy Technician022424044%1
Occupational Therapy Assistant011331112%3
Medical Director0111567%2.5

Health Inspection History

Source: CMS Health Citations (Jun 2021 – May 2025)

5
Inspections
26
Total Citations
1
Critical (J-L)
3
Serious (G-I)
5.2
Citations/Inspection
May 2025
Last Inspection
Citation Severity Distribution
Minor (A-C)
0
Moderate (D-F)
22
Serious (G-I)
3
Critical (J-L)
1
What do these levels mean?
Top Deficiency Categories
Quality of Life & Care
11
42% of total
Pharmacy Services
4
15% of total
Infection Control
3
12% of total
Abuse, Neglect & Exploitation
2
8% of total
Resident Rights
1
4% of total
Citation Sources
Standard Inspections 19
Complaint Investigations 8
Infection Control 1
State Comparison (CO)
Avg Citations (State)
24.8
This Facility: 26
Avg Critical (State)
0.4
This Facility: 1
Recent Citations (Last 3 Years)
DateSeverity ?CategoryTagStatus
May 15, 2025 D Abuse/NeglectF0600 Corrected
May 15, 2025 D Quality of CareF0677 Corrected
May 15, 2025 D Care PlanningF0658 Corrected
May 15, 2025 D Care PlanningF0842 Corrected
Dec 14, 2023 F Infection ControlF0880 Corrected
Dec 14, 2023 F Nursing ServicesF0725 Corrected
Dec 14, 2023 E NutritionF0812 Corrected
Dec 14, 2023 D PharmacyF0759 Corrected
Dec 14, 2023 G Quality of CareF0686 Corrected
Dec 14, 2023 D Quality of CareF0689 Corrected
Dec 14, 2023 D Quality of CareF0695 Corrected
Aug 09, 2023 F Infection ControlF0882 Corrected
Aug 09, 2023 E NutritionF0812 Corrected
Aug 09, 2023 D Quality of CareF0676 Corrected
Sep 01, 2022 E Abuse/NeglectF0600 Corrected
Sep 01, 2022 E Infection ControlF0880 Corrected
Sep 01, 2022 D PharmacyF0759 Corrected
Sep 01, 2022 D PharmacyF0760 Corrected
Sep 01, 2022 E PharmacyF0761 Corrected
Sep 01, 2022 E Quality of CareF0677 Corrected
Sep 01, 2022 G Quality of CareF0686 Corrected
Sep 01, 2022 D Quality of CareF0688 Corrected
Sep 01, 2022 G Quality of CareF0689 Corrected
Sep 01, 2022 D Quality of CareF0690 Corrected
Sep 01, 2022 D Resident RightsF0578 Corrected
Jun 09, 2021 J Quality of CareF0686 Corrected

Facility Characteristics

Source: CMS Long-Term Care Facility Characteristics (Data as of Jan 2026)

Ownership: For-Profit Corporation
Part of: Frontline
Resident Census by Payment Source
82 Total Residents
Medicare 14 (17.1%)
Medicaid 56 (68.3%)
Private Pay/Other 12 (14.6%)
Programs & Services
Residents' Group
CCRC
Family Engagement

Active councils help families stay involved in care decisions and facility operations.

Quality Measures

CMS quality measures assess care quality for long-stay and short-stay residents. Lower percentages generally indicate better outcomes for most measures.

Source: CMS Nursing Home Compare (Data as of Jan 2026)

High-Risk Clinical Events
6.7 Score
26% better than avg State avg: 9.0

Composite score based on pressure ulcers, falls with injury, weight loss, walking ability decline, and ADL decline

Functional Decline
14.6 Score
22% better than avg State avg: 18.8

Composite score based on ADL decline, walking ability decline, and incontinence

Long-Stay Resident Measures

Measures for residents who stay 101 days or more. For most measures, lower percentages indicate better care.

Need for Help with Daily Activities Increased
13.3%
Lost Too Much Weight
1.0%
Urinary Tract Infection
3.6%
Depressive Symptoms
2.8%
Falls with Major Injury
4.7%
Pneumococcal Vaccine
80.7%
Antipsychotic Use
19.1%
Walking Ability Worsened
9.1%
Influenza Vaccine
100.0%
High Risk Residents with Pressure Ulcers
5.3%
Low Risk Long-Stay Residents with Bowel/Bladder Incontinence
21.6%
Short-Stay Resident Measures

Measures for residents who stay 100 days or less (typically rehabilitation patients).

Pneumococcal Vaccine
68.5% 11% worse than avg State: 76.6%
Short-Stay Residents Who Received a New Antipsychotic Medication
0.0% 100% better than avg State: 1.4%
Influenza Vaccine
57.7% 24% worse than avg State: 75.6%

Penalties & Fines

Federal penalties imposed by CMS for regulatory violations, including civil money penalties (fines) and denials of payment for new Medicare/Medicaid admissions.

Source: CMS Penalties Database (Data as of Jan 2026)

Total Fines $29K State avg: $40K 28% better than avg
Number of Fines 1 State avg: 2.2
Compared to State Average Facility: $29K | State Avg: $40K
Penalty History

Showing all 1 penalties (Dec 2023 - Dec 2023)

Dec 14, 2023 Civil Money Penalty
$29K
Check out this article

Guides for Better Senior Living

From costs to care, explore the most important topics to make informed decisions about your future.

Claim What’s Yours: Financial Aid for Colorado Seniors

Program
State Program Name
Eligibility
Benefits
Elderly, Blind, and Disabled Waiver
Colorado Medicaid EBD Waiver
Official government program page
  • General: Age 65+ or disabled, Colorado resident, Medicaid- eligible, nursing home-level care need.
  • Income Limits (2025): ~$2,829/month (300% FBR, individual).
  • Asset Limits: $2,000 (individual), $3,000 (couple).
  • CO Specifics: Requires level-of-care assessment by case manager.
  • Services: Personal care (5-7 hours/day), respite care (up to 240 hours/year), adult day care ($65/day), home modifications ($1,500 avg.).
Old Age Pension (OAP) Health Care Program
  • General: Age 60+, Colorado resident.
  • Income Limits: ~$1,215/month (individual).
  • Asset Limits: $2,000 (individual).
  • CO Specifics: Supplements SSI; limited medical coverage.
  • Services: Cash (~$100-$800/month), limited in-home care (2-3 hours/week), medical assistance.
Program of All-Inclusive Care for the Elderly (PACE)
  • General: Age 55+, Colorado resident, nursing home-level care need, safe with PACE support.
  • Income Limits (2025): ~$2,829/month (300% FBR).
  • Asset Limits: $2,000 (individual), $3,000 (couple).
  • CO Specifics: Limited to specific regions (e.g., Denver, Pueblo).
  • Services: All-inclusive care—personal care (5-7 hours/day), meals, transportation, therapy, medical visits.
Home Care Allowance (HCA)
Colorado Home Care Allowance (HCA)
Official government program page
  • General: Seniors typically 65+, Age 5+ with disability, Colorado resident, financial/functional need.
  • Income Limits (2025): ~$1,004/month (individual, stricter than waivers).
  • Asset Limits: $2,000 (individual), $3,000 (couple).
  • CO Specifics: Must need help with ADLs; not Medicaid-waiver eligible.
  • Services: Personal care (~4-6 hours/day, paid to provider), e.g., bathing, dressing.
Senior Community Service Employment Program (SCSEP)
Colorado SCSEP (federally funded, state-administered)
Official government program page
  • General: Age 55+, unemployed, low-income, Colorado resident.
  • Income Limits (2025): ~$1,983/month (125% FPL, individual).
  • Asset Limits: Not specified; income-focused.
  • CO Specifics: Priority for veterans, rural residents.
  • Services: Paid training (~20 hours/week at ~$7.25/hour), job placement.

Claim What’s Yours Financial Aid for Colorado Seniors

Colorado Medicaid EBD Waiver

Elderly, Blind, and Disabled Waiver

Requirements:
  • General:
    Age 65+ or disabled, Colorado resident, Medicaid- eligible, nursing home-level care need.
  • Income Limits (2025):
    ~$2,829/month (300% FBR, individual).
  • Asset Limits:
    $2,000 (individual), $3,000 (couple).
  • CO Specifics:
    Requires level-of-care assessment by case manager.
Benefits without Contact:
  • Services: Personal care (5-7 hours/day), respite care (up to 240 hours/year), adult day care ($65/day), home modifications ($1,500 avg.).
Colorado OAP

Old Age Pension (OAP) Health Care Program

Requirements:
  • General:
    Age 60+, Colorado resident.
  • Income Limits:
    ~$1,215/month (individual).
  • Asset Limits:
    $2,000 (individual).
  • CO Specifics:
    Supplements SSI; limited medical coverage.
Benefits without Contact:
  • Services: Cash (~$100-$800/month), limited in-home care (2-3 hours/week), medical assistance.
Colorado Medicaid PACE

Program of All-Inclusive Care for the Elderly (PACE)

Requirements:
  • General:
    Age 55+, Colorado resident, nursing home-level care need, safe with PACE support.
  • Income Limits (2025):
    ~$2,829/month (300% FBR).
  • Asset Limits:
    $2,000 (individual), $3,000 (couple).
  • CO Specifics:
    Limited to specific regions (e.g., Denver, Pueblo).
Benefits without Contact:
  • Services: All-inclusive care—personal care (5-7 hours/day), meals, transportation, therapy, medical visits.
Colorado Home Care Allowance (HCA)

Home Care Allowance (HCA)

Requirements:
  • General:
    Seniors typically 65+, Age 5+ with disability, Colorado resident, financial/functional need.
  • Income Limits (2025):
    ~$1,004/month (individual, stricter than waivers).
  • Asset Limits:
    $2,000 (individual), $3,000 (couple).
  • CO Specifics:
    Must need help with ADLs; not Medicaid-waiver eligible.
Benefits without Contact:
  • Services: Personal care (~4-6 hours/day, paid to provider), e.g., bathing, dressing.
Colorado SCSEP (federally funded, state-administered)

Senior Community Service Employment Program (SCSEP)

Requirements:
  • General:
    Age 55+, unemployed, low-income, Colorado resident.
  • Income Limits (2025):
    ~$1,983/month (125% FPL, individual).
  • Asset Limits:
    Not specified; income-focused.
  • CO Specifics:
    Priority for veterans, rural residents.
Benefits without Contact:
  • Services: Paid training (~20 hours/week at ~$7.25/hour), job placement.
Who we are

Your Senior Care Partner, Every Step of the Way

We help families find affordable senior communities and unlock same day discounts, Medicaid, and Medicare options tailored to your needs.

Contact us Today