Villa Pueblo Senior Living Community
Nursing Home & Independent Living · Colorado, CO
CMS overall rating Info CMS (the Centers for Medicare & Medicaid Services) is the federal agency that rates nursing home quality. Its Overall Rating runs from 1 to 5 stars, combining health inspections, staffing, and quality measures, with inspections weighted most heavily.

Villa Pueblo Senior Living Community

Nursing Home & Independent Living · Colorado, CO
CMS overall rating Info CMS (the Centers for Medicare & Medicaid Services) is the federal agency that rates nursing home quality. Its Overall Rating runs from 1 to 5 stars, combining health inspections, staffing, and quality measures, with inspections weighted most heavily.
Calculator: See prices in your area
Villa Pueblo Senior Living Community accepts Medicare, Medicaid, and private pay.

Overview of Villa Pueblo Senior Living Community

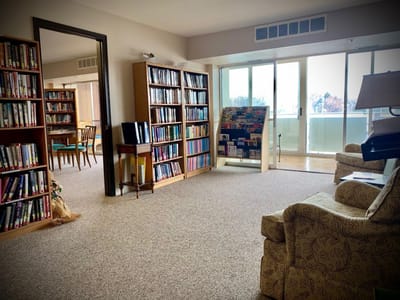
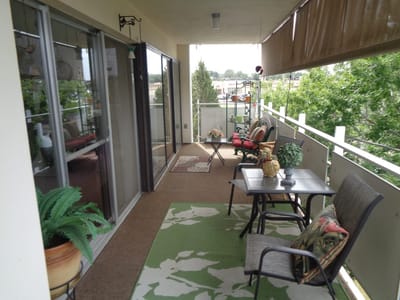
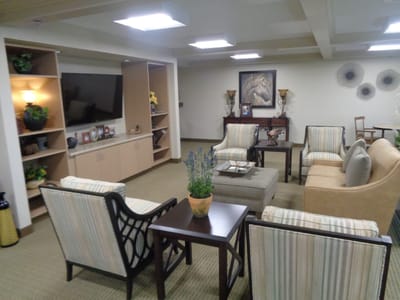
Enjoy the best of your golden years at Villa Pueblo Senior Living Community, an esteemed community in Pueblo, CO, offering independent living, assisted living, rehabilitation, and skilled nursing. With specially designed and cozy accommodations, alongside top-notch, personalized care, residents can live a comfortable and safe lifestyle. The community also promotes a vibrant and welcoming environment, so residents can feel a sense of belonging during their stay.

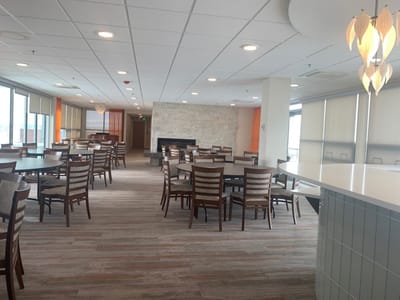
With many recreation places and delightful local amenities nearby, residents will not run out of things to do for leisure and wellness. Mealtimes promote social interactions and satisfy dietary needs with delightful and healthy dining options. Residents are guaranteed to thrive in retirement with the community’s dedicated care and state-of-the-art amenities.

(719) 545-5911

Quality ratings

Measured by Centers for Medicare & Medicaid Services (CMS)

Overall rating Info The Overall CMS Rating combines results from health inspections, staffing levels and quality measures. Health inspections carry the most weight. Staffing and quality scores can increase or decrease the final rating based on performance compared to state and national standards.
▼ 36.4% Below CO avg. ▼ 36.4% Below CO avg.Click the badge to see the full State ranking.Click here to see the full State ranking.
Health Inspection Info Based on the results of the facility's three most recent standard inspections and any complaint investigations. CMS reviews the number, scope, and severity of deficiencies, with more recent findings weighted more heavily.
▼ 27.8% Below CO avg. ▼ 27.8% Below CO avg.Click the badge to see the full State ranking.Click here to see the full State ranking.
Staffing Info Measures average nursing staff hours per resident per day, including Registered Nurses (RNs) and total nursing staff. Ratings are adjusted based on the level of care residents require and are compared to state and national benchmarks.
▼ 34.2% Below CO avg. ▼ 34.2% Below CO avg.Click the badge to see the full State ranking.Click here to see the full State ranking.
Quality Measures Info Based on clinical and physical health indicators reported to CMS, such as hospital readmissions, falls, pressure ulcers, and improvements in mobility. These measures reflect how well residents' health needs are being managed.
▼ 27.7% Below CO avg. ▼ 27.7% Below CO avg.Click the badge to see the full State ranking.Click here to see the full State ranking.

Staffing hours breakdown

Info Daily nursing hours per resident by staff type, reported to CMS. Higher is generally better — compare this facility to state and national averages to see where staffing stands.

Hours per resident per day — compared to Colorado state averages

Total nursing care / resident Info This home is ranked 121st out of 177 homes in Colorado for nurse hours. Total adjusted nursing hours per resident per day, combining RN, LPN, and aide time. CMS adjusts this for case-mix so facilities can be fairly compared.
3h 24m per day
Rank #121 / 177Nurse hours — State benchmarkedThis home is ranked 121st out of 177 homes in Colorado for nurse hours. Shows adjusted nurse hours per resident per day benchmarked to the Colorado average, with a ranking across 177 Colorado SNFs. More hours mean more direct care. The national average is about 3.5 hrs; below 3.0 is a red flag.Click the rank badge to see the full State ranking.Click here to see the full State ranking.
This facility Colorado avg (3h 52m per day)
vs Colorado avg
-12%

1 of 1 metrics below state avg

Staff typeHours / Day / Residentvs state avg
Weekend Total Nursing Info Combined nursing hours (RN + LPN + Nurse Aide) per resident per day on weekends. Staffing often drops on weekends — this figure reveals whether the facility maintains adequate coverage outside of weekday hours. 3h 4m per day ▼ 6% State avg: 3h 15m per day · National avg: 3h 25m per day

Capacity and availability

This home usually has limited availability

Higher occupancy than the Colorado average: 76.5%
Occupancy rate
86.5% Rank #55 / 185Occupancy rate — State benchmarkedThis home is ranked 55th out of 185 homes in Colorado for occupancy rate. Shows this facility's occupancy rate versus the Colorado average, with its Statewide rank out of 185. Higher occupancy signals strong local demand and financial stability.Click the rank badge to see the full State ranking.Click here to see the full State ranking.
Avg. Length of Stay
85 days
Walk Score
Walk Score: 70 / 100 Rank #227 / 874Walk Score — State benchmarkedThis home is ranked 227th out of 874 homes in Colorado for walk score. Shows how walkable this facility's neighborhood is compared to the average Walk Score across Colorado SNFs. Higher scores benefit residents, families, and staff.Click the rank badge to see the full State ranking.Click here to see the full State ranking.
Very walkable. Most errands can be accomplished on foot, and many essentials are within a short walk.

Contact Villa Pueblo Senior Living Community

Staffing Data

Reporting period: October 1 – December 31, 2025 (Q4 2025). Source: CMS Payroll-Based Journal report.

Total staff 166
Employees 70
Contractors 96
Staff to resident ratio 2.02 : 1
8% more staff per resident than Colorado average
Colorado average ratio: 1.88 : 1 Colorado average ratio: 1.88 : 1See full Colorado ranking
Avg staff/day 33
Average shift 8.6 hours
0% compared with Colorado average
Colorado average: 8.3 hours Colorado average shift: 8.3 hoursSee full Colorado ranking
Total staff hours (quarter) 26,096

Nursing staff breakdown

Q4 2025 · Oct 1 – Dec 31 More info This data comes from the CMS Payroll-Based Journal report covering October 1 – December 31, 2025.
Registered Nurse

Manages medical care and health needs.

RN Staff Info 32 total: 14 full-time employees and 18 contractors. 32
Average shift length Info Average shift length. Calculated as total hours divided by days worked and average staff per day. 9.7 hours
Licensed Practical Nurse

Assists with medical care and medications.

LPN Staff Info 23 total: 9 full-time employees and 14 contractors. 23
Average shift length Info Average shift length. Calculated as total hours divided by days worked and average staff per day. 9.8 hours
Certified Nursing Assistant

Helps with daily care and mobility.

CNA Staff Info 89 total: 41 full-time employees and 48 contractors. 89
Average shift length Info Average shift length. Calculated as total hours divided by days worked and average staff per day. 8.7 hours

Contractor staffing

Q4 2025 · Oct 1 – Dec 31 More info This data comes from the CMS Payroll-Based Journal report covering October 1 – December 31, 2025.

Total hours from contractors

18.4%

4,795 contractor hours this quarter

Certified Nursing Assistant: 48 Registered Nurse: 18 Licensed Practical Nurse: 14 Speech Language Pathologist: 3 Physical Therapy Aide: 2 Physical Therapy Assistant: 2 Respiratory Therapy Technician: 2 Medical Director: 2 Occupational Therapy Aide: 1 Nurse Practitioner: 1 Occupational Therapy Assistant: 1 Qualified Social Worker: 1 Therapeutic Recreation Specialist: 1

Staff by category

Q4 2025 · Oct 1 – Dec 31 More info This data comes from the CMS Payroll-Based Journal report covering October 1 – December 31, 2025.
Certified Nursing Assistant41488913,36392100%8.7
Registered Nurse1418324,38192100%9.7
Licensed Practical Nurse914233,17392100%9.8
Clinical Nurse Specialist2021,0287076%8.3
Physical Therapy Aide0227816470%6.9
Speech Language Pathologist0337677076%7
Other Dietary Services Staff2026206773%7.4
Administrator1014826267%7.8
Nurse Practitioner0114324549%9.6
Physical Therapy Assistant0224075964%6.9
Dental Services Staff1014005054%8
Therapeutic Recreation Specialist011971617%6.1
Occupational Therapy Aide011762022%3.8
Respiratory Therapy Technician022414650%0.9
Occupational Therapy Assistant0113889%4.8
Medical Director0221089%1.3
Qualified Social Worker011211%1.6
89 Certified Nursing Assistant
% of Days 100%
32 Registered Nurse
% of Days 100%
23 Licensed Practical Nurse
% of Days 100%
2 Clinical Nurse Specialist
% of Days 76%
2 Physical Therapy Aide
% of Days 70%
3 Speech Language Pathologist
% of Days 76%
2 Other Dietary Services Staff
% of Days 73%
1 Administrator
% of Days 67%
1 Nurse Practitioner
% of Days 49%
2 Physical Therapy Assistant
% of Days 64%
1 Dental Services Staff
% of Days 54%
1 Therapeutic Recreation Specialist
% of Days 17%
1 Occupational Therapy Aide
% of Days 22%
2 Respiratory Therapy Technician
% of Days 50%
1 Occupational Therapy Assistant
% of Days 9%
2 Medical Director
% of Days 9%
1 Qualified Social Worker
% of Days 1%

Penalties and fines

Includes penalties issued in 2023

Federal penalties imposed by CMS for regulatory violations, including civil money penalties (fines) and denials of payment for new Medicare/Medicaid admissions.

Source: CMS Penalties Database (Data as of Jan 2026)

Total fines amount $29K Rank #127 / 182Federal fines — State benchmarkedThis home is ranked 127th out of 182 homes in Colorado for federal fines. Shows this facility's cumulative CMS federal fine dollars versus the Colorado average among facilities with fines, and where it ranks among 182 skilled nursing facilities in the pool. Lower total dollars mean a better rank.Click the rank badge to see the full State ranking.Click here to see the full State ranking.
28% lower than Colorado average

Colorado average: $40K

Number of fines 1
55% fewer fines than Colorado average

Colorado average: 2.2

Payment Denials Info Serious action where Medicare and/or Medicaid temporarily stops payments for new residents until issues are fixed. 0
100% fewer payment denials than Colorado average

Colorado average: 0.3

Fines amount comparison
This facility $29K
Colorado average $40K
Penalty History

Penalties are imposed by CMS for violations of federal nursing home regulations.

1 penalty in the past 3 years

Dec 14, 2023 · $29K

Civil Money Penalty Info Fines imposed for noncompliance, which can be assessed per day or per instance of violation. Dec 14, 2023
$29K

Last updated: Jan 2026

Quality of care over time

These measures show how residents usually do over time at this home, based on health outcomes and preventive care.

High-risk clinical events score Info A composite score based on pressure ulcers, falls with injury, weight loss, walking ability decline, and activities of daily living decline. 6.7
26% better than Colorado average

Colorado average: 9.0

Functional decline score Info A composite score based on activities of daily living decline, walking ability decline, and incontinence. 14.6
22% better than Colorado average

Colorado average: 18.8

Long-stay resident measures
Need for Help with Daily Activities Increased Info Percent of long-stay residents whose need for help with daily activities has increased 13.3%
17% better than Colorado average

Colorado average: 16.0%

Walking Ability Worsened Info Percent of long-stay residents whose ability to move independently worsened 9.1%
47% better than Colorado average

Colorado average: 17.0%

Low Risk Residents with Bowel/Bladder Incontinence Info Percent of low risk long-stay residents who lose control of their bowels or bladder 21.6%
7% better than Colorado average

Colorado average: 23.2%

Falls with Major Injury Info Percent of long-stay residents experiencing one or more falls with major injury 4.7%
42% worse than Colorado average

Colorado average: 3.3%

High Risk Residents with Pressure Ulcers Info Percent of long-stay high risk residents with pressure ulcers 5.3%
37% worse than Colorado average

Colorado average: 3.9%

Urinary Tract Infection Info Percent of long-stay residents with a urinary tract infection 3.6%
151% worse than Colorado average

Colorado average: 1.4%

Lost Too Much Weight Info Percent of long-stay residents who lose too much weight 1.0%
81% better than Colorado average

Colorado average: 5.2%

Depressive Symptoms Info Percent of long-stay residents who have depressive symptoms 2.8%
61% better than Colorado average

Colorado average: 7.2%

Antipsychotic Use Info Percent of long-stay residents who received an antipsychotic medication 19.1%
In line with Colorado average

Colorado average: 18.8%

Pneumococcal Vaccine Info Percent of long-stay residents assessed and appropriately given the pneumococcal vaccine 80.7%
13% worse than Colorado average

Colorado average: 93.3%

Influenza Vaccine Info Percent of long-stay residents assessed and appropriately given the seasonal influenza vaccine 100.0%
6% better than Colorado average

Colorado average: 94.7%

Short-stay resident measures
Pneumococcal Vaccine Info Percent of short-stay residents assessed and appropriately given the pneumococcal vaccine 68.5%
11% worse than Colorado average

Colorado average: 76.6%

Antipsychotic medication increase Info Percent of short-stay residents who newly received an antipsychotic medication 0.0%
100% better than Colorado average

Colorado average: 1.4%

Influenza Vaccine Info Percent of short-stay residents assessed and appropriately given the seasonal influenza vaccine 57.7%
24% worse than Colorado average

Colorado average: 75.6%

Breakdown by payment type

Medicare

44% of new residents, usually for short-term rehab.

Typical stay 1 - 2 months

Private pay

43% of new residents, often for short stays.

Typical stay 1 - 2 months

Medicaid

13% of new residents, often for long-term daily care.

Typical stay 1 years

Facility Characteristics

Source: CMS Long-Term Care Facility Characteristics (Data as of Jan 2026)

Total residents 82
Medicare
14
17.1% of residents
Medicaid
56
68.3% of residents
Private pay or other
12
14.6% of residents
Programs & Services
Residents Group

Residents meet regularly to discuss policies, care quality, and activities

CCRC

Part of a Continuing Care Retirement Community offering multiple care levels

Active Resident Council

Organized group of residents that meets regularly to discuss facility policies, quality of life, and activities.

Finances and operations

Voluntary non-profit community
Home revenue
$16.6M
Surplus of revenue
$941.7K
Voluntary non-profit community
Home revenue
$16.6M Rank #41 / 182Revenue — State benchmarkedThis home is ranked 41st out of 182 homes in Colorado for revenue. Shows this facility's annual revenue compared to the Colorado SNF average. Higher revenue generally means more resources for staffing and capital — read alongside Payroll %.Click the rank badge to see the full State ranking.Click here to see the full State ranking.
Surplus of revenue
$941.7K
Payroll costs Info The portion of the home's budget spent on staff, including nurses, caregivers, and other employees who support care and operations. Rank #70 / 182Payroll — State benchmarkedThis home is ranked 70th out of 182 homes in Colorado for payroll. Shows total annual staff payroll benchmarked to the Colorado average. Higher payroll investment relative to peers often signals better staffing and less reliance on cheaper contract labor.Click the rank badge to see the full State ranking.Click here to see the full State ranking.
$7.0M
41.9% of revenue Rank #149 / 182Payroll % — State benchmarkedThis home is ranked 149th out of 182 homes in Colorado for payroll %. Shows payroll as a percentage of revenue versus the Colorado average. Well-run Colorado SNFs typically land around 59–66% — the top third Statewide. Below 25% may signal understaffing or heavy agency use — read with Staffing ratings.Click the rank badge to see the full State ranking.Click here to see the full State ranking.
Other operating costs Info All remaining costs needed to run the home, such as food, utilities, building maintenance, supplies and administrative expenses.
$8.7M
Total costs $15.7M

What does this home offer?

Room sizes icon
Room sizes icon

Room Sizes: 476 - 1,092 sq. ft

Housing options icon

Housing Options: Studio / 1 Bed / 2 Bed

Building type icon
Building type icon

Building Type: High-rise

Beauty services icon

Beauty Services

Transportation services icon

Transportation Services

Housekeeping icon
Housekeeping icon

Housekeeping Services

Social and recreational activities icon

Social and Recreational Activities

Who this home usually serves

TYPE OF STAY

Mostly short-term rehab stays

Most residents typically stay for a few weeks or months before returning home or moving on.

Places of interest near Villa Pueblo Senior Living Community

Address 2.2 miles from city center Info Estimated distance in miles from Pueblo's city center to Villa Pueblo Senior Living Community's address, calculated via Google Maps.

Calculate Travel Distance to Villa Pueblo Senior Living Community

Add your location

Address

Financial Assistance for
Nursing Home in Colorado

Villa Pueblo Senior Living Community is located in Pueblo, Colorado.
Here are the financial assistance programs available to residents in Colorado.

Get Financial aid guidance

Elderly, Blind, and Disabled Waiver

Colorado Medicaid EBD Waiver

Age 65+ or disabled
General Colorado resident, Medicaid- eligible, nursing home-level care need.
Income Limits (2025) ~$2,829/month 300% FBR, individual
Asset Limits $2,000 (individual), $3,000 (couple).
CO

Requires level-of-care assessment by case manager.

Benefits
Personal care (5-7 hours/day) Respite care (up to 240 hours/year) Adult day care ($65/day) Home modifications ($1,500 avg.)

Old Age Pension (OAP) Health Care Program

Colorado OAP

Age 60+
General Colorado resident.
Income Limits ~$1,215/month individual
Asset Limits $2,000 individual
CO

Supplements SSI; limited medical coverage.

Benefits
Cash (~$100-$800/month) Limited in-home care (2-3 hours/week) Medical assistance

Program of All-Inclusive Care for the Elderly (PACE)

Colorado Medicaid PACE

Age 55+
General Colorado resident, nursing home-level care need, safe with PACE support.
Income Limits (2025) ~$2,829/month 300% FBR
Asset Limits $2,000 (individual), $3,000 (couple).
CO

Limited to specific regions (e.g., Denver, Pueblo).

Benefits
All-inclusive care—personal care (5-7 hours/day) Meals Transportation Therapy Medical visits

Home Care Allowance (HCA)

Colorado Home Care Allowance (HCA)

Age
General Seniors typically 65+, Age 5+ with disability, Colorado resident, financial/functional need.
Income Limits (2025) ~$1,004/month individual, stricter than waivers
Asset Limits $2,000 (individual), $3,000 (couple).
CO

Must need help with ADLs; not Medicaid-waiver eligible.

Benefits
Personal care (~4-6 hours/day, paid to provider) E.g. Bathing Dressing

Frequently Asked Questions about Villa Pueblo Senior Living Community

What neighborhood is Villa Pueblo Senior Living Community in?

Villa Pueblo Senior Living Community is in the Belmont neighborhood.

Is Villa Pueblo Senior Living Community in a walkable area?

Villa Pueblo Senior Living Community has a walk score of 70. Very walkable. Most errands can be accomplished on foot, and many essentials are within a short walk.

Are there photos of Villa Pueblo Senior Living Community?

Yes — there are 6 photos of Villa Pueblo Senior Living Community in the photo gallery on this page.

What is the address of Villa Pueblo Senior Living Community?

Villa Pueblo Senior Living Community is located at 1111 Bonforte Blvd, Pueblo, CO 81001.

What is the phone number of Villa Pueblo Senior Living Community?

(719) 545-5911 will put you in contact with the team at Villa Pueblo Senior Living Community.

Is Villa Pueblo Senior Living Community Medicare or Medicaid certified?

Yes — Villa Pueblo Senior Living Community is a CMS-certified provider of Medicare and Medicaid.

Guides for Better Senior Living

Care Cost Calculator: See Prices in Your Area

Nursing Home Data Explorer

Don’t Wait Too Long: 7 Red Flag Signs Your Parent Needs Assisted Living Now

The True Cost of Assisted Living in 2025 – And How Families Are Paying For It

Understanding Senior Living Costs: Pricing Models, Discounts & Financial Assistance

Explore Open Rooms
1 Contact details
2 What type of senior care service are you looking for?
3 What budget do you have in mind for senior care?
4 How soon do you need to find care?
5 Additional details

Thank you for your interest!

Our team will be in touch shortly to help with next steps.