Occupancy rate
94%

We arrange tours, appointments, and even moving support so you don’t have to
Thank you for your interest!
Our team will be in touch shortly to help with next steps.


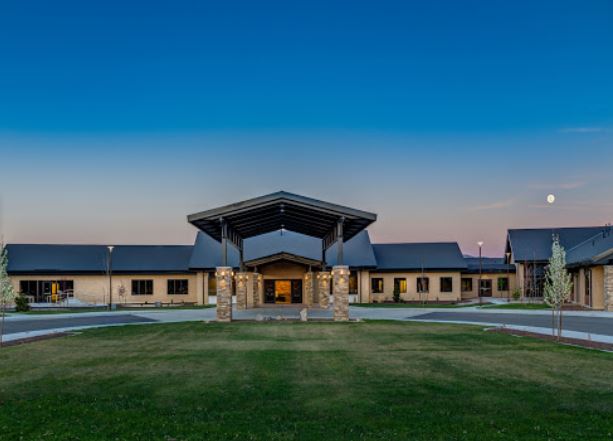
Located in Sparks, Nevada, Wingfield Skilled Nursing and Rehabilitation Center offers dedicated nursing and rehabilitation services. Housing 120 beds, this facility operates round-the-clock, prioritizing health, safety, rehabilitation, and diet. The staff of over 70 members includes Certified Nursing Aids, Registered Nurses, Licensed Vocational Nurses, Dietitians, Physicians, and Social Workers, among others.
High turnover rates are a significant concern in many US nursing home facilities, but Wingfield is committed to change. The center actively invests in employee education, development, and growth. It offers various benefits, educational opportunities, and wellness programs. Under new management, Wingfield aims to support nursing staff to enhance patient care, forecasting remarkable improvements in the coming months.
Kaitlyn Nickoli serves as the Administrator at Wingfield Skilled Nursing And Rehabilitation Center. She oversees rehabilitation, post discharge planning, behavioral health, and activities & life enrichment, ensuring comprehensive care and support for residents.
Offers a balance of services and community atmosphere.
Occupancy is moderate, suggesting balanced demand.
Most residents typically stay for a few weeks or months before returning home or moving on.
48% of new residents, usually for short-term rehab.
34% of new residents, often for short stays.
18% of new residents, often for long-term daily care.
Wingfield Skilled Nursing And Rehabilitation Center is administrated by KAITLYN MODINA.
In Nevada, the Department of Health and Human Services, Bureau of Health Care Quality and Compliance performs unannounced onsite surveys to evaluate resident safety and care quality.
Deficiencies indicate regulatory issues. A higher number implies the facility had several areas requiring improvement.
Nevada average 5.1
Last Health inspection on Dec 2024
Nevada average 36.2
Nevada average 7.08
Health citations are formal notices following inspections when they fail to comply with safety and care standards.
47 of 56 citations resulted from standard inspections; and 9 of 56 resulted from complaint investigations.
Nevada average: 0.1
Nevada average: 0.5
Data sourced from CMS Health Deficiencies reports. Citation severity codes range from A (least serious) to L (most serious). Immediate Jeopardy (J-L) citations indicate situations where the facility's noncompliance has placed residents at risk of death or serious harm.
Nursing Home Licensed facility providing 24/7 skilled nursing care for residents with complex, ongoing medical needs. Staffed by RNs, LPNs, and CNAs. Inspected and star-rated annually by CMS. Accepts Medicare (short-term rehab) and Medicaid (long-term care).
Assisted Living A licensed, long-term care setting for seniors or individuals with disabilities who need help with daily activities — like bathing, dressing, and medication management — but not 24-hour skilled nursing. Offers housing, meals, and around-the-clock support while aiming to maximize resident independence.
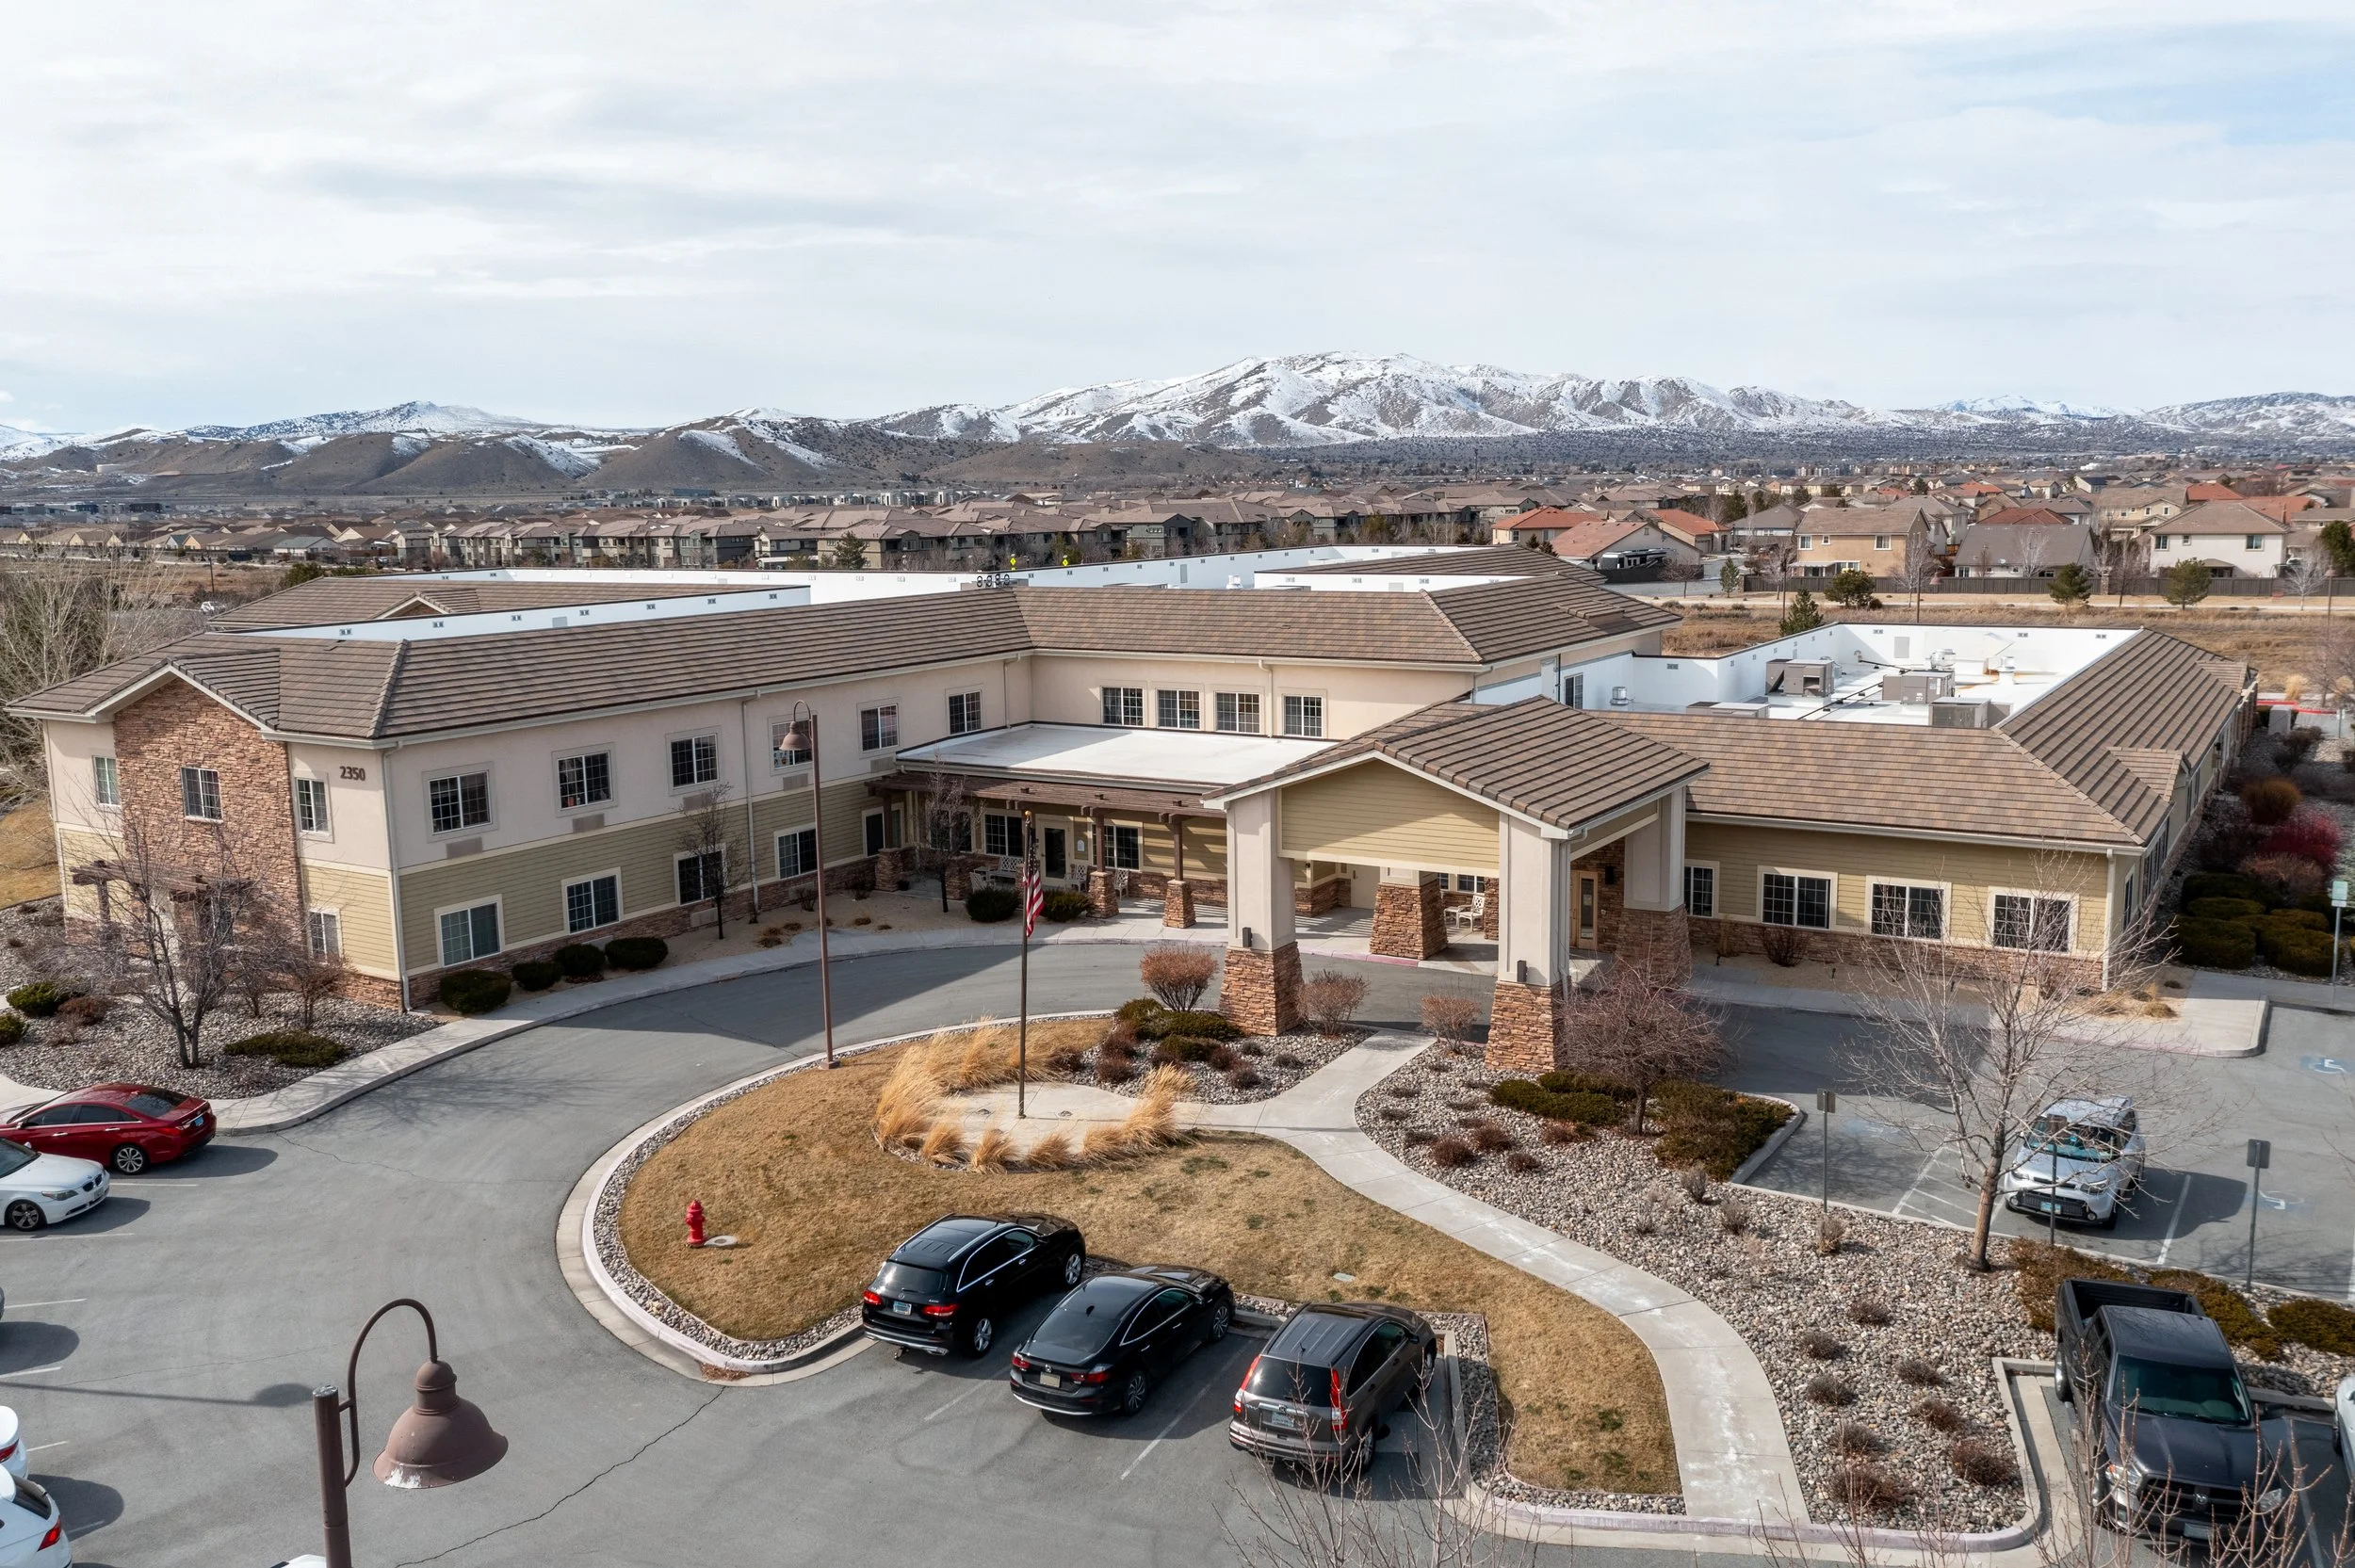
![]() 8.1 miles from city center — 4.52 miles to nearest hospital (Reno Clinical Trials)
8.1 miles from city center — 4.52 miles to nearest hospital (Reno Clinical Trials)
![]() 2350 Wingfield Hills Rd, Sparks, NV 89436
2350 Wingfield Hills Rd, Sparks, NV 89436
Add your location
This data corresponds to Q2 2025 and is based on CMS Payroll-Based Journal.
Nevada average ratio: 1.57:1
Nevada average: 8.8 hours
Manages medical care and health needs.
No contractors work on this role.
Assists with medical care and medications.
No contractors work on this role.
Helps with daily care and mobility.
No contractors work on this role.
Total hours from contractors
762 contractor hours this quarter
| Certified Nursing Assistant | 58 | 0 | 58 | 18,224 | 91 | 100% | 9.4 |
| Licensed Practical Nurse | 23 | 0 | 23 | 8,489 | 91 | 100% | 10 |
| Registered Nurse | 18 | 0 | 18 | 5,124 | 91 | 100% | 8.7 |
| Nurse Aide in Training | 9 | 0 | 9 | 1,722 | 87 | 96% | 8 |
| Qualified Social Worker | 3 | 0 | 3 | 1,504 | 70 | 77% | 7.8 |
| Mental Health Service Worker | 2 | 0 | 2 | 1,008 | 64 | 70% | 8 |
| Physical Therapy Assistant | 3 | 0 | 3 | 998 | 70 | 77% | 7.5 |
| Speech Language Pathologist | 2 | 1 | 3 | 835 | 74 | 81% | 6.5 |
| Respiratory Therapy Technician | 3 | 0 | 3 | 633 | 68 | 75% | 7.8 |
| Nurse Practitioner | 1 | 0 | 1 | 496 | 62 | 68% | 8 |
| Dietitian | 1 | 0 | 1 | 490 | 62 | 68% | 7.9 |
| Administrator | 1 | 0 | 1 | 464 | 58 | 64% | 8 |
| Other Dietary Services Staff | 1 | 0 | 1 | 461 | 57 | 63% | 8.1 |
| Physical Therapy Aide | 2 | 0 | 2 | 339 | 75 | 82% | 4.5 |
| Dental Services Staff | 2 | 0 | 2 | 283 | 37 | 41% | 7.6 |
| Occupational Therapy Aide | 0 | 1 | 1 | 153 | 30 | 33% | 5.1 |
| Medical Director | 0 | 1 | 1 | 52 | 13 | 14% | 4 |
| Occupational Therapy Assistant | 0 | 1 | 1 | 52 | 13 | 14% | 4 |
Source: CMS Long-Term Care Facility Characteristics (Data as of Jan 2026)
Residents meet regularly to discuss policies, care quality, and activities
Organized group of residents that meets regularly to discuss facility policies, quality of life, and activities.
Data sourced from CMS Long-Term Care Facility Characteristics quarterly report. Payer mix reflects the current resident census by primary payment source.
These measures show how residents usually do over time at this home, based on health outcomes and preventive care.
Nevada average: 9.7
Nevada average: 17.5
Nevada average: 15.6%
Nevada average: 20.8%
Nevada average: 16.9%
Nevada average: 2.5%
Nevada average: 5.5%
Nevada average: 1.4%
Nevada average: 5.4%
Nevada average: 4.2%
Nevada average: 14.1%
Nevada average: 91.0%
Nevada average: 89.6%
Nevada average: 1.82
Nevada average: 1.50
Nevada average: 83.9%
Nevada average: 2.0%
Nevada average: 80.7%
Nevada average: 23.4%
Nevada average: 9.8%
Nevada average: 0.8%
Nevada average: 53.7%
Nevada average: 50.6%
Quality measures are calculated from Minimum Data Set (MDS) assessments. For most measures, lower percentages indicate better care quality.
Federal penalties imposed by CMS for regulatory violations, including civil money penalties (fines) and denials of payment for new Medicare/Medicaid admissions.
Source: CMS Penalties Database (Data as of Jan 2026)
Nevada average: $34K
Nevada average: 1.4
Nevada average: 0.1
Penalties are imposed by CMS for violations of federal nursing home regulations.
Last updated: Jan 2026
Historical financial and operational data for Wingfield Skilled Nursing And Rehabilitation Center based on CMS SNF Cost Reports.
Loading trend charts...
Care Cost Calculator: See Prices in Your Area
Nursing Home Data Explorer
Don’t Wait Too Long: 7 Red Flag Signs Your Parent Needs Assisted Living Now
The True Cost of Assisted Living in 2025 – And How Families Are Paying For It
Understanding Senior Living Costs: Pricing Models, Discounts & Financial Assistance

Touring a community? Use this expert-backed checklist to stay organized, ask the right questions, and find the perfect fit.
We'll send you a PDF version of the touring checklist.