Total health inspections
7
Florida average 4.3
Last Health inspection on Sep 2025

We arrange tours, appointments, and even moving support so you don’t have to


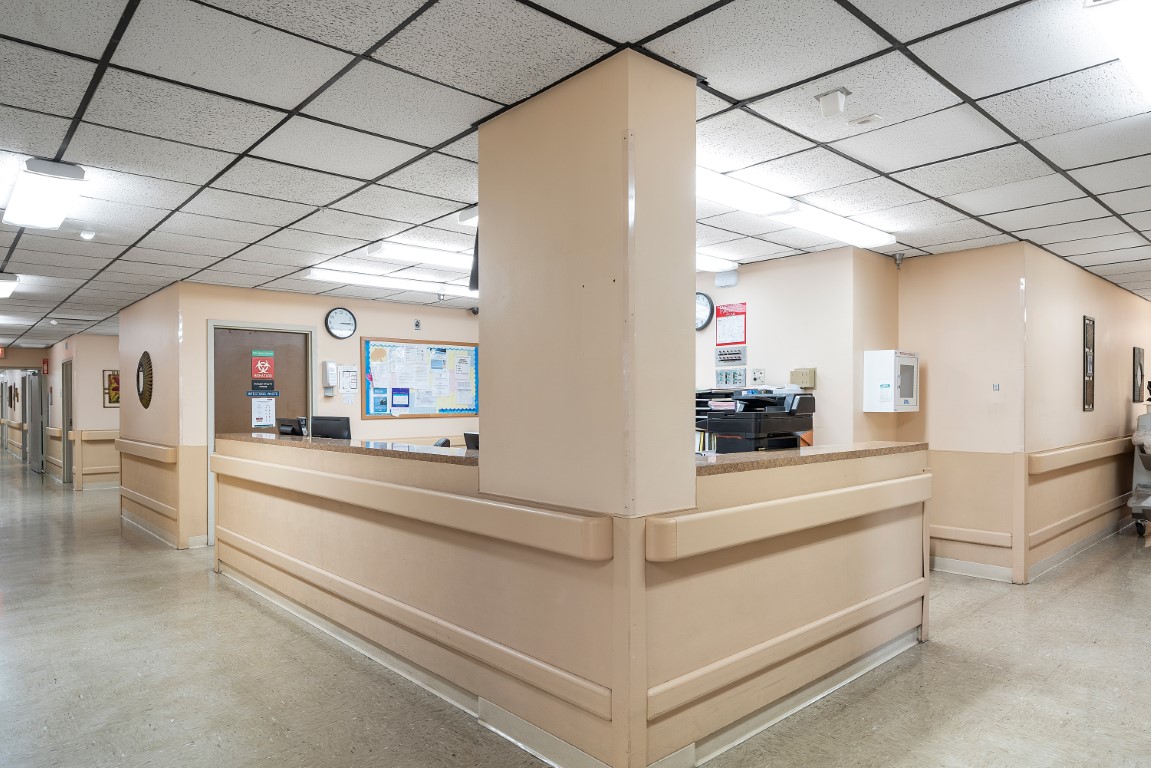


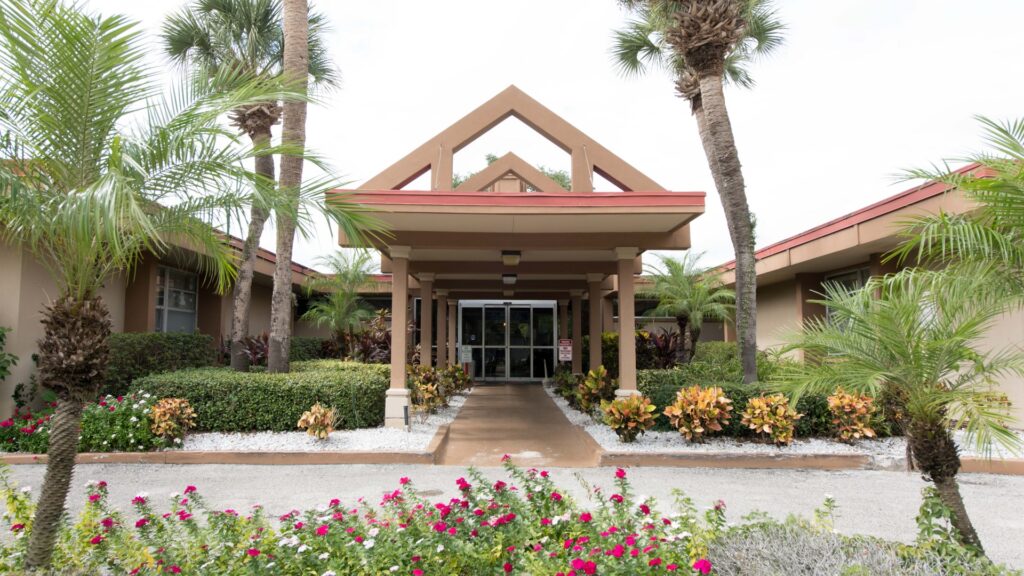
Experience the best care with Winter Garden Rehabilitation and Nursing Center, an outstanding community located in the harmonious neighborhood of Winter Garden, FL, that offers short-term rehabilitation and long-term care. With a wide range of care options, including post-surgical care, respite care, palliative care, and wound care, residents can find the care they need. A kind and highly skilled team helps residents with their day-to-day activities and personal needs 24/7, ensuring a maintenance-free lifestyle.
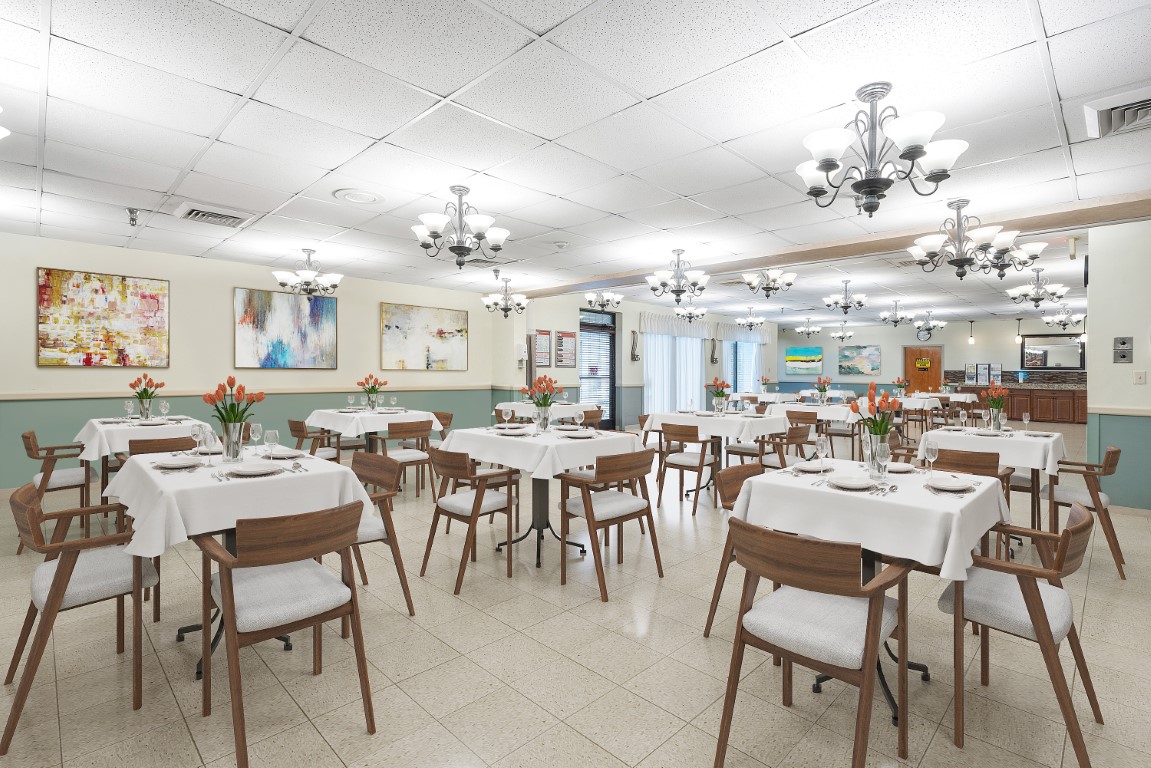
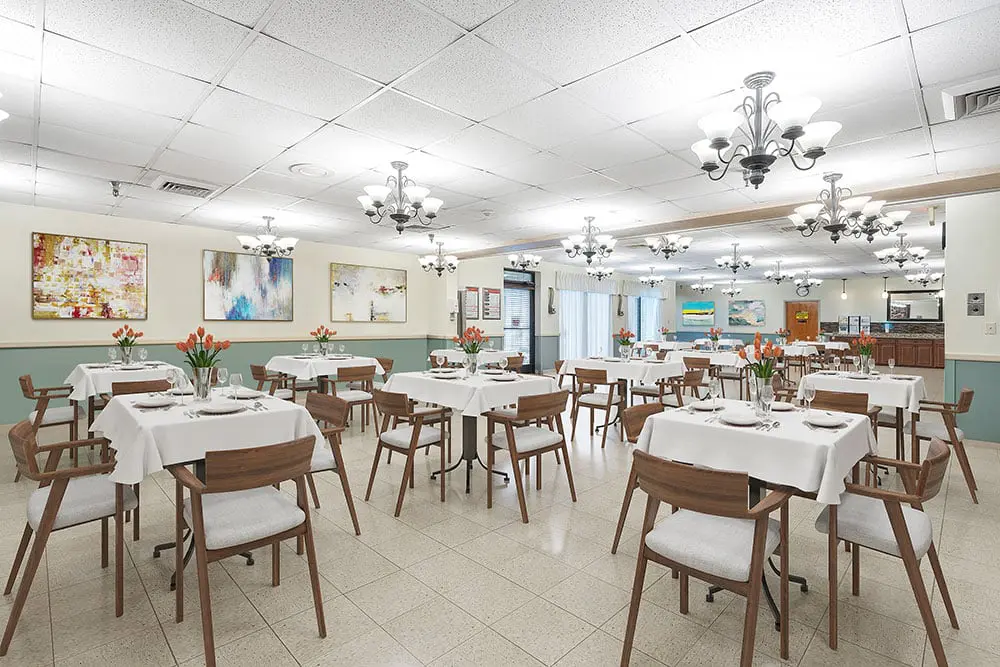
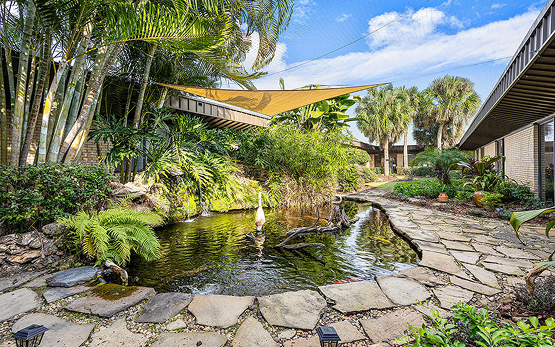
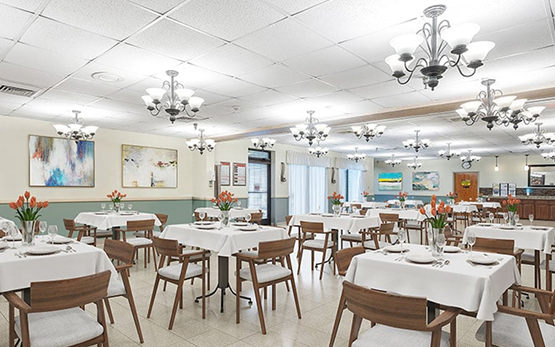
Residents are encouraged to live actively and happily with a variety of fun recreational activities and engaging social programs to ensure holistic wellness. Here, residents enjoy fine dining with delightful and nutritious meals that satisfy their dietary needs and preferences. The community is a great option for those looking to heal from a condition and spend their golden years without worries, especially with its specially designed amenities.
 Official CMS rating based on health inspections, staffing and quality measures.
Official CMS rating based on deficiencies found during state health inspections.
Official CMS rating based on nurse staffing hours per resident per day.
Official CMS rating based on clinical outcomes for residents.
Average daily nursing hours per resident (adjusted for acuity). Higher values indicate more nursing time per resident.
Hours of care per resident per day, broken down by staff type. Data from CMS Medicare.
Registered nurse hours per resident per day.
Official CMS rating based on health inspections, staffing and quality measures.
Official CMS rating based on deficiencies found during state health inspections.
Official CMS rating based on nurse staffing hours per resident per day.
Official CMS rating based on clinical outcomes for residents.
Average daily nursing hours per resident (adjusted for acuity). Higher values indicate more nursing time per resident.
Hours of care per resident per day, broken down by staff type. Data from CMS Medicare.
Registered nurse hours per resident per day.
Occupancy is moderate, suggesting balanced demand.
Residents typically stay for brief periods, with frequent admissions and discharges throughout the year.
25% of new residents, usually for short-term rehab.
62% of new residents, often for short stays.
13% of new residents, often for long-term daily care.
The portion of the home's budget spent on staff, including nurses, caregivers, and other employees who support care and operations.
All remaining costs needed to run the home, such as food, utilities, building maintenance, supplies and administrative expenses.
Accept Medicaid: Yes
Total Residents: 108 Residents
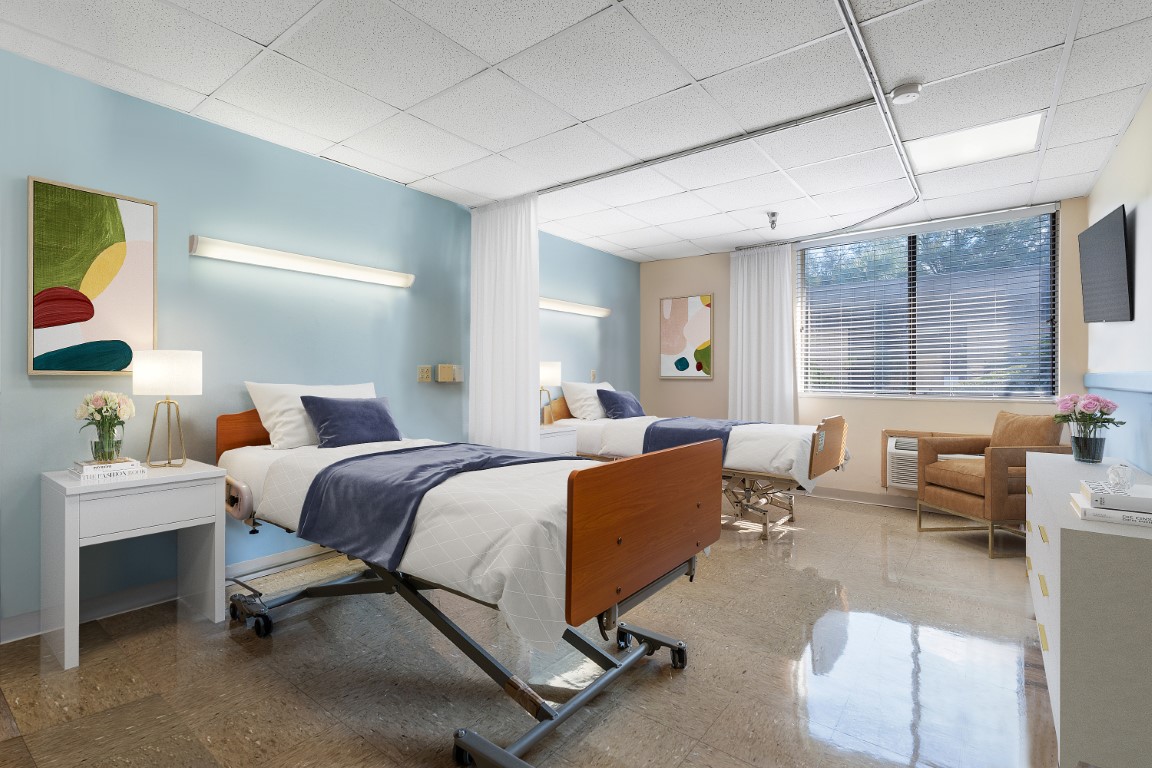
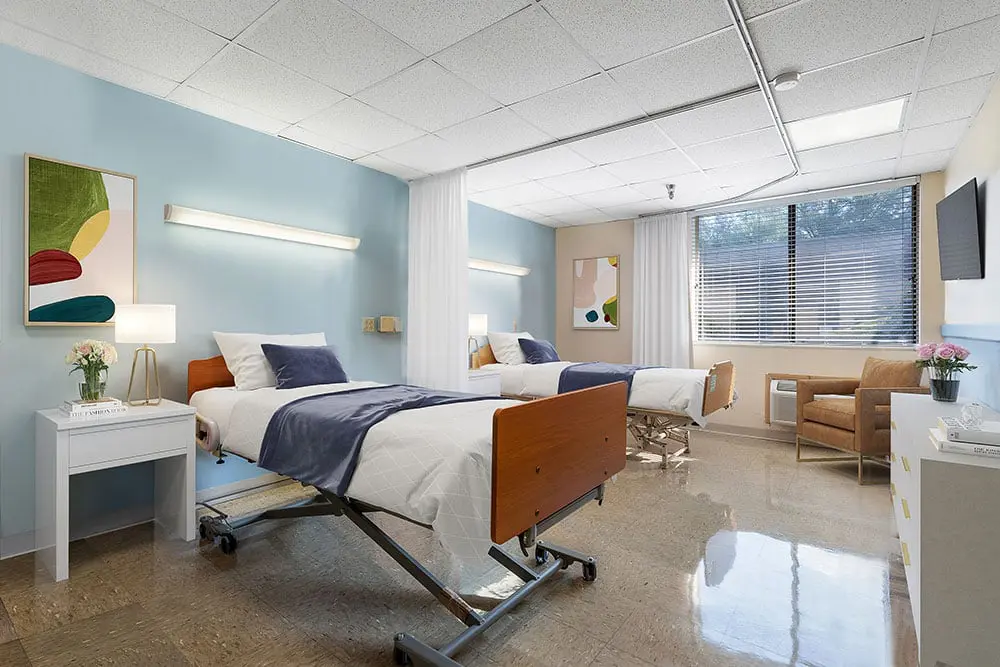
Housing Options: Private / Semi-private Rooms
Building Type: Single-story
Dining Services
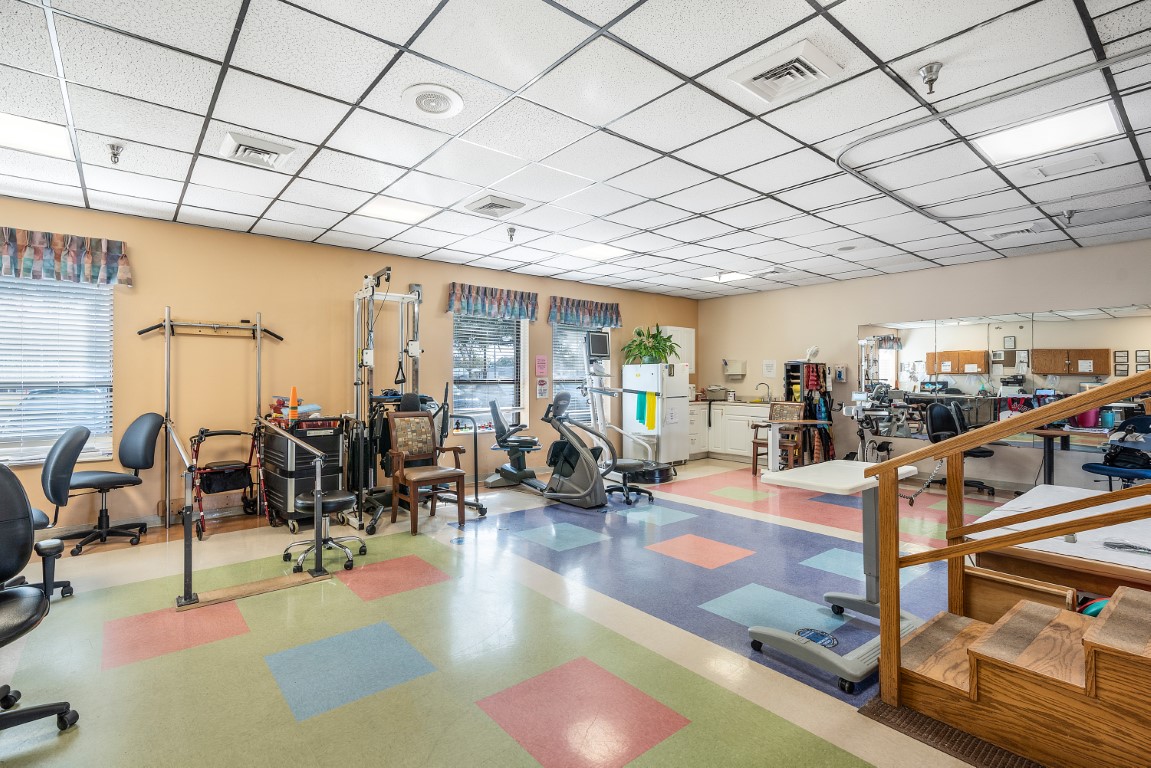
Recreational Activities
Florida average 4.3
Last Health inspection on Sep 2025
Health citations are formal notices following inspections when they fail to comply with safety and care standards.
18 of 25 citations resulted from standard inspections; and 7 of 25 resulted from complaint investigations.
Florida average: 0.8
Florida average: 0.4
Data sourced from CMS Health Deficiencies reports. Citation severity codes range from A (least serious) to L (most serious). Immediate Jeopardy (J-L) citations indicate situations where the facility's noncompliance has placed residents at risk of death or serious harm.
Nursing Homes 24/7 care needed
Respite Care
Nursing Homes 24/7 care needed
Hospice Care
Nursing Homes 24/7 care needed
Respite Care
Nursing Homes 24/7 care needed
Nursing Homes 24/7 care needed
 Tuskawilla Nursing and Rehab Center
 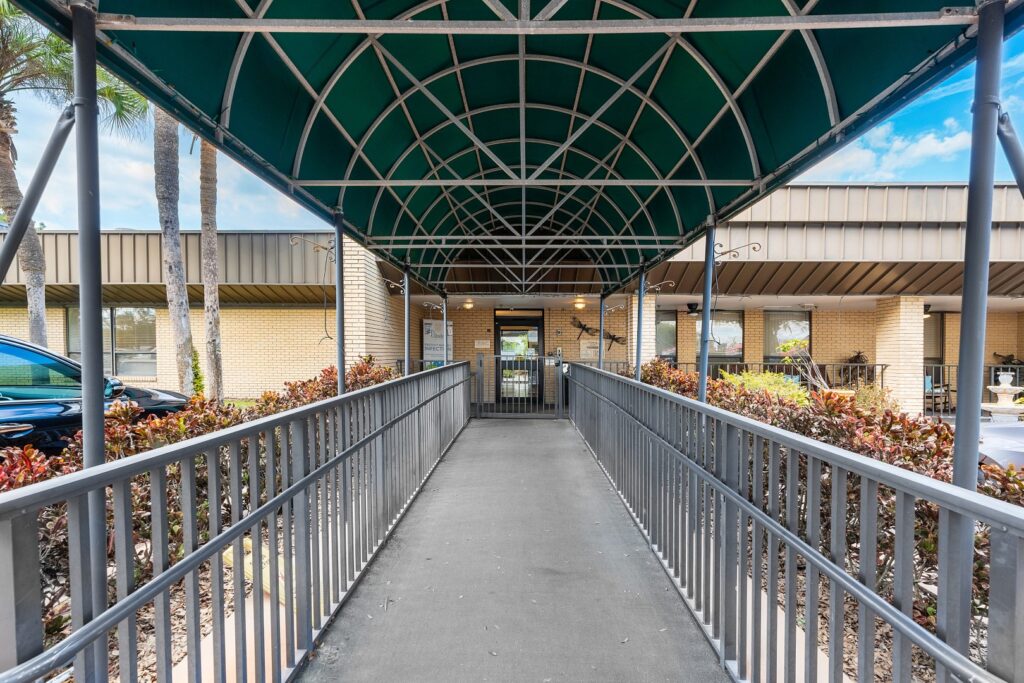 Winter Garden Rehabilitation and Nursing Center
 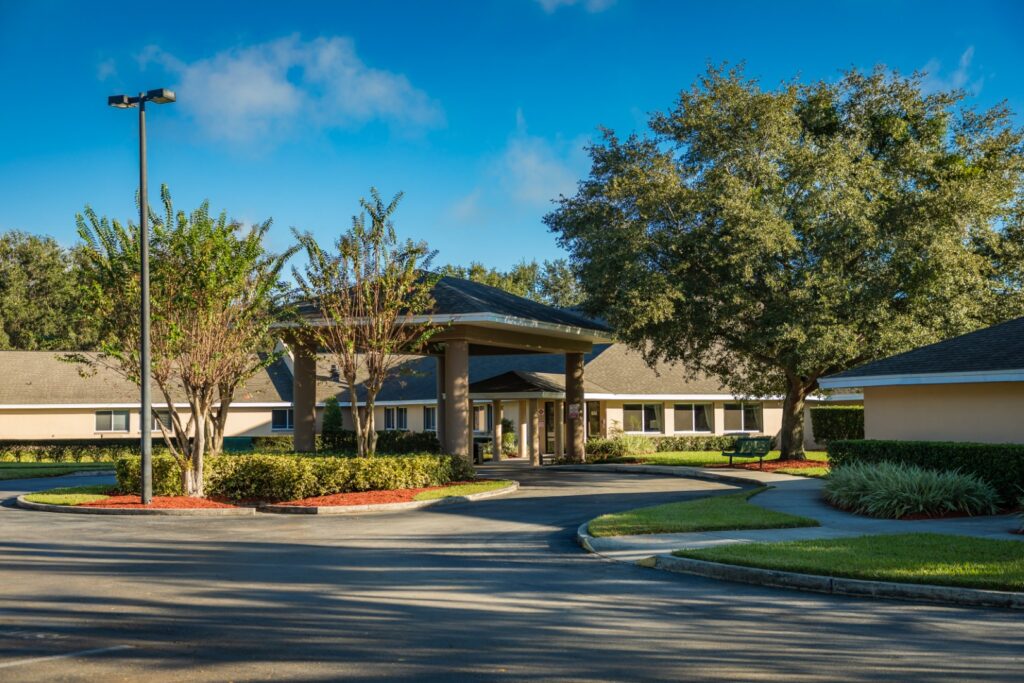 Lake Bennet Center for Rehabilitation and Healing
 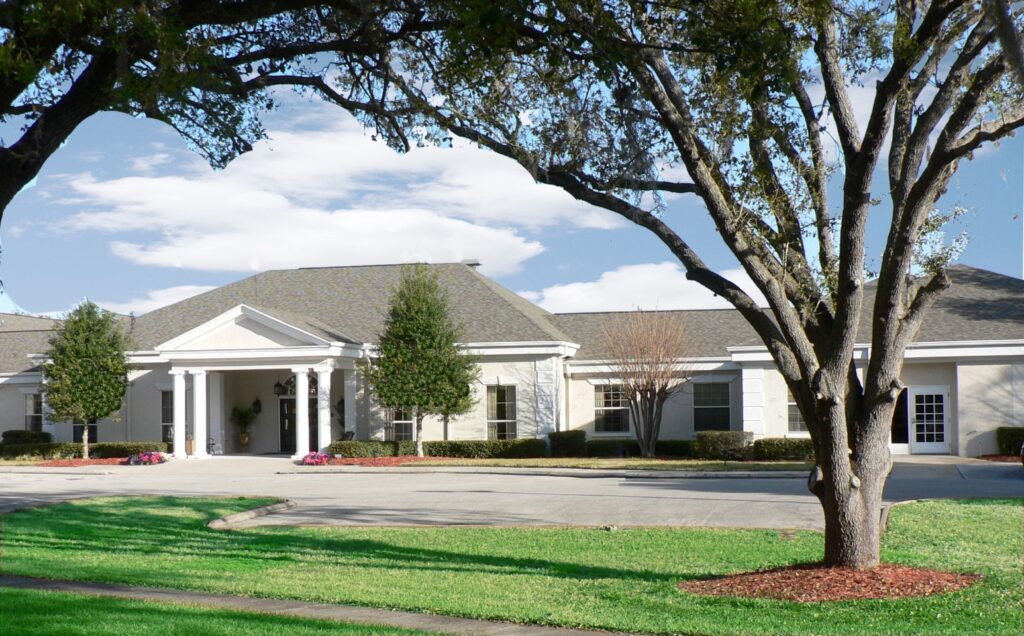 Conway Lakes Health & Rehabilitation
![]() 2.3 miles from city center
2.3 miles from city center
![]() 12751 W Colonial Dr, Winter Garden, FL 34787
12751 W Colonial Dr, Winter Garden, FL 34787
Add your location
Source: CMS Payroll-Based Journal (Q2 2025)
| Role ⓘ | Count ⓘ | Avg Shift (hrs) ⓘ | Uses Contractors? ⓘ |
|---|---|---|---|
| Registered Nurse | 13 | 9 | No |
| Licensed Practical Nurse | 22 | 9.2 | No |
| Certified Nursing Assistant | 70 | 8.3 | No |
| Role ⓘ | Employees ⓘ | Contractors ⓘ | Total Staff ⓘ | Total Hours ⓘ | Days Worked ⓘ | % of Days ⓘ | Avg Shift (hrs) ⓘ |
|---|---|---|---|---|---|---|---|
| Certified Nursing Assistant | 70 | 0 | 70 | 19,053 | 91 | 100% | 8.3 |
| Licensed Practical Nurse | 22 | 0 | 22 | 8,155 | 91 | 100% | 9.2 |
| Registered Nurse | 13 | 0 | 13 | 3,262 | 91 | 100% | 9 |
| Clinical Nurse Specialist | 5 | 2 | 7 | 1,807 | 73 | 80% | 7.2 |
| Dietitian | 11 | 0 | 11 | 1,535 | 86 | 95% | 7.3 |
| Respiratory Therapy Technician | 7 | 0 | 7 | 1,086 | 77 | 85% | 7.2 |
| Speech Language Pathologist | 3 | 0 | 3 | 960 | 68 | 75% | 7.3 |
| Physical Therapy Aide | 4 | 0 | 4 | 919 | 67 | 74% | 7.3 |
| Physical Therapy Assistant | 3 | 0 | 3 | 559 | 66 | 73% | 7.6 |
| Administrator | 2 | 0 | 2 | 528 | 64 | 70% | 8 |
| RN Director of Nursing | 2 | 1 | 3 | 523 | 67 | 74% | 7.3 |
| Mental Health Service Worker | 1 | 0 | 1 | 496 | 62 | 68% | 8 |
| Nurse Practitioner | 1 | 0 | 1 | 488 | 62 | 68% | 7.9 |
| Dental Services Staff | 1 | 0 | 1 | 403 | 59 | 65% | 6.8 |
| Qualified Social Worker | 3 | 0 | 3 | 366 | 63 | 69% | 5.6 |
| Occupational Therapy Aide | 1 | 1 | 2 | 119 | 15 | 16% | 8 |
| Medical Director | 0 | 1 | 1 | 33 | 65 | 71% | 0.5 |
Source: CMS Long-Term Care Facility Characteristics (Data as of Jan 2026)
Residents meet regularly to discuss policies, care quality, and activities
Family members meet regularly to discuss policies, care quality, and activities
Organized group of family members that meets regularly to discuss facility policies, resident care, and activities.
Organized group of residents that meets regularly to discuss facility policies, quality of life, and activities.
Data sourced from CMS Long-Term Care Facility Characteristics quarterly report. Payer mix reflects the current resident census by primary payment source.
These measures show how residents usually do over time at this home, based on health outcomes and preventive care.
Florida average: 7.4
Florida average: 12.4
Florida average: 10.5%
Florida average: 12.9%
Florida average: 13.5%
Florida average: 2.6%
Florida average: 5.4%
Florida average: 0.9%
Florida average: 6.0%
Florida average: 3.3%
Florida average: 8.0%
Florida average: 97.7%
Florida average: 99.2%
Florida average: 2.10
Florida average: 1.18
Florida average: 94.0%
Florida average: 1.5%
Florida average: 94.7%
Florida average: 26.2%
Florida average: 9.3%
Florida average: 0.8%
Florida average: 53.7%
Florida average: 50.6%
Quality measures are calculated from Minimum Data Set (MDS) assessments. For most measures, lower percentages indicate better care quality.
Historical financial and operational data for Winter Garden Rehabilitation and Nursing Center based on CMS SNF Cost Reports.
Loading trend charts...
Care Cost Calculator: See Prices in Your Area
Nursing Home Data Explorer
Don’t Wait Too Long: 7 Red Flag Signs Your Parent Needs Assisted Living Now
The True Cost of Assisted Living in 2025 – And How Families Are Paying For It
Understanding Senior Living Costs: Pricing Models, Discounts & Financial Assistance

Touring a community? Use this expert-backed checklist to stay organized, ask the right questions, and find the perfect fit.
We'll send you a PDF version of the touring checklist.