Explore Open Rooms
1 Contact details
2 What type of senior care service are you looking for?
3 What budget do you have in mind for senior care?
4 How soon do you need to find care?
5 Additional details

Thank you for your interest!

Our team will be in touch shortly to help with next steps.

Nursing Home in Crystal Falls

CMS overall rating Info The Overall CMS Rating combines results from health inspections, staffing levels and quality measures. Health inspections carry the most weight. Staffing and quality scores can increase or decrease the final rating based on performance compared to state and national standards.

Iron County Medical Care Facility

Overview of Iron County Medical Care Facility

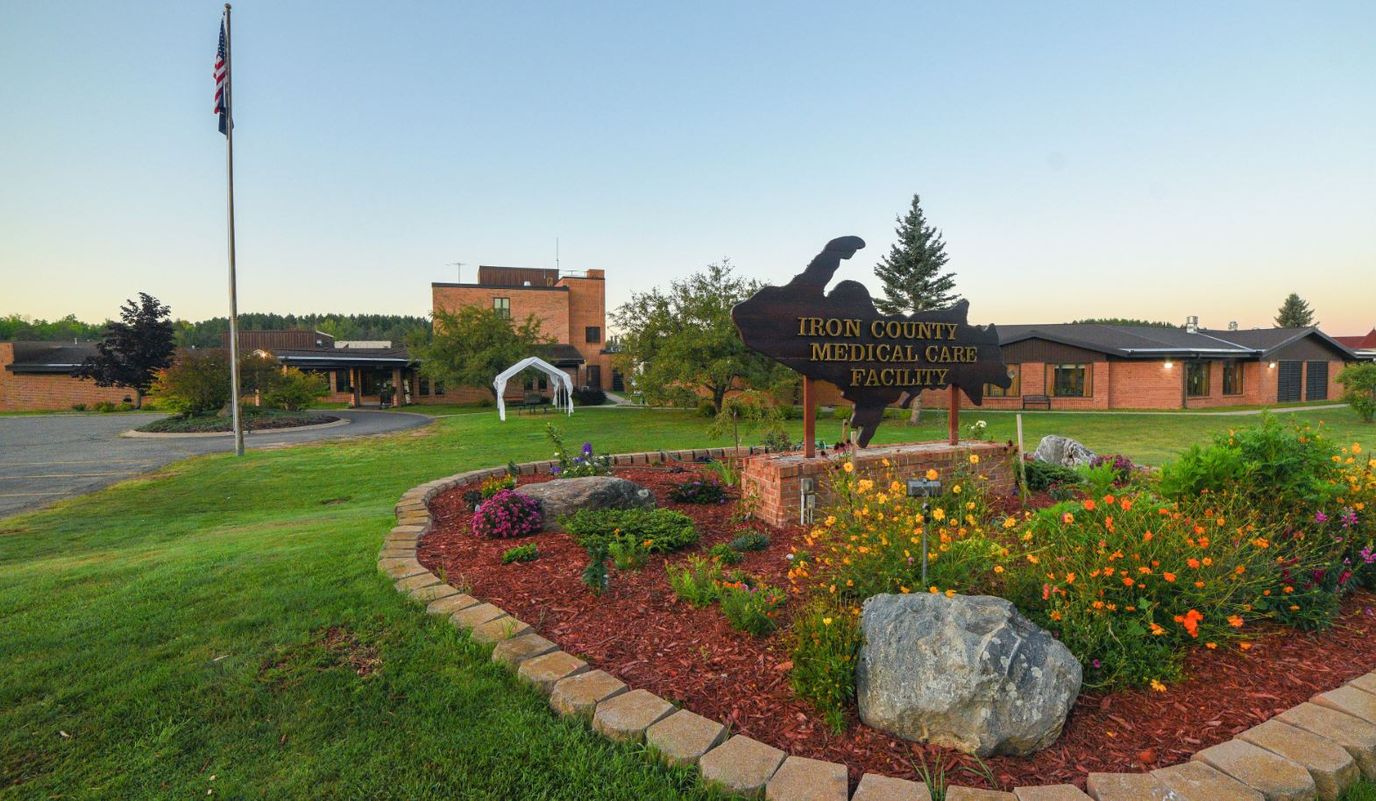
Tucked away in the tranquil area of Crystal Falls, Michigan, Iron County Medical Care Facility is a trusted senior care provider that offers skilled-care, rehabilitation therapy, and assisted living services. This 200-bed community is committed to providing residents with quality long-term care provided by a dedicated team that works with seniors, their families and physicians, in creating functional care plans. Residents who present with various impairments are given a well-supported healing journey with access to physical therapy, occupational therapy, and speech/language therapy.

Residents who choose to live alone with varied levels of assistance are given a welcoming environment where they can thrive with the support of a competent, caring team. Assistance with daily tasks and personal care are provided to help residents live independently for as long as they could. Residents feel safe and secure with 24 hour security and emergency call systems. Weekly light housekeeping, on-site management, internet access, scheduled social and recreational activities, and scheduled transportation, make residents’ lives more convenient and enjoyable.

(906) 875-6671

Quality ratings

Measured by Centers for Medicare & Medicaid Services (CMS)

Overall rating Info The Overall CMS Rating combines results from health inspections, staffing levels and quality measures. Health inspections carry the most weight. Staffing and quality scores can increase or decrease the final rating based on performance compared to state and national standards.
4/5
Michigan average: 3.6/5
Health Inspection Info Based on the results of the facility's three most recent standard inspections and any complaint investigations. CMS reviews the number, scope, and severity of deficiencies, with more recent findings weighted more heavily.
4/5
Michigan average: 3.3/5
Staffing Info Measures average nursing staff hours per resident per day, including Registered Nurses (RNs) and total nursing staff. Ratings are adjusted based on the level of care residents require and are compared to state and national benchmarks.
4/5
Michigan average: 3.4/5
Quality Measures Info Based on clinical and physical health indicators reported to CMS, such as hospital readmissions, falls, pressure ulcers, and improvements in mobility. These measures reflect how well residents' health needs are being managed.
2/5
Michigan average: 3.8/5

Nursing care per resident

Info This shows how many total hours of nursing staff time are available per resident each day. Higher numbers usually mean more staff support.
4h 56m per day

This home provides 16% more nursing time per resident than the Michigan average.

Michigan average: 4h 15m per day

Staffing hours breakdown

Info Hours of care per resident per day, broken down by staff type. Data from CMS Medicare.
Staff type Facility State avg National avg
Registered Nurse (RN) Info Registered nurse hours per resident per day. 41m per day 46m per day 41m per day
Nurse Aide Info Nurse aide hours per resident per day. 2h 48m per day 2h 23m per day 2h 21m per day
Total Nursing (Weekend) Info Total number of nurse staff hours per resident per day on weekends. 3h 23m per day 3h 31m per day 3h 26m per day
Physical Therapist Info Physical therapist staff hours per resident per day. 2m per day 4m per day 4m per day
RN (Weekend) Info Registered nurse hours per resident per day on weekends. 23m per day 29m per day 29m per day

Capacity and availability

High-capacity home

May provide extensive amenities, services and programs.

Total beds 200

This home usually has availability

Lower occupancy suggests more openings may be available.

Lower demand than the Michigan average
Occupancy rate 57.8%
Residents per day (avg) 111
Occupancy rate
57.8%
Residents per day (avg)
111

Who this home usually serves

TYPE OF STAY

Mostly long-term care residents

Most residents stay for extended periods and receive ongoing daily care.

Might be optimal for
Long-term daily care Ongoing support needs

Breakdown by payment type

Medicare

18% of new residents, usually for short-term rehab.

Typical stay 21 days

Private pay

37% of new residents, often for short stays.

Typical stay 6 - 7 months

Medicaid

45% of new residents, often for long-term daily care.

Typical stay 9 - 10 months

Finances and operations

Governmental community
Operated by county authorities.
Home revenue
$18.4M
Operating deficit
-$5.0M
Governmental community Operated by county authorities.
Home revenue
$18.4M
Operating deficit
-$5.0M
Payroll costs Info The portion of the home's budget spent on staff, including nurses, caregivers, and other employees who support care and operations.
$10.0M
54.6% of revenue
Other operating costs Info All remaining costs needed to run the home, such as food, utilities, building maintenance, supplies and administrative expenses.
$13.3M
Total costs $23.3M
Years in operation
25 years in operation
A longer operating history, which may indicate experience navigating regulations and delivering ongoing care.
Walk Score
Walk Score: 11 / 100
Car-dependent. Most errands require a car, with limited nearby walkable options.

About this community

Additional Licensing Details

CMS Certification Number235257

Therapy & Rehabilitation

2 services
Rehabilitation Services
Short-Term Rehab

Amenities & Lifestyle

0 amenities
Specific ProgramsSkyway Rehab Services, Victorian Heights Assisted Living
Operating Hours8am - 4pm

What does this home offer?

Housing options icon

Housing Options: Private Rooms

Building type icon
Building type icon

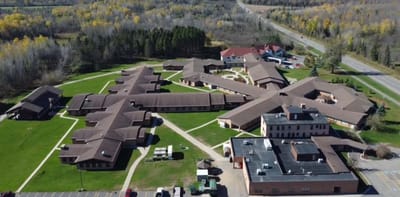
Building Type: Single-story

Types of Care at Iron County Medical Care Facility

Nursing Home

Inspection History

In Michigan, the Department of Licensing and Regulatory Affairs (LARA) conducts unannounced inspections and investigations to ensure long-term care facilities comply with state health codes.

4 visits/inspections

4 visits/inspections triggered by complaints

1 routine inspections

Results

4 with issues

0 without issues

Michigan average: 5 visits/inspections

Latest inspection

Date April 17, 2025
Complaint Investigation

19 deficiencies

Deficiencies indicate regulatory issues. A higher number implies the facility had several areas requiring improvement.

Michigan average: 8 deficiencies

Health Inspection History

Inspections
Total health inspections 4

Michigan average 6.5


Last Health inspection on Apr 2025

Total health citations 17

Michigan average 33.5

Citations per inspection
4.25

Michigan average 5.18


Health citations are formal notices following inspections when they fail to comply with safety and care standards.

14 of 17 citations resulted from standard inspections; 2 of 17 resulted from complaint investigations; and 1 of 17 came from combined inspections (standard and complaint).

Breakdown of citation severity (last 3 years)
Critical Health citations More info 0
100% better than Michigan average

Michigan average: 0.3


Serious Health citations More info 0
100% better than Michigan average

Michigan average: 1.9

0 critical citations More info Michigan average: 0.3

0 serious citations More info Michigan average: 1.9

16 moderate citations More info Michigan average: 30.8

1 minor citation More info Michigan average: 0.5
Citations history (last 3 years)
Infection Control moderate citation Info Issues related to preventing and controlling infections, including hygiene practices and safety protocols. Apr 17, 2025
Corrected

Pharmacy moderate citation Info Issues related to medication management, including how drugs are stored, administered, and monitored. Apr 17, 2025
Corrected

Pharmacy moderate citation Info Issues related to medication management, including how drugs are stored, administered, and monitored. Apr 17, 2025
Corrected

Pharmacy moderate citation Info Issues related to medication management, including how drugs are stored, administered, and monitored. Apr 17, 2025
Corrected

Compare Nursing Homes around Crystal Falls The information below is reported by the Michigan Department of Licensing and Regulatory Affairs (LARA).

1 facility compared · CMS & MI Dept. of Health data · Updated Apr 2026

Filter by care type
Iron County Medical Care Facility
NH

Nursing Home Licensed facility providing 24/7 skilled nursing care for residents with complex, ongoing medical needs. Staffed by RNs, LPNs, and CNAs. Inspected and star-rated annually by CMS. Accepts Medicare (short-term rehab) and Medicaid (long-term care).

Crystal Falls
200
57.8%
-24%
4.93
+8%
+15%
0
17
4.3
0
111
-
11
County Of Iron
$17.2M
$10.0M
58.4%
235257

Places of interest near Iron County Medical Care Facility

Address 2 miles from city center

Calculate Travel Distance to Iron County Medical Care Facility

Add your location

Address

Staffing Data (Q2 2025)

This data corresponds to Q2 2025 and is based on CMS Payroll-Based Journal.

Total staff 158
Employees 132
Contractors 26
Staff to resident ratio 1.48:1
16% worse than Michigan average

Michigan average ratio: 1.75:1

Avg staff/day 69
Average shift 8 hours
0% compared with Michigan average

Michigan average: 7.9 hours

Total staff hours (quarter) 50,207
Nursing staff breakdown
Registered Nurse

Manages medical care and health needs.

Total count 17
Average shift length Info Average shift length. Calculated as total hours divided by days worked and average staff per day. 10.7 hours

This role is partially covered by contractors.

Licensed Practical Nurse

Assists with medical care and medications.

Total count 19
Average shift length Info Average shift length. Calculated as total hours divided by days worked and average staff per day. 9.1 hours

This role is partially covered by contractors.

Certified Nursing Assistant

Helps with daily care and mobility.

Total count 72
Average shift length Info Average shift length. Calculated as total hours divided by days worked and average staff per day. 7.9 hours

This role is partially covered by contractors.

Contractor staffing

Total hours from contractors

14.7%

7,383 contractor hours this quarter

Licensed Practical Nurse: 10 Certified Nursing Assistant: 9 Respiratory Therapy Technician: 2 Registered Nurse: 1 Medical Director: 1 Occupational Therapy Assistant: 1 Occupational Therapy Aide: 1 Physical Therapy Aide: 1
Staff by category
Certified Nursing Assistant6397225,50591100%7.9
Licensed Practical Nurse910195,94691100%9.1
Registered Nurse161173,99891100%10.7
Clinical Nurse Specialist7073,1066774%7.9
Nurse Aide in Training120122,9228998%7.3
Other Dietary Services Staff8082,92091100%7.5
Physical Therapist100102,03191100%7.4
Mental Health Service Worker2029076470%7.7
Nurse Practitioner1014966369%7.9
Dietitian1014906268%7.9
Administrator1014806066%8
Speech Language Pathologist1014496167%7.4
Physical Therapy Assistant1014355864%7.5
Respiratory Therapy Technician0223956167%5.6
Occupational Therapy Assistant011492527%2
Occupational Therapy Aide011422123%2
Medical Director011341719%2
Physical Therapy Aide011311%2.5
72 Certified Nursing Assistant
% of Days 100%
19 Licensed Practical Nurse
% of Days 100%
17 Registered Nurse
% of Days 100%
7 Clinical Nurse Specialist
% of Days 74%
12 Nurse Aide in Training
% of Days 98%
8 Other Dietary Services Staff
% of Days 100%
10 Physical Therapist
% of Days 100%
2 Mental Health Service Worker
% of Days 70%
1 Nurse Practitioner
% of Days 69%
1 Dietitian
% of Days 68%
1 Administrator
% of Days 66%
1 Speech Language Pathologist
% of Days 67%
1 Physical Therapy Assistant
% of Days 64%
2 Respiratory Therapy Technician
% of Days 67%
1 Occupational Therapy Assistant
% of Days 27%
1 Occupational Therapy Aide
% of Days 23%
1 Medical Director
% of Days 19%
1 Physical Therapy Aide
% of Days 1%

Facility Characteristics

Source: CMS Long-Term Care Facility Characteristics (Data as of Jan 2026)

Total census
107 residents
Residents by payment source
Medicare
3 residents (2.8%)
Medicaid
80 residents (74.8%)
Private pay or other
24 residents (22.4%)

Quality of care over time

These measures show how residents usually do over time at this home, based on health outcomes and preventive care.

High-risk clinical events score Info A composite score based on pressure ulcers, falls with injury, weight loss, walking ability decline, and activities of daily living decline. 12.5
49% worse than Michigan average

Michigan average: 8.4

Functional decline score Info A composite score based on activities of daily living decline, walking ability decline, and incontinence. 22.5
38% worse than Michigan average

Michigan average: 16.3

Long-stay resident measures
Below average Michigan avg: 4.2 Info CMS star rating based on long-stay quality measure performance. 5 stars = significantly above average, 1 star = significantly below average.
Need for Help with Daily Activities Increased Info Percent of long-stay residents whose need for help with daily activities has increased 22.7%
82% worse than Michigan average

Michigan average: 12.5%

Walking Ability Worsened Info Percent of long-stay residents whose ability to move independently worsened 19.8%
29% worse than Michigan average

Michigan average: 15.3%

Low Risk Residents with Bowel/Bladder Incontinence Info Percent of low risk long-stay residents who lose control of their bowels or bladder 25.1%
19% worse than Michigan average

Michigan average: 21.0%

Falls with Major Injury Info Percent of long-stay residents experiencing one or more falls with major injury 6.1%
93% worse than Michigan average

Michigan average: 3.2%

High Risk Residents with Pressure Ulcers Info Percent of long-stay high risk residents with pressure ulcers 8.3%
45% worse than Michigan average

Michigan average: 5.7%

Urinary Tract Infection Info Percent of long-stay residents with a urinary tract infection 2.9%
74% worse than Michigan average

Michigan average: 1.7%

Lost Too Much Weight Info Percent of long-stay residents who lose too much weight 5.6%
In line with Michigan average

Michigan average: 5.7%

Depressive Symptoms Info Percent of long-stay residents who have depressive symptoms 7.3%
89% worse than Michigan average

Michigan average: 3.9%

Antipsychotic Use Info Percent of long-stay residents who received an antipsychotic medication 20.5%
37% worse than Michigan average

Michigan average: 15.0%

Pneumococcal Vaccine Info Percent of long-stay residents assessed and appropriately given the pneumococcal vaccine 100.0%
5% better than Michigan average

Michigan average: 94.9%

Influenza Vaccine Info Percent of long-stay residents assessed and appropriately given the seasonal influenza vaccine 100.0%
5% better than Michigan average

Michigan average: 95.0%

Hospitalizations per 1,000 days Info Number of hospitalizations per 1,000 long-stay resident days. 0.81
53% better than Michigan average

Michigan average: 1.74

ED visits per 1,000 days Info Number of outpatient emergency department visits per 1,000 long-stay resident days. 2.20
43% worse than Michigan average

Michigan average: 1.54

Short-stay resident measures
Below average Michigan avg: 3.1 Info CMS star rating based on short-stay quality measure performance. 5 stars = much above average, 1 star = much below average.
Pneumococcal Vaccine Info Percent of short-stay residents assessed and appropriately given the pneumococcal vaccine 98.9%
20% better than Michigan average

Michigan average: 82.5%

Antipsychotic medication increase Info Percent of short-stay residents who newly received an antipsychotic medication 0.0%
100% better than Michigan average

Michigan average: 1.4%

Influenza Vaccine Info Percent of short-stay residents assessed and appropriately given the seasonal influenza vaccine 95.7%
20% better than Michigan average

Michigan average: 79.5%

Re-hospitalized after SNF stay Info Percentage of short-stay residents who were re-hospitalized after their nursing home admission. 29.5%
22% worse than Michigan average

Michigan average: 24.2%

Emergency department visits Info Percentage of short-stay residents who had an outpatient emergency department visit. 30.4%
164% worse than Michigan average

Michigan average: 11.5%

Falls with major injury Info Percentage of SNF residents who experience falls with major injury during their stay. 0.0%
100% better than Michigan average

Michigan average: 0.8%

Successful return to home or community Info Rate of successful return to home or community from a skilled nursing facility. 41.7%
18% worse than Michigan average

Michigan average: 50.6%

Guides for Better Senior Living

Care Cost Calculator: See Prices in Your Area

Nursing Home Data Explorer

Don’t Wait Too Long: 7 Red Flag Signs Your Parent Needs Assisted Living Now

The True Cost of Assisted Living in 2025 – And How Families Are Paying For It

Understanding Senior Living Costs: Pricing Models, Discounts & Financial Assistance

Financial Aid for Michigan Seniors

Get financial aid guidance

MI Choice Waiver

Michigan Medicaid MI Choice Waiver

Age 65+ or disabled, Michigan resident, Medicaid- eligible, nursing home-level care need.

~$2,829/month (300% FBR, individual).

$2,000 (individual), $3,000 (couple).

Delivered through regional waiver agents; waitlists possible.

Home Help Program

Michigan Home Help

Age 65+ or disabled, Michigan resident, Medicaid- eligible or low-income.

~$1,732/month (individual, Medicaid threshold).

$2,000 (individual).

Can hire family caregivers; less intensive than waiver.

Program of All-Inclusive Care for the Elderly (PACE)

Michigan PACE

Age 55+, Michigan resident, nursing home-level care need, safe with PACE support.

~$2,829/month (Medicaid-eligible); private pay option available.

$2,000 (individual), $3,000 (couple).

16 PACE centers (e.g., Ingham, Wayne counties); expanding slowly.

Medicare Savings Program (MSP)

Michigan Medicare Savings Program

Age 65+ or disabled, Michigan resident, Medicare Part A/B.

~$2,510/month (QMB), ~$3,380/month (SLMB), ~$3,598/month (QI)—individual.

$9,430 (individual), $14,130 (couple).

Three tiers; no waitlist; includes Extra Help for Part D.

National Family Caregiver Support Program (NFCSP) Respite

Michigan NFCSP Respite Care

Caregivers of 60+ needing care or 55+ caregivers of others; Michigan resident; functional needs (2+ ADLs).

Prioritizes ~$24,980/year (individual); no strict cap.

Not assessed; need-based.

16 AAAs; prioritizes low-income, rural caregivers.

Senior Community Service Employment Program (SCSEP)

Michigan SCSEP

Age 55+, unemployed, low-income, Michigan resident.

~$1,983/month (125% FPL).

Not specified; income-focused.

Priority for veterans, rural residents; Operation ABLE partnership.

VA Aid and Attendance (A&A) and Housebound Benefits

Michigan VA Aid and Attendance/Housebound

Age 65+ or disabled veteran/spouse, Michigan resident, wartime service, need for ADL help (A&A) or homebound.

Net income < ~$1,984/month (veteran with dependent, A&A); pension offsets income.

~$155,356 (net worth limit).

High veteran demand in urban/rural areas.