Iron County Medical Care Facility

Nursing Home · Crystal Falls, MI
CMS overall rating Info The Overall CMS Rating is scored from 1 to 5 stars and combines results from health inspections, staffing levels, and quality measures. Health inspections carry the most weight. Staffing and quality scores can increase or decrease the final rating based on performance compared to state and national standards.
Iron County Medical Care Facility
Nursing Home · Crystal Falls, MI
CMS overall rating Info The Overall CMS Rating is scored from 1 to 5 stars and combines results from health inspections, staffing levels, and quality measures. Health inspections carry the most weight. Staffing and quality scores can increase or decrease the final rating based on performance compared to state and national standards.
Calculator: See prices in your area
Iron County Medical Care Facility accepts Medicare, Medicaid, and private pay.

Overview of Iron County Medical Care Facility

Tucked away in the tranquil area of Crystal Falls, Michigan, Iron County Medical Care Facility is a trusted senior care provider that offers skilled-care, rehabilitation therapy, and assisted living services. This 200-bed community is committed to providing residents with quality long-term care provided by a dedicated team that works with seniors, their families and physicians, in creating functional care plans. Residents who present with various impairments are given a well-supported healing journey with access to physical therapy, occupational therapy, and speech/language therapy.

Residents who choose to live alone with varied levels of assistance are given a welcoming environment where they can thrive with the support of a competent, caring team. Assistance with daily tasks and personal care are provided to help residents live independently for as long as they could. Residents feel safe and secure with 24 hour security and emergency call systems. Weekly light housekeeping, on-site management, internet access, scheduled social and recreational activities, and scheduled transportation, make residents’ lives more convenient and enjoyable.

(906) 875-6671

Quality ratings

Measured by Centers for Medicare & Medicaid Services (CMS)

Overall rating Info The Overall CMS Rating combines results from health inspections, staffing levels and quality measures. Health inspections carry the most weight. Staffing and quality scores can increase or decrease the final rating based on performance compared to state and national standards.
▲ 12.7% Above MI avg.
Health Inspection Info Based on the results of the facility's three most recent standard inspections and any complaint investigations. CMS reviews the number, scope, and severity of deficiencies, with more recent findings weighted more heavily.
▲ 20.1% Above MI avg.
Staffing Info Measures average nursing staff hours per resident per day, including Registered Nurses (RNs) and total nursing staff. Ratings are adjusted based on the level of care residents require and are compared to state and national benchmarks.
▲ 19.0% Above MI avg.
Quality Measures Info Based on clinical and physical health indicators reported to CMS, such as hospital readmissions, falls, pressure ulcers, and improvements in mobility. These measures reflect how well residents' health needs are being managed.
▼ 47.5% Below MI avg.

Staffing hours breakdown

Info Daily nursing hours per resident by staff type, reported to CMS. Higher is generally better — compare this facility to state and national averages to see where staffing stands.

Hours per resident per day — compared to Michigan state averages

Total nursing care / resident Info This home is ranked 14th out of 94 homes in Michigan.

Total adjusted nursing hours per resident per day, combining RN, LPN, and aide time. CMS adjusts this for case-mix so facilities can be fairly compared.
4h 56m per day
Rank #14 / 94Nurse hours — state benchmarkedThis home is ranked 14th out of 94 homes in Michigan.Shows adjusted nurse hours per resident per day benchmarked to the Michigan average, with a ranking across 94 Michigan SNFs. More hours mean more direct care. The national average is about 3.5 hrs; below 3.0 is a red flag.
This facility Michigan avg (4h 15m per day)
vs Michigan avg
+16%

4 of 6 metrics below state avg

Standout metric Nurse Aide is +17% above state avg
Staff typeHours / dayvs state avg
Registered Nurse (RN) Info RNs hold the highest nursing license and can assess residents, interpret test results, and direct care plans. More RN hours per day often signals stronger clinical oversight and faster response to health changes. 41m per day ▼ 11% State avg: 46m per day · National avg: 41m per day
LPN / LVN Info Licensed Practical Nurses (LPNs) or Licensed Vocational Nurses (LVNs) deliver routine hands-on care — medication administration, wound dressing, and monitoring vital signs. They work under RN supervision and make up a large share of daily bedside care. 42m per day ▼ 21% State avg: 53m per day · National avg: 52m per day
Nurse Aide Info Certified Nurse Aides (CNAs) provide the most direct day-to-day assistance: bathing, dressing, feeding, and mobility. Nurse aide hours are typically the largest staffing category and directly affect residents' quality of life. 2h 48m per day ▲ 17% State avg: 2h 23m per day · National avg: 2h 21m per day
Total Nursing (Weekend) Info Combined nursing hours (RN + LPN + Nurse Aide) per resident per day on weekends. Staffing often drops on weekends — this figure reveals whether the facility maintains adequate coverage outside of weekday hours. 3h 26m per day ■ Avg State avg: 3h 31m per day · National avg: 3h 26m per day
Physical Therapist Info Hours per resident per day provided by licensed Physical Therapists (PTs) or PT Assistants. PT services help residents recover mobility after injury or illness and are especially important for post-acute (short-stay) rehabilitation. 2m per day ▼ 50% State avg: 4m per day · National avg: 4m per day
RN (Weekend) Info Registered nurse hours specifically on weekends. Facilities sometimes reduce RN presence on Saturdays and Sundays — a low weekend RN figure compared to weekday hours can indicate reduced clinical oversight when most administrative staff are absent. 23m per day ▼ 21% State avg: 29m per day · National avg: 29m per day

Capacity and availability

This home usually has availability

Occupancy lower than 85% suggests more openings may be available.

Lower occupancy than the Michigan average: 75.8%
Occupancy rate 57.8% Rank #65 / 96Occupancy rate — state benchmarkedThis home is ranked 65th out of 96 homes in Michigan.Shows this facility's occupancy rate versus the Michigan average, with its statewide rank out of 96. Higher occupancy signals strong local demand and financial stability.
Avg. Length of Stay 231 days
Occupancy rate
57.8% Rank #65 / 96Occupancy rate — state benchmarkedThis home is ranked 65th out of 96 homes in Michigan.Shows this facility's occupancy rate versus the Michigan average, with its statewide rank out of 96. Higher occupancy signals strong local demand and financial stability.
Avg. Length of Stay
231 days

Who this home usually serves

TYPE OF STAY

Mostly long-term care residents

Most residents stay for extended periods and receive ongoing daily care.

Breakdown by payment type

Medicare

18% of new residents, usually for short-term rehab.

Typical stay 21 days

Private pay

37% of new residents, often for short stays.

Typical stay 6 - 7 months

Medicaid

45% of new residents, often for long-term daily care.

Typical stay 9 - 10 months

Finances and operations

Governmental community
Operated by county authorities.
Home revenue
$18.4M
Operating deficit
-$5.0M
Governmental community Operated by county authorities.
Home revenue
$18.4M Rank #36 / 95Revenue — state benchmarkedThis home is ranked 36th out of 95 homes in Michigan.Shows this facility's annual revenue compared to the Michigan SNF average. Higher revenue generally means more resources for staffing and capital — read alongside Payroll %.
Operating deficit
-$5.0M
Payroll costs Info The portion of the home's budget spent on staff, including nurses, caregivers, and other employees who support care and operations. Rank #12 / 95Payroll — state benchmarkedThis home is ranked 12th out of 95 homes in Michigan.Shows total annual staff payroll benchmarked to the Michigan average. Higher payroll investment relative to peers often signals better staffing and less reliance on cheaper contract labor.
$16.0M
87.3% of revenue Rank #11 / 95Payroll % — state benchmarkedThis home is ranked 11th out of 95 homes in Michigan.Shows payroll as a percentage of revenue versus the Michigan average. Well-run SNFs often land around 55–65%. Below 25% may signal understaffing or heavy agency use — read with Staffing ratings.
Other operating costs Info All remaining costs needed to run the home, such as food, utilities, building maintenance, supplies and administrative expenses.
$7.3M
Total costs $23.3M
Years in operation
25 years in operation
A longer operating history, which may indicate experience navigating regulations and delivering ongoing care.
Walk Score
Walk Score: 11 / 100 Rank #61 / 70Walk Score — state benchmarkedThis home is ranked 61st out of 70 homes in Michigan.Shows how walkable this facility's neighborhood is compared to the average Walk Score across Michigan SNFs. Higher scores benefit residents, families, and staff.
Car-dependent. Most errands require a car, with limited nearby walkable options.

About this community

License Details

CMS Certification Number235257

Therapy & Rehabilitation

2 services
Rehabilitation Services
Short-Term Rehab

Amenities & Lifestyle

Specific ProgramsSkyway Rehab Services, Victorian Heights Assisted Living
Operating Hours8am - 4pm

What does this home offer?

Housing options icon

Housing Options: Private Rooms

Building type icon
Building type icon

Building Type: Single-story

Types of Care at Iron County Medical Care Facility

Nursing Home

Contact Iron County Medical Care Facility

Inspection History

In Michigan, the Department of Licensing and Regulatory Affairs (LARA) conducts unannounced inspections and investigations to ensure long-term care facilities comply with state health codes.

The data displayed corresponds to the last 4 years.

4 visits/inspections Info Inspections are mandatory, regular evaluations conducted by state health departments or regulatory agencies. They ensure the community provides safe, compliant care, covering areas like resident health, staff and management.

Michigan average: 5 visits/inspections

Latest inspection

Date April 17, 2025
Complaint Investigation

19 deficiencies

Deficiencies indicate regulatory issues. A higher number implies the facility had several areas requiring improvement.

Michigan average: 8 deficiencies

Inspection Report Summary for Iron County Medical Care Facility

The most recent inspection on April 17, 2025, identified deficiencies related to oxygen administration, medication regimen reviews, duplicate drug therapy, medication error rates, and hand hygiene. Earlier inspections showed similar concerns with medication management, including narcotic misappropriation by staff, incomplete incident investigations, and infection control issues. Inspectors cited problems with medication errors, infection prevention, and quality assurance processes, along with a substantiated case of resident sexual abuse and controlled substance diversion in prior reports. Complaint investigations were substantiated in several instances, particularly regarding medication errors and abuse, while enforcement actions such as staff termination were noted but fines or license suspensions were not listed in the available reports. The pattern of findings suggests ongoing challenges with medication management and infection control, with no clear indication of sustained improvement over time.

Health Inspection History

Inspections
Total health inspections 4

Michigan average 6.5


Last Health inspection on Apr 2025
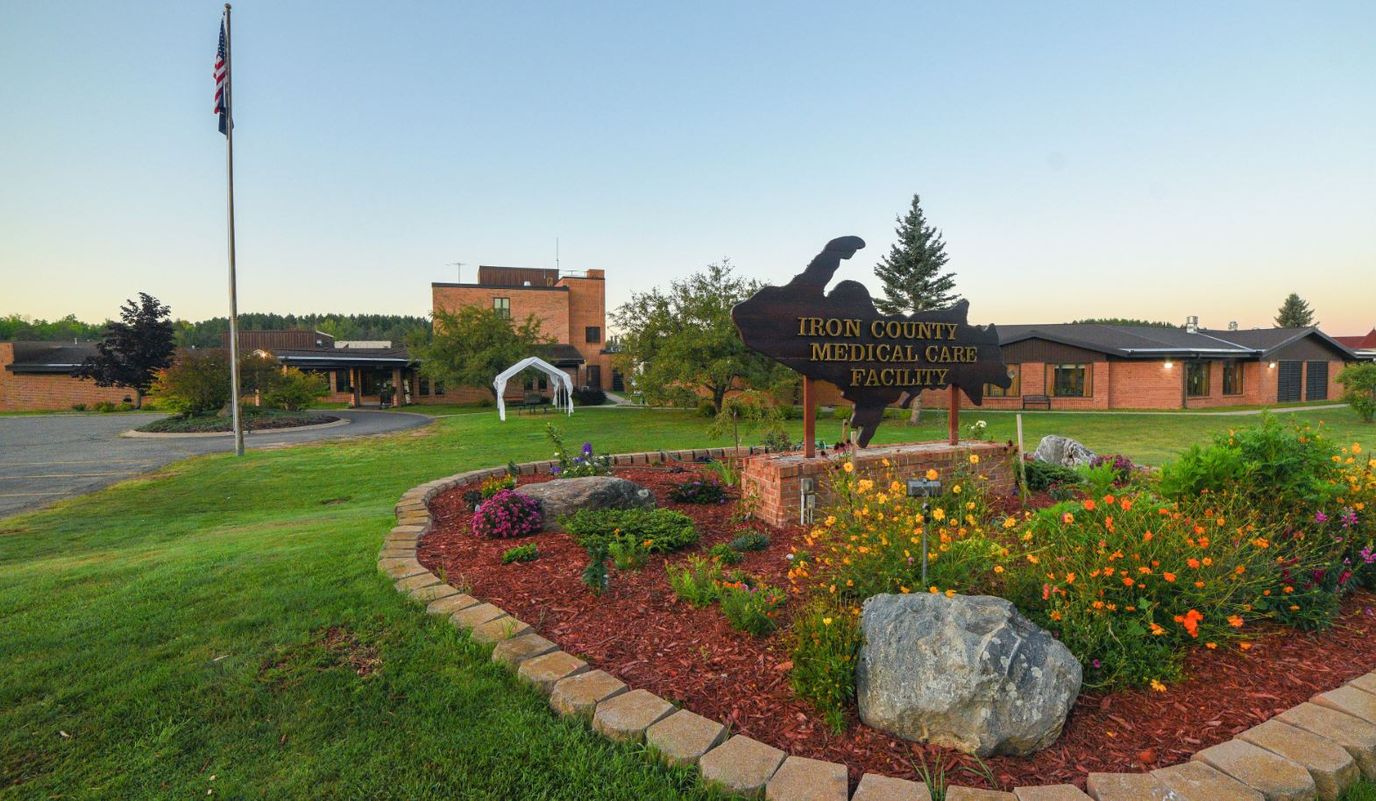
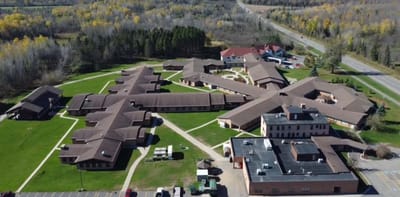
Total health citations
17 Rank #27 / 96Health citations — state benchmarkedThis home is ranked 27th out of 96 homes in Michigan.Shows this facility's total health deficiency citations benchmarked to the Michigan state average, with a ranking across all 96 MI SNFs. Lower citation counts earn a better rank.

Michigan average 33.5

Citations per inspection
4.25 Rank #40 / 96Citations per inspection — state benchmarkedThis home is ranked 40th out of 96 homes in Michigan.Shows average deficiency citations per CMS inspection for this facility versus the Michigan mean across 96 SNFs with citation data. Lower is better.

Michigan average 5.18


Health citations are formal notices following inspections when they fail to comply with safety and care standards.

14 of 17 citations resulted from standard inspections; 2 of 17 resulted from complaint investigations; and 1 of 17 came from combined inspections (standard and complaint).

Breakdown of citation severity (last 3 years)
Critical Health citations More info
0
100% better than Michigan average

Michigan average: 0.3


Serious Health citations More info 0
100% better than Michigan average

Michigan average: 1.9

0 critical citations More info Michigan average: 0.3

0 serious citations More info Michigan average: 1.9

16 moderate citations More info Michigan average: 30.8

1 minor citation More info Michigan average: 0.5
Citations history (last 3 years)
Infection Control moderate citation Info Issues related to preventing and controlling infections, including hygiene practices and safety protocols. Apr 17, 2025
Corrected

Pharmacy moderate citation Info Issues related to medication management, including how drugs are stored, administered, and monitored. Apr 17, 2025
Corrected

Pharmacy moderate citation Info Issues related to medication management, including how drugs are stored, administered, and monitored. Apr 17, 2025
Corrected

Pharmacy moderate citation Info Issues related to medication management, including how drugs are stored, administered, and monitored. Apr 17, 2025
Corrected

Financial Assistance for
Nursing Home in Michigan

Iron County Medical Care Facility is located in Crystal Falls, Michigan.
Here are the financial assistance programs available to residents in Michigan.

Get Financial aid guidance

MI Choice Waiver

Michigan Medicaid MI Choice Waiver

Age 65+ or disabled
General Michigan resident, Medicaid- eligible, nursing home-level care need.
Income Limits (2025) ~$2,829/month 300% FBR, individual
Asset Limits $2,000 (individual), $3,000 (couple).
MI

Delivered through regional waiver agents; waitlists possible.

Benefits
Personal care (5-7 hours/day) Respite care (240 hours/year) Home modifications ($1,500 avg.) Adult day care ($65/day)

Home Help Program

Michigan Home Help

Age 65+ or disabled
General Michigan resident, Medicaid- eligible or low-income.
Income Limits ~$1,732/month individual, Medicaid threshold
Asset Limits $2,000 individual
MI

Can hire family caregivers; less intensive than waiver.

Benefits
Personal care (up to 60 hours/month) Homemaker services Respite (varies)

Program of All-Inclusive Care for the Elderly (PACE)

Michigan PACE

Age 55+
General Michigan resident, nursing home-level care need, safe with PACE support.
Income Limits (2025) ~$2,829/month (Medicaid-eligible); private pay option available.
Asset Limits $2,000 (individual), $3,000 (couple).
MI

16 PACE centers (e.g., Ingham, Wayne counties); expanding slowly.

Benefits
Personal care (5-7 hours/day) Medical care Meals Transportation Therapy Respite

Medicare Savings Program (MSP)

Michigan Medicare Savings Program

Age 65+ or disabled
General Michigan resident, Medicare Part A/B.
Income Limits (2025) ~$2,510/month (QMB), ~$3,380/month (SLMB), ~$3,598/month (QI)—individual.
Asset Limits $9,430 (individual), $14,130 (couple).
MI

Three tiers; no waitlist; includes Extra Help for Part D.

Benefits
Covers Part B premiums ($174.70/month) Deductibles ($240/year) Copays (~20%)

National Family Caregiver Support Program (NFCSP) Respite

Michigan NFCSP Respite Care

Age
General Caregivers of 60+ needing care or 55+ caregivers of others; Michigan resident; functional needs (2+ ADLs).
Income Limits (2025) Prioritizes ~$24,980/year (individual); no strict cap.
Asset Limits Not assessed; need-based.
MI

16 AAAs; prioritizes low-income, rural caregivers.

Benefits
Respite (4-6 hours/week or 5 days/year) Adult day care ($60/day) Caregiver training

Senior Community Service Employment Program (SCSEP)

Michigan SCSEP

Age 55+
General unemployed, low-income, Michigan resident.
Income Limits (2025) ~$1,983/month 125% FPL
Asset Limits Not specified; income-focused.
MI

Priority for veterans, rural residents; Operation ABLE partnership.

Benefits
Paid training (~20 hours/week at ~$7.25/hour) Job placement

VA Aid and Attendance (A&A) and Housebound Benefits

Michigan VA Aid and Attendance/Housebound

Age 65+ or disabled veteran/spouse
General Michigan resident, wartime service, need for ADL help (A&A) or homebound.
Income Limits (2025) Net income < ~$1,984/month (veteran with dependent, A&A); pension offsets income.
Asset Limits ~$155,356 net worth limit
MI

High veteran demand in urban/rural areas.

Benefits
Cash (~$1,433-$2,642/month veteran, ~$951-$1,318 spouse) for care costs

Places of interest near Iron County Medical Care Facility

Address 2.0 miles from city center Info Estimated distance in miles from Crystal Falls's city center to Iron County Medical Care Facility's address, calculated via Google Maps.

Calculate Travel Distance to Iron County Medical Care Facility

Add your location

Address

Staffing Data (Q2 2025)

This data corresponds to Q2 2025 and is based on CMS Payroll-Based Journal.

Total staff 158
Employees 132
Contractors 26
Staff to resident ratio 1.48:1
16% worse than Michigan average

Michigan average ratio: 1.75:1

Avg staff/day 69
Average shift 8 hours
0% compared with Michigan average

Michigan average: 7.9 hours

Total staff hours (quarter) 50,207
Nursing staff breakdown
Registered Nurse

Manages medical care and health needs.

Total count 17
Average shift length Info Average shift length. Calculated as total hours divided by days worked and average staff per day. 10.7 hours

This role is partially covered by contractors.

Licensed Practical Nurse

Assists with medical care and medications.

Total count 19
Average shift length Info Average shift length. Calculated as total hours divided by days worked and average staff per day. 9.1 hours

This role is partially covered by contractors.

Certified Nursing Assistant

Helps with daily care and mobility.

Total count 72
Average shift length Info Average shift length. Calculated as total hours divided by days worked and average staff per day. 7.9 hours

This role is partially covered by contractors.

Contractor staffing

Total hours from contractors

14.7%

7,383 contractor hours this quarter

Licensed Practical Nurse: 10 Certified Nursing Assistant: 9 Respiratory Therapy Technician: 2 Registered Nurse: 1 Medical Director: 1 Occupational Therapy Assistant: 1 Occupational Therapy Aide: 1 Physical Therapy Aide: 1
Staff by category
Certified Nursing Assistant6397225,50591100%7.9
Licensed Practical Nurse910195,94691100%9.1
Registered Nurse161173,99891100%10.7
Clinical Nurse Specialist7073,1066774%7.9
Nurse Aide in Training120122,9228998%7.3
Other Dietary Services Staff8082,92091100%7.5
Physical Therapist100102,03191100%7.4
Mental Health Service Worker2029076470%7.7
Nurse Practitioner1014966369%7.9
Dietitian1014906268%7.9
Administrator1014806066%8
Speech Language Pathologist1014496167%7.4
Physical Therapy Assistant1014355864%7.5
Respiratory Therapy Technician0223956167%5.6
Occupational Therapy Assistant011492527%2
Occupational Therapy Aide011422123%2
Medical Director011341719%2
Physical Therapy Aide011311%2.5
72 Certified Nursing Assistant
% of Days 100%
19 Licensed Practical Nurse
% of Days 100%
17 Registered Nurse
% of Days 100%
7 Clinical Nurse Specialist
% of Days 74%
12 Nurse Aide in Training
% of Days 98%
8 Other Dietary Services Staff
% of Days 100%
10 Physical Therapist
% of Days 100%
2 Mental Health Service Worker
% of Days 70%
1 Nurse Practitioner
% of Days 69%
1 Dietitian
% of Days 68%
1 Administrator
% of Days 66%
1 Speech Language Pathologist
% of Days 67%
1 Physical Therapy Assistant
% of Days 64%
2 Respiratory Therapy Technician
% of Days 67%
1 Occupational Therapy Assistant
% of Days 27%
1 Occupational Therapy Aide
% of Days 23%
1 Medical Director
% of Days 19%
1 Physical Therapy Aide
% of Days 1%

Facility Characteristics

Source: CMS Long-Term Care Facility Characteristics (Data as of Jan 2026)

Total residents 107
Medicare
3
2.8% of residents
Medicaid
80
74.8% of residents
Private pay or other
24
22.4% of residents

Quality of care over time

These measures show how residents usually do over time at this home, based on health outcomes and preventive care.

High-risk clinical events score Info A composite score based on pressure ulcers, falls with injury, weight loss, walking ability decline, and activities of daily living decline. 12.5
49% worse than Michigan average

Michigan average: 8.4

Functional decline score Info A composite score based on activities of daily living decline, walking ability decline, and incontinence. 22.5
38% worse than Michigan average

Michigan average: 16.3

Long-stay resident measures
Below average Michigan avg: 4.1 Info CMS star rating based on long-stay quality measure performance. 5 stars = significantly above average, 1 star = significantly below average.
Need for Help with Daily Activities Increased Info Percent of long-stay residents whose need for help with daily activities has increased 22.7%
82% worse than Michigan average

Michigan average: 12.5%

Walking Ability Worsened Info Percent of long-stay residents whose ability to move independently worsened 19.8%
29% worse than Michigan average

Michigan average: 15.3%

Low Risk Residents with Bowel/Bladder Incontinence Info Percent of low risk long-stay residents who lose control of their bowels or bladder 25.1%
19% worse than Michigan average

Michigan average: 21.0%

Falls with Major Injury Info Percent of long-stay residents experiencing one or more falls with major injury 6.1%
93% worse than Michigan average

Michigan average: 3.2%

High Risk Residents with Pressure Ulcers Info Percent of long-stay high risk residents with pressure ulcers 8.3%
45% worse than Michigan average

Michigan average: 5.7%

Urinary Tract Infection Info Percent of long-stay residents with a urinary tract infection 2.9%
74% worse than Michigan average

Michigan average: 1.7%

Lost Too Much Weight Info Percent of long-stay residents who lose too much weight 5.6%
In line with Michigan average

Michigan average: 5.7%

Depressive Symptoms Info Percent of long-stay residents who have depressive symptoms 7.3%
89% worse than Michigan average

Michigan average: 3.9%

Antipsychotic Use Info Percent of long-stay residents who received an antipsychotic medication 20.5%
37% worse than Michigan average

Michigan average: 15.0%

Pneumococcal Vaccine Info Percent of long-stay residents assessed and appropriately given the pneumococcal vaccine 100.0%
5% better than Michigan average

Michigan average: 94.9%

Influenza Vaccine Info Percent of long-stay residents assessed and appropriately given the seasonal influenza vaccine 100.0%
5% better than Michigan average

Michigan average: 95.0%

Hospitalizations per 1,000 days Info Number of hospitalizations per 1,000 long-stay resident days. 0.81
53% better than Michigan average

Michigan average: 1.74

ED visits per 1,000 days Info Number of outpatient emergency department visits per 1,000 long-stay resident days. 2.20
43% worse than Michigan average

Michigan average: 1.54

Short-stay resident measures
Below average Michigan avg: 3.3 Info CMS star rating based on short-stay quality measure performance. 5 stars = much above average, 1 star = much below average.
Pneumococcal Vaccine Info Percent of short-stay residents assessed and appropriately given the pneumococcal vaccine 98.9%
20% better than Michigan average

Michigan average: 82.5%

Antipsychotic medication increase Info Percent of short-stay residents who newly received an antipsychotic medication 0.0%
100% better than Michigan average

Michigan average: 1.4%

Influenza Vaccine Info Percent of short-stay residents assessed and appropriately given the seasonal influenza vaccine 95.7%
20% better than Michigan average

Michigan average: 79.5%

Re-hospitalized after SNF stay Info Percentage of short-stay residents who were re-hospitalized after their nursing home admission. 29.5%
22% worse than Michigan average

Michigan average: 24.2%

Emergency department visits Info Percentage of short-stay residents who had an outpatient emergency department visit. 30.4%
164% worse than Michigan average

Michigan average: 11.5%

Falls with major injury Info Percentage of SNF residents who experience falls with major injury during their stay. 0.0%
100% better than Michigan average

Michigan average: 0.8%

Successful return to home or community Info Rate of successful return to home or community from a skilled nursing facility. 41.7%
18% worse than Michigan average

Michigan average: 50.6%

Penalties and fines

Federal penalties imposed by CMS for regulatory violations, including civil money penalties (fines) and denials of payment for new Medicare/Medicaid admissions.

Source: CMS Penalties Database

No penalties in the past 3 years

No civil money penalties or payment denials were reported in the last 3 years.

Guides for Better Senior Living

Care Cost Calculator: See Prices in Your Area

Nursing Home Data Explorer

Don’t Wait Too Long: 7 Red Flag Signs Your Parent Needs Assisted Living Now

The True Cost of Assisted Living in 2025 – And How Families Are Paying For It

Understanding Senior Living Costs: Pricing Models, Discounts & Financial Assistance

Frequently Asked Questions about Iron County Medical Care Facility

What neighborhood is Iron County Medical Care Facility in?

Iron County Medical Care Facility is in the US 2 neighborhood of Crystal Falls.

Is Iron County Medical Care Facility in a walkable area?

Iron County Medical Care Facility has a walk score of 11. Car-dependent. Most errands require a car, with limited nearby walkable options.

What is the phone number of Iron County Medical Care Facility?

(906) 875-6671 will put you in contact with the team at Iron County Medical Care Facility.

Is Iron County Medical Care Facility Medicare or Medicaid certified?

Yes — Iron County Medical Care Facility is a CMS-certified provider of Medicare and Medicaid.

Explore Open Rooms
1 Contact details
2 What type of senior care service are you looking for?
3 What budget do you have in mind for senior care?
4 How soon do you need to find care?
5 Additional details

Thank you for your interest!

Our team will be in touch shortly to help with next steps.