Eureka Rehabilitation & Wellness Center
Nursing Home, Respite Care & Nursing Care · Eureka, CA
CMS overall rating Info The Overall CMS Rating is scored from 1 to 5 stars and combines results from health inspections, staffing levels, and quality measures. Health inspections carry the most weight. Staffing and quality scores can increase or decrease the final rating based on performance compared to state and national standards.

Eureka Rehabilitation & Wellness Center

Nursing Home, Respite Care & Nursing Care · Eureka, CA
CMS overall rating Info The Overall CMS Rating is scored from 1 to 5 stars and combines results from health inspections, staffing levels, and quality measures. Health inspections carry the most weight. Staffing and quality scores can increase or decrease the final rating based on performance compared to state and national standards.
Calculator: See prices in your area
Eureka Rehabilitation & Wellness Center accepts Medicare, Medicaid, and private pay.

Overview of Eureka Rehabilitation & Wellness Center

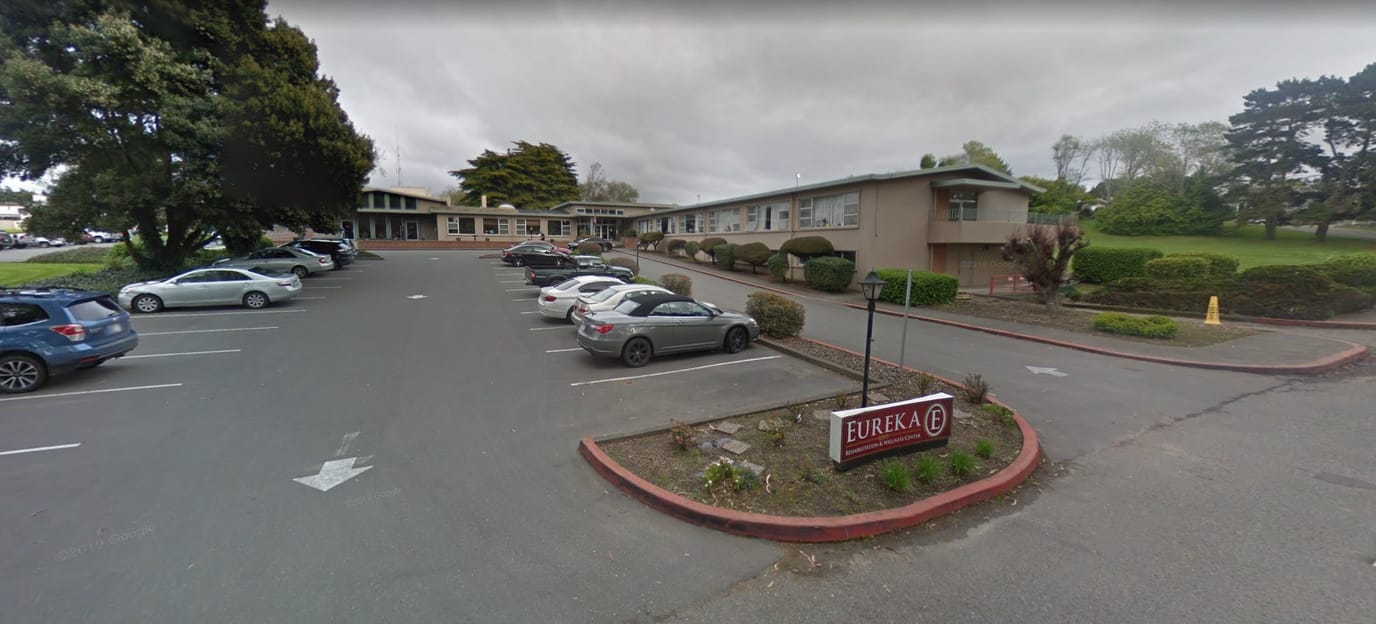
Elevate your retirement with the astounding senior living community of Eureka Rehabilitation and Wellness Center on 23rd Street, Eureka, CA, specializing in long- and short-term care including occupational, speech, physical, and respiratory therapy. With the community helping with daily living activities and personal needs, seniors have more time to focus on the things they want. A team of kind and responsible professionals is available 24/7 to ensure seniors are well-cared for.

The community also provides a local hospice agency to support residents and their families to ensure their well-being at a difficult stage in their lives. Fostering a vibrant and friendly environment, Eureka Rehabilitation and Wellness Center strives to provide a safe place for seniors to spend retirement while receiving top-tier care and assistance.

(707) 443-7358

Quality ratings

Measured by Centers for Medicare & Medicaid Services (CMS)

Overall rating Info The Overall CMS Rating combines results from health inspections, staffing levels and quality measures. Health inspections carry the most weight. Staffing and quality scores can increase or decrease the final rating based on performance compared to state and national standards.
▼ 44.4% Below CA avg. ▼ 44.4% Below CA avg.Click the badge to see the full State ranking.Click here to see the full State ranking.
Health Inspection Info Based on the results of the facility's three most recent standard inspections and any complaint investigations. CMS reviews the number, scope, and severity of deficiencies, with more recent findings weighted more heavily.
▼ 4.8% Below CA avg. ▼ 4.8% Below CA avg.Click the badge to see the full State ranking.Click here to see the full State ranking.
Staffing Info Measures average nursing staff hours per resident per day, including Registered Nurses (RNs) and total nursing staff. Ratings are adjusted based on the level of care residents require and are compared to state and national benchmarks.
▼ 71.0% Below CA avg. ▼ 71.0% Below CA avg.Click the badge to see the full State ranking.Click here to see the full State ranking.
Quality Measures Info Based on clinical and physical health indicators reported to CMS, such as hospital readmissions, falls, pressure ulcers, and improvements in mobility. These measures reflect how well residents' health needs are being managed.
▼ 53.1% Below CA avg. ▼ 53.1% Below CA avg.Click the badge to see the full State ranking.Click here to see the full State ranking.

Staffing hours breakdown

Info Daily nursing hours per resident by staff type, reported to CMS. Higher is generally better — compare this facility to state and national averages to see where staffing stands.

Hours per resident per day — compared to California state averages

Total nursing care / resident Info This home is ranked 225th out of 346 homes in California. Total adjusted nursing hours per resident per day, combining RN, LPN, and aide time. CMS adjusts this for case-mix so facilities can be fairly compared.
3h 50m per day
Rank #225 / 346Nurse hours — State benchmarkedThis home is ranked 225th out of 346 homes in California. Shows adjusted nurse hours per resident per day benchmarked to the California average, with a ranking across 346 California SNFs. More hours mean more direct care. The national average is about 3.5 hrs; below 3.0 is a red flag.Click the rank badge to see the full State ranking.Click here to see the full State ranking.
This facility California avg (4h 23m per day)
vs California avg
-13%

6 of 6 metrics below state avg

Staff typeHours / Day / Residentvs state avg
Registered Nurse (RN) Info RNs hold the highest nursing license and can assess residents, interpret test results, and direct care plans. More RN hours per day often signals stronger clinical oversight and faster response to health changes. 14m per day ▼ 64% State avg: 39m per day · National avg: 41m per day
LPN / LVN Info Licensed Practical Nurses (LPNs) or Licensed Vocational Nurses (LVNs) deliver routine hands-on care — medication administration, wound dressing, and monitoring vital signs. They work under RN supervision and make up a large share of daily bedside care. 1h 5m per day ▼ 11% State avg: 1h 13m per day · National avg: 52m per day
Nurse Aide Info Certified Nurse Aides (CNAs) provide the most direct day-to-day assistance: bathing, dressing, feeding, and mobility. Nurse aide hours are typically the largest staffing category and directly affect residents' quality of life. 2h 30m per day ▼ 6% State avg: 2h 39m per day · National avg: 2h 21m per day
Total Nursing (Weekend) Info Combined nursing hours (RN + LPN + Nurse Aide) per resident per day on weekends. Staffing often drops on weekends — this figure reveals whether the facility maintains adequate coverage outside of weekday hours. 3h 29m per day ▼ 15% State avg: 4h 5m per day · National avg: 3h 26m per day
Physical Therapist Info Hours per resident per day provided by licensed Physical Therapists (PTs) or PT Assistants. PT services help residents recover mobility after injury or illness and are especially important for post-acute (short-stay) rehabilitation. 1m per day ▼ 80% State avg: 5m per day · National avg: 4m per day
RN (Weekend) Info Registered nurse hours specifically on weekends. Facilities sometimes reduce RN presence on Saturdays and Sundays — a low weekend RN figure compared to weekday hours can indicate reduced clinical oversight when most administrative staff are absent. 12m per day ▼ 60% State avg: 30m per day · National avg: 29m per day

Types of Care at Eureka Rehabilitation & Wellness Center

Respite Care Nursing Care

Capacity and availability

This home usually has availability

Occupancy lower than 85% suggests more openings may be available.

Lower occupancy than the California average: 84.7%
Occupancy rate 83% Rank #213 / 351Occupancy rate — State benchmarkedThis home is ranked 213th out of 351 homes in California. Shows this facility's occupancy rate versus the California average, with its Statewide rank out of 351. Higher occupancy signals strong local demand and financial stability.Click the rank badge to see the full State ranking.Click here to see the full State ranking.
Avg. Length of Stay 184 days
Occupancy rate
83% Rank #213 / 351Occupancy rate — State benchmarkedThis home is ranked 213th out of 351 homes in California. Shows this facility's occupancy rate versus the California average, with its Statewide rank out of 351. Higher occupancy signals strong local demand and financial stability.Click the rank badge to see the full State ranking.Click here to see the full State ranking.
Avg. Length of Stay
184 days
Walk Score
Walk Score: 42 / 100 Rank #291 / 359Walk Score — State benchmarkedThis home is ranked 291st out of 359 homes in California. Shows how walkable this facility's neighborhood is compared to the average Walk Score across California SNFs. Higher scores benefit residents, families, and staff.Click the rank badge to see the full State ranking.Click here to see the full State ranking.
Somewhat walkable. A few nearby services may be reachable on foot, but most trips require transportation.
BBB Rating
BBB Rating: A (Not Accredited)
An independent rating from the Better Business Bureau based on factors such as complaint history, transparency, and business practices.
How BBB ratings work

Memory & Specialized Care

1 service
No Alzheimer's certification

Contact Eureka Rehabilitation & Wellness Center

Inspection History

In California, the Department of Social Services (for assisted living facilities) and the Department of Public Health (for nursing homes) conduct inspections to ensure resident safety and regulatory compliance.

Since 2020 · 6 years of data 59 citations 0 complaint visits

Inspection Scorecard Info This scorecard compares key inspection, citation, and complaint metrics at this facility against the California state average. Metrics rated ≥15% worse than average are highlighted in red; those ≥15% better are highlighted in green.

Since 2020 vs. California state average
Overall vs. CA average 2 Worse Metrics worse than California average:
• Total citations (490% above)
• Citations per year (476% above)
3 Better Metrics better than California average:
• Total visits (100% below)
• Complaint visits (100% below)
• Other visits (100% below)
Latest Inspection August 26, 2025 Other

Citations Info Citations are formal regulatory issues recorded during state inspections.

This FacilityCA Averagevs. CA Avg
Total citations Info Formal regulatory issues recorded by inspectors across all inspection types. 5910 This facility has 490% more total citations than a typical California nursing home (59 vs. CA avg 10).↑ 490% worse
Citations per year Info Average citations per year since 2020. 9.81.7 This facility has 476% more citations per year than a typical California nursing home (9.8 vs. CA avg 1.7).↑ 476% worse

Inspections & Visits Info State inspections evaluate whether the facility meets health and safety standards.

This FacilityCA Averagevs. CA Avg
Total visits Info Combined count of complaint visits, other regulatory visits, and official scheduled inspections. 016 This facility has 100% fewer total visits than a typical California nursing home (0 vs. CA avg 16).↓ 100% better
Complaint visits Info On-site visits triggered by formal complaints filed by residents, families, or staff. 013 This facility has 100% fewer complaint visits than a typical California nursing home (0 vs. CA avg 13).↓ 100% better
Other visits Info Regulatory visits that are neither routine inspections nor complaint investigations — administrative check-ins, follow-up reviews, licensing-related visits. 07 This facility has 100% fewer other visits than a typical California nursing home (0 vs. CA avg 7).↓ 100% better

Inspection Reports Summary Info An editor-reviewed summary of the themes and findings across this facility's recent inspection reports.

Eureka Rehabilitation & Wellness Center’s inspection record is mixed, showing repeated failures in resident care planning, fall prevention, abuse reporting, and hygiene, with deficiencies cited as recently as August 26, 2025. Inspectors found two deficiencies then for failing to update care plans after resident abuse and to document 72-hour fall monitoring; prior complaints substantiated inadequate fall risk assessment and poor abuse reporting. Staffing shortages, missed showers, and food labeling issues have recurred over multiple inspections, indicating persistent problems despite ongoing oversight.

Read the full inspection reports for this facility, including detailed findings and corrective actions.

Show Inspection Reports

Health Inspection History

Inspections Since 2020
Total health inspections 15

California average 12.5


Last Health inspection on Aug 2025

Total health citations
61 Rank #265 / 354Health citations — State benchmarkedThis home is ranked 265th out of 354 homes in California. Shows this facility's total health deficiency citations benchmarked to the California State average, with a ranking across all 354 CA SNFs. Lower citation counts earn a better rank.Click the rank badge to see the full State ranking.Click here to see the full State ranking.

California average 50.2

Citations per inspection
4.07 Rank #173 / 354Citations per inspection — State benchmarkedThis home is ranked 173rd out of 354 homes in California. Shows average deficiency citations per CMS inspection for this facility versus the California mean across 354 SNFs with citation data. Lower is better.Click the rank badge to see the full State ranking.Click here to see the full State ranking.

California average 4.65


Health citations are formal notices following inspections when they fail to comply with safety and care standards.

41 of 61 citations resulted from standard inspections; and 20 of 61 resulted from complaint investigations.

Breakdown of citation severity (last 6 years)
Critical Health citations
1
150% worse than California average

California average: 0.4


Serious Health citations
1 Rank #1 / 156Serious citations (G–I) — State benchmarkedThis home is ranked 1st out of 156 homes in California. Shows G–I scope serious health citations for this facility versus other California SNFs. Lower counts rank better.Click the rank badge to see the full State ranking.Click here to see the full State ranking.
In line with California average

California average: 1

1 critical citation California average: 0.4

1 serious citation California average: 1

59 moderate citations California average: 47.2

0 minor citations California average: 1.5
Citations history (last 6 years)
Care Planning moderate citation Aug 26, 2025
Corrected

Care Planning moderate citation Jun 11, 2025
Corrected

Nutrition moderate citation Feb 19, 2025
Corrected

Care Planning moderate citation Feb 19, 2025
Corrected

Staffing Data

Reporting period: July 1 – September 30, 2025 (Q3 2025). Source: CMS Payroll-Based Journal report.

Total staff 215
Employees 76
Contractors 139
Staff to resident ratio 2.59:1
2590261% better than California average
California average ratio: 0.00:1 California average ratio: 0.00:1See full California ranking
Avg staff/day 48
Average shift 8.2 hours
6% better than California average
California average: 7.7 hours California average shift: 7.7 hoursSee full California ranking
Total staff hours (quarter) 36,032

Nursing staff breakdown

Q3 2025 · Jul 1 – Sep 30 More info This data comes from the CMS Payroll-Based Journal report covering July 1 – September 30, 2025.
Registered Nurse

Manages medical care and health needs.

Total count 12
Average shift length Info Average shift length. Calculated as total hours divided by days worked and average staff per day. 8.3 hours

This role is partially covered by contractors.

Licensed Practical Nurse

Assists with medical care and medications.

Total count 46
Average shift length Info Average shift length. Calculated as total hours divided by days worked and average staff per day. 9.2 hours

This role is partially covered by contractors.

Certified Nursing Assistant

Helps with daily care and mobility.

Total count 135
Average shift length Info Average shift length. Calculated as total hours divided by days worked and average staff per day. 8 hours

This role is partially covered by contractors.

Contractor staffing

Q3 2025 · Jul 1 – Sep 30 More info This data comes from the CMS Payroll-Based Journal report covering July 1 – September 30, 2025.

Total hours from contractors

36.7%

13,229 contractor hours this quarter

Certified Nursing Assistant: 90 Licensed Practical Nurse: 34 Registered Nurse: 10 Speech Language Pathologist: 1 Medical Director: 1 Occupational Therapy Assistant: 1 Physical Therapy Assistant: 1 Physical Therapy Aide: 1

Staff by category

Q3 2025 · Jul 1 – Sep 30 More info This data comes from the CMS Payroll-Based Journal report covering July 1 – September 30, 2025.
Certified Nursing Assistant459013520,10292100%8
Licensed Practical Nurse1234468,28592100%9.2
Other Dietary Services Staff5051,68992100%7
Speech Language Pathologist2131,2526470%7.9
Nurse Practitioner2027126975%8
Dietitian1016808592%8
Registered Nurse210126475863%8.3
Clinical Nurse Specialist1014966267%8
RN Director of Nursing1014766166%7.8
Dental Services Staff2024405964%7.1
Administrator1014325459%8
Qualified Social Worker1013195257%6.1
Physical Therapy Aide0112343033%7.8
Respiratory Therapy Technician1011372123%6.5
Occupational Therapy Assistant011911921%4.8
Physical Therapy Assistant0113044%7.5
Medical Director0111067%1.7
135 Certified Nursing Assistant
% of Days 100%
46 Licensed Practical Nurse
% of Days 100%
5 Other Dietary Services Staff
% of Days 100%
3 Speech Language Pathologist
% of Days 70%
2 Nurse Practitioner
% of Days 75%
1 Dietitian
% of Days 92%
12 Registered Nurse
% of Days 63%
1 Clinical Nurse Specialist
% of Days 67%
1 RN Director of Nursing
% of Days 66%
2 Dental Services Staff
% of Days 64%
1 Administrator
% of Days 59%
1 Qualified Social Worker
% of Days 57%
1 Physical Therapy Aide
% of Days 33%
1 Respiratory Therapy Technician
% of Days 23%
1 Occupational Therapy Assistant
% of Days 21%
1 Physical Therapy Assistant
% of Days 4%
1 Medical Director
% of Days 7%

Penalties and fines

Includes penalties issued in 2024

Federal penalties imposed by CMS for regulatory violations, including civil money penalties (fines) and denials of payment for new Medicare/Medicaid admissions.

Source: CMS Penalties Database (Data as of Jan 2026)

Total fines amount $8K Rank #210 / 354Federal fines — State benchmarkedThis home is ranked 210th out of 354 homes in California. Shows this facility's cumulative CMS federal fine dollars versus the California average among facilities with fines, and where it ranks among 354 skilled nursing facilities in the pool. Lower total dollars mean a better rank.Click the rank badge to see the full State ranking.Click here to see the full State ranking.
85% lower than California average

California average: $55K

Number of fines 1
58% fewer fines than California average

California average: 2.4

Payment Denials Info Serious action where Medicare and/or Medicaid temporarily stops payments for new residents until issues are fixed. 0
100% fewer payment denials than California average

California average: 0.5

Fines amount comparison
This facility $8K
California average $55K
Penalty History

Penalties are imposed by CMS for violations of federal nursing home regulations.

1 penalty in the past 3 years

Aug 14, 2024 · $8K

Civil Money Penalty Info Fines imposed for noncompliance, which can be assessed per day or per instance of violation. Aug 14, 2024
$8K

Last updated: Jan 2026

Quality of care over time

These measures show how residents usually do over time at this home, based on health outcomes and preventive care.

High-risk clinical events score Info A composite score based on pressure ulcers, falls with injury, weight loss, walking ability decline, and activities of daily living decline. 12.8
92% worse than California average

California average: 6.6

Functional decline score Info A composite score based on activities of daily living decline, walking ability decline, and incontinence. 24.1
112% worse than California average

California average: 11.3

Long-stay resident measures
Average California avg: 4.2 Info CMS star rating based on long-stay quality measure performance. 5 stars = significantly above average, 1 star = significantly below average.
Need for Help with Daily Activities Increased Info Percent of long-stay residents whose need for help with daily activities has increased 23.6%
114% worse than California average

California average: 11.1%

Walking Ability Worsened Info Percent of long-stay residents whose ability to move independently worsened 20.7%
72% worse than California average

California average: 12.0%

Low Risk Residents with Bowel/Bladder Incontinence Info Percent of low risk long-stay residents who lose control of their bowels or bladder 27.9%
147% worse than California average

California average: 11.3%

Falls with Major Injury Info Percent of long-stay residents experiencing one or more falls with major injury 4.8%
189% worse than California average

California average: 1.7%

High Risk Residents with Pressure Ulcers Info Percent of long-stay high risk residents with pressure ulcers 8.0%
62% worse than California average

California average: 5.0%

Urinary Tract Infection Info Percent of long-stay residents with a urinary tract infection 2.0%
57% worse than California average

California average: 1.2%

Lost Too Much Weight Info Percent of long-stay residents who lose too much weight 6.7%
59% worse than California average

California average: 4.2%

Depressive Symptoms Info Percent of long-stay residents who have depressive symptoms 3.2%
53% better than California average

California average: 6.7%

Antipsychotic Use Info Percent of long-stay residents who received an antipsychotic medication 21.5%
113% worse than California average

California average: 10.1%

Pneumococcal Vaccine Info Percent of long-stay residents assessed and appropriately given the pneumococcal vaccine 95.5%
In line with California average

California average: 98.5%

Influenza Vaccine Info Percent of long-stay residents assessed and appropriately given the seasonal influenza vaccine 98.8%
In line with California average

California average: 98.2%

Hospitalizations per 1,000 days Info Number of hospitalizations per 1,000 long-stay resident days. 1.24
45% better than California average

California average: 2.25

ED visits per 1,000 days Info Number of outpatient emergency department visits per 1,000 long-stay resident days. 1.64
In line with California average

California average: 1.59

Short-stay resident measures
Below average California avg: 3.5 Info CMS star rating based on short-stay quality measure performance. 5 stars = much above average, 1 star = much below average.
Pneumococcal Vaccine Info Percent of short-stay residents assessed and appropriately given the pneumococcal vaccine 76.3%
19% worse than California average

California average: 94.0%

Antipsychotic medication increase Info Percent of short-stay residents who newly received an antipsychotic medication 2.4%
63% worse than California average

California average: 1.5%

Influenza Vaccine Info Percent of short-stay residents assessed and appropriately given the seasonal influenza vaccine 84.3%
10% worse than California average

California average: 93.2%

Re-hospitalized after SNF stay Info Percentage of short-stay residents who were re-hospitalized after their nursing home admission. 23.6%
In line with California average

California average: 23.2%

Emergency department visits Info Percentage of short-stay residents who had an outpatient emergency department visit. 11.9%
6% worse than California average

California average: 11.2%

Falls with major injury Info Percentage of SNF residents who experience falls with major injury during their stay. 1.8%
138% worse than California average

California average: 0.8%

Ability to care for self at discharge Info Percentage of residents at or above expected ability to care for themselves at discharge. 45.3%
16% worse than California average

California average: 53.7%

Successful return to home or community Info Rate of successful return to home or community from a skilled nursing facility. 47.7%
6% worse than California average

California average: 50.6%

Breakdown by payment type

Medicare

79% of new residents, usually for short-term rehab.

Typical stay 1 - 2 months

Private pay

2% of new residents, often for short stays.

Typical stay 2 years

Medicaid

19% of new residents, often for long-term daily care.

Typical stay 2 years

Facility Characteristics

Source: CMS Long-Term Care Facility Characteristics (Data as of Jan 2026)

Total residents 83
Medicare
15
18.1% of residents
Medicaid
64
77.1% of residents
Private pay or other
4
4.8% of residents
Programs & Services
Residents Group

Residents meet regularly to discuss policies, care quality, and activities

Family Member Group

Family members meet regularly to discuss policies, care quality, and activities

Active Family Council

Organized group of family members that meets regularly to discuss facility policies, resident care, and activities.

Active Resident Council

Organized group of residents that meets regularly to discuss facility policies, quality of life, and activities.

Finances and operations

Privately-owned community
Home revenue
$15.9M
Operating loss
-$392.2K
Privately-owned community
Home revenue
$15.9M Rank #188 / 347Revenue — State benchmarkedThis home is ranked 188th out of 347 homes in California. Shows this facility's annual revenue compared to the California SNF average. Higher revenue generally means more resources for staffing and capital — read alongside Payroll %.Click the rank badge to see the full State ranking.Click here to see the full State ranking.
Operating loss
-$392.2K
Payroll costs Info The portion of the home's budget spent on staff, including nurses, caregivers, and other employees who support care and operations. Rank #296 / 347Payroll — State benchmarkedThis home is ranked 296th out of 347 homes in California. Shows total annual staff payroll benchmarked to the California average. Higher payroll investment relative to peers often signals better staffing and less reliance on cheaper contract labor.Click the rank badge to see the full State ranking.Click here to see the full State ranking.
$4.8M
30.5% of revenue Rank #331 / 347Payroll % — State benchmarkedThis home is ranked 331st out of 347 homes in California. Shows payroll as a percentage of revenue versus the California average. Well-run California SNFs typically land around 56–67% — the top third Statewide. Below 25% may signal understaffing or heavy agency use — read with Staffing ratings.Click the rank badge to see the full State ranking.Click here to see the full State ranking.
Other operating costs Info All remaining costs needed to run the home, such as food, utilities, building maintenance, supplies and administrative expenses.
$11.4M
Total costs $16.3M

What does this home offer?

Total residents icon

Total Residents: 99

Building type icon
Building type icon

Building Type: Two-story

Who this home usually serves

TYPE OF STAY

Mostly short-term rehab stays

Most residents typically stay for a few weeks or months before returning home or moving on.

Places of interest near Eureka Rehabilitation & Wellness Center

Address 2.4 miles from city center Info Estimated distance in miles from Eureka's city center to Eureka Rehabilitation & Wellness Center's address, calculated via Google Maps.

Calculate Travel Distance to Eureka Rehabilitation & Wellness Center

Add your location

Address

Financial Assistance for
Nursing Home in California

Eureka Rehabilitation & Wellness Center is located in Eureka, California.
Here are the financial assistance programs available to residents in California.

Get Financial aid guidance

Multipurpose Senior Services Program

MSSP (Medi-Cal Waiver)

Age 65+
General California resident, Medi-Cal eligible, nursing home risk.
Income Limits (2025) ~$2,829/month 300% FBR, individual
Asset Limits $2,000 (individual), $3,000 (couple).
CA

County-managed; waitlists possible.

Benefits
In-home support (4-6 hours/day) Respite care (14 days/year) Meals (~$6/meal) Transportation (8 trips/month) Care management

In-Home Supportive Services (IHSS)

California IHSS

Age 65+
General California resident, Medicaid-eligible or low-income.
Income Limits ~$1,732/month individual, Medi-Cal threshold
Asset Limits $2,000 individual
CA

Can hire family as caregivers.

Benefits
Personal care (up to 283 hours/month) Homemaker services Respite (varies)

Multipurpose Senior Services Program (MSSP)

CA MSSP

Age 65+
General California resident, Medi-Cal-eligible, nursing home-eligible but community-capable.
Income Limits ~$2,829/month 300% FBR, individual
Asset Limits $2,000 individual
CA

Available in 38 counties; waitlists common.

Benefits
Case management Respite care (up to 10 days/year) Minor home mods (avg. $500) Adult day care (~$50/day)

Property Tax Postponement Program (PTP)

CA PTP

Age 62+
General California resident, own and live in home, 40% equity.
Income Limits (2025) ~$51,500/year household, adjusted annually
Asset Limits Equity-based; no strict asset cap.
CA

Deferred taxes accrue interest (5% as of 2024); repaid upon sale/death.

Benefits
Property tax deferral (avg. $1,000-$3,000/year, varies by county)

Assisted Living Waiver (ALW)

CA ALW

Age 65+ or disabled
General California resident, Medi-Cal-eligible, nursing home-eligible.
Income Limits ~$2,829/month 300% FBR, individual
Asset Limits $2,000 individual
CA

Available in 15 counties (e.g., LA, Sacramento); waitlists common.

Benefits
Personal care in ALFs (5-7 hours/day) Medication management Social services

California CARES Program

CA CARES

Age
General Caregivers of California residents 60+ needing help with 3+ daily activities; no caregiver age limit.
Income Limits No strict limit; cost-sharing above ~$2,500/month threshold.
Asset Limits Not applicable; need-based.
CA

High demand in urban areas; complements IHSS respite.

Benefits
Respite care (up to 10 days/year) Counseling (4-6 sessions/year) Training (2-3 workshops/year) Supplies (~$200/year)

Frequently Asked Questions about Eureka Rehabilitation & Wellness Center

Is Eureka Rehabilitation & Wellness Center in a walkable area?

Eureka Rehabilitation & Wellness Center has a walk score of 42. Somewhat walkable. A few nearby services may be reachable on foot, but most trips require transportation.

Who is the administrator of Eureka Rehabilitation & Wellness Center?

field_administrator is the administrator of Eureka Rehabilitation & Wellness Center.

What is the address of Eureka Rehabilitation & Wellness Center?

Eureka Rehabilitation & Wellness Center is located at 2353 23rd St, Eureka, CA 95501, United States.

What is the phone number of Eureka Rehabilitation & Wellness Center?

(707) 443-7358 will put you in contact with the team at Eureka Rehabilitation & Wellness Center.

Is Eureka Rehabilitation & Wellness Center Medicare or Medicaid certified?

Yes — Eureka Rehabilitation & Wellness Center is a CMS-certified provider of Medicare and Medicaid.

Guides for Better Senior Living

Care Cost Calculator: See Prices in Your Area

Nursing Home Data Explorer

Don’t Wait Too Long: 7 Red Flag Signs Your Parent Needs Assisted Living Now

The True Cost of Assisted Living in 2025 – And How Families Are Paying For It

Understanding Senior Living Costs: Pricing Models, Discounts & Financial Assistance

Explore Open Rooms
1 Contact details
2 What type of senior care service are you looking for?
3 What budget do you have in mind for senior care?
4 How soon do you need to find care?
5 Additional details

Thank you for your interest!

Our team will be in touch shortly to help with next steps.