Explore Open Rooms

1 Contact details
2 What type of senior care service are you looking for?
3 What budget do you have in mind for senior care?
4 How soon do you need to find care?
5 Additional details

Thank you for your interest!

Our team will be in touch shortly to help with next steps.

Nursing Home

Meadowbrook Bolingbrook

Nursing Home

Meadowbrook Bolingbrook

431 Remington Blvd, Bolingbrook, IL 60440 View map
Overview of Meadowbrook Bolingbrook

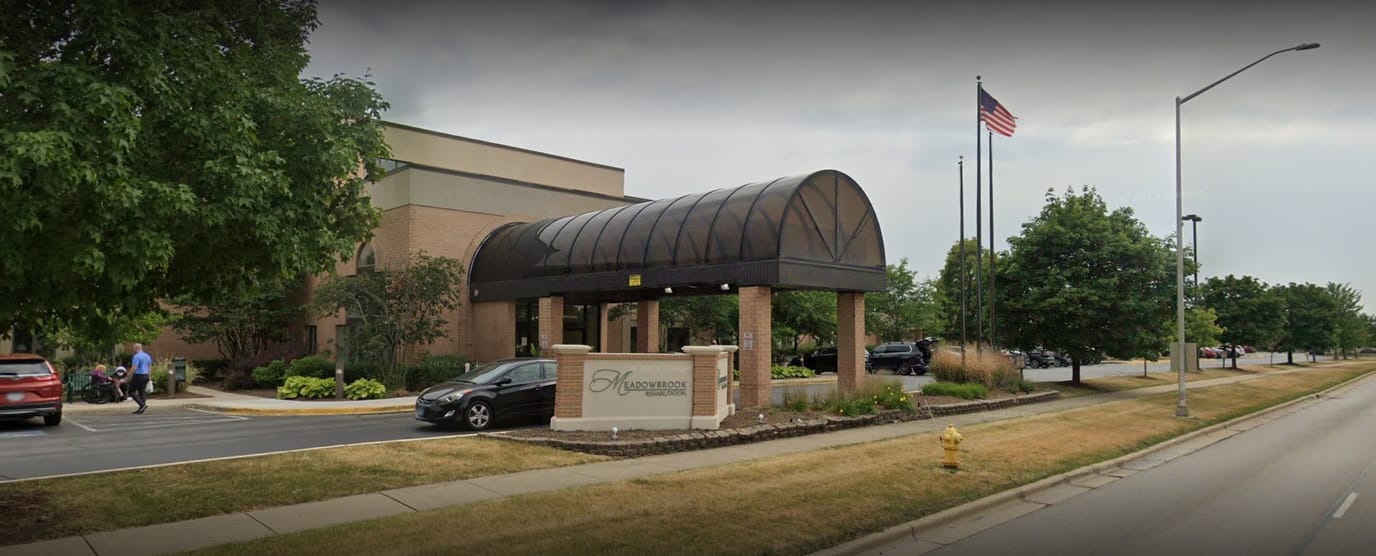
Ideally located in the tranquil grounds of West Remington Boulevard, Bolingbrook, IL, is the outstanding senior living community of Meadowbrook Bolingbrook that provides post-hospital rehabilitation, memory care, long-term care, and respite care. Featuring specialized care programs including wound management, orthopedic rehabilitation, and pulmonary rehab, the community ensures seniors receive the utmost care and assistance for their every need. Moreover, a kind and responsible team cares for seniors around the clock to ensure their comfort and safety.

Promoting a vibrant and inviting environment, the community conducts fun events and stimulating activities to keep residents happy and well. With AMITA Bolingbrook Hospital nearby, the community ensures residents’ medical needs are easily accessible. Meadowbrook Bolingbrook is great for seniors looking for supplementary care without restraining their freedom.

(630) 759-1112

Quality ratings

Measured by Centers for Medicare & Medicaid Services (CMS)

Overall rating Info The Overall CMS Rating combines results from health inspections, staffing levels and quality measures. Health inspections carry the most weight. Staffing and quality scores can increase or decrease the final rating based on performance compared to state and national standards.
1/5
Illinois average: 3.2/5
Health Inspection Info Based on the results of the facility's three most recent standard inspections and any complaint investigations. CMS reviews the number, scope, and severity of deficiencies, with more recent findings weighted more heavily.
1/5
Illinois average: 3.0/5
Staffing Info Measures average nursing staff hours per resident per day, including Registered Nurses (RNs) and total nursing staff. Ratings are adjusted based on the level of care residents require and are compared to state and national benchmarks.
2/5
Illinois average: 3.3/5
Quality Measures Info Based on clinical and physical health indicators reported to CMS, such as hospital readmissions, falls, pressure ulcers, and improvements in mobility. These measures reflect how well residents' health needs are being managed.
3/5
Illinois average: 3.2/5

Nursing care per resident

Info This shows how many total hours of nursing staff time are available per resident each day. Higher numbers usually mean more staff support.
2h 53m per day

This home provides 27% less nursing time per resident than the Illinois average.

Illinois average: 3h 57m per day

Staffing hours breakdown

Info Hours of care per resident per day, broken down by staff type. Data from CMS Medicare.
Staff type Facility State avg National avg
Registered Nurse (RN) Info Registered nurse hours per resident per day. 51m per day 44m per day 41m per day
Nurse Aide Info Nurse aide hours per resident per day. 2h 8m per day 2h 8m per day 2h 21m per day
Total Nursing (Weekend) Info Total number of nurse staff hours per resident per day on weekends. 3h 8m per day 3h 5m per day 3h 26m per day
Physical Therapist Info Physical therapist staff hours per resident per day. 3m per day 3m per day 4m per day
RN (Weekend) Info Registered nurse hours per resident per day on weekends. 35m per day 34m per day 29m per day

Capacity and availability

High-capacity home

May provide extensive amenities, services and programs.

Total beds 298

This home usually has availability

Lower occupancy suggests more openings may be available.

Lower demand than the Illinois average
Occupancy rate 75.8%
Residents per day (avg) 236
Occupancy rate
75.8%
Residents per day (avg)
236

Who this home usually serves

TYPE OF STAY

Mostly long-term care residents

Most residents stay for extended periods and receive ongoing daily care.

Might be optimal for
Long-term daily care Ongoing support needs

Breakdown by payment type

Medicare

12% of new residents, usually for short-term rehab.

Typical stay 3 - 4 months

Private pay

25% of new residents, often for short stays.

Typical stay 3 - 4 months

Medicaid

63% of new residents, often for long-term daily care.

Typical stay 3 - 4 months

Finances and operations

Privately-owned community
Operated by a business corporation.
Home revenue
$33.4M
Operating loss
-$294.8K
Privately-owned community Operated by a business corporation.
Home revenue
$33,387,770.00
Operating loss
$-294,810.00
Payroll costs Info The portion of the home's budget spent on staff, including nurses, caregivers, and other employees who support care and operations.
$11.6M
34.7% of revenue
Other operating costs Info All remaining costs needed to run the home, such as food, utilities, building maintenance, supplies and administrative expenses.
$22.1M
Total costs $33.7M
Years in operation
29 years in operation
A longer operating history, which may indicate experience navigating regulations and delivering ongoing care.
Walk Score
Walk Score: 33 / 100
Somewhat walkable. A few nearby services may be reachable on foot, but most trips require transportation.
BBB Rating
BBB Rating: C+ (Not Accredited)
An independent rating from the Better Business Bureau based on factors such as complaint history, transparency, and business practices.
How BBB ratings work

Staffing

Key information about the people who lead and staff this community.

Leadership

Contact: Tammy Johnson, Director

What does this home offer?

Accepts Medicaid icon

Accept Medicaid: Yes

Total residents icon

Total Residents: 298

Building type icon
Building type icon

Building Type: Single-story

Types of Care at Meadowbrook Bolingbrook

Nursing Home
Contact Meadowbrook Bolingbrook

Inspection History

In Illinois, the Department of Public Health, Office of Health Care Regulation conducts annual unannounced surveys to assess compliance with state and federal healthcare facility standards.

15 visits/inspections

8 visits/inspections triggered by complaints

4 routine inspections

Results

15 with issues

0 without issues

Latest inspection

Date:July 31, 2025
Type:Annual Inspection

56 deficiencies

Deficiencies indicate regulatory issues. A higher number implies the facility had several areas requiring improvement.

Health Inspection History

Inspections
Total health inspections 16

Illinois average 10.4


Last Health inspection on Jul 2025

Total health citations 48

Illinois average 36.8

Citations per inspection
3

Illinois average 3.68


Health citations are formal notices following inspections when they fail to comply with safety and care standards.

26 of 48 citations resulted from standard inspections; and 22 of 48 resulted from complaint investigations.

Breakdown of citation severity (last 3 years)
Critical Health citations More info 1
43% worse than Illinois average

Illinois average: 0.7


Serious Health citations More info 4
11% worse than Illinois average

Illinois average: 3.6

1 critical citation More info Illinois average: 0.7

4 serious citations More info Illinois average: 3.6

41 moderate citations More info Illinois average: 32

2 minor citations More info Illinois average: 0.5
Citations history (last 3 years)
Quality of Care serious citation Info Issues related to how well residents receive appropriate treatment and support for their medical and daily care needs. Jul 11, 2025
Corrected

Abuse/Neglect serious citation Info Issues related to protecting resident's from harm, including abuse, neglect, or mistreatment. Jun 11, 2025
Corrected

Pharmacy moderate citation Info Issues related to medication management, including how drugs are stored, administered, and monitored. Jun 11, 2025
Corrected

Pharmacy serious citation Info Issues related to medication management, including how drugs are stored, administered, and monitored. Jun 11, 2025
Corrected

Compare Nursing Homes around Bolingbrook The information below is reported by the Illinois Department of Public Health, Office of Health Care Regulation.

3 facilities compared · CMS & IL Dept. of Health data · Updated Mar 2026

Alden Estates of Naperville
NH

Nursing Home Licensed facility providing 24/7 skilled nursing care for residents with complex, ongoing medical needs. Staffed by RNs, LPNs, and CNAs. Inspected and star-rated annually by CMS. Accepts Medicare (short-term rehab) and Medicaid (long-term care).

Naperville IL 60565
-
72.1%
-
2.98
-
-
1
0
0
156
-
45
The Floyd A. Schlossberg Living Trust
$16,5M
$6,4M
38.7%
145582
Meadowbrook Bolingbrook
AL

Assisted Living A licensed, long-term care setting for seniors or individuals with disabilities who need help with daily activities — like bathing, dressing, and medication management — but not 24-hour skilled nursing. Offers housing, meals, and around-the-clock support while aiming to maximize resident independence.

IL

Independent Living Lifestyle-focused communities for older adults offering dining, activities, and transportation with minimal personal care. Best for active, independent seniors who want community without medical support.

MC

Memory Care Secured, specialized care for people living with Alzheimer's or dementia. Staff trained in cognitive impairment, with higher staff-to-resident ratios and an environment designed to reduce confusion and wandering risk.

NH

Nursing Home Licensed facility providing 24/7 skilled nursing care for residents with complex, ongoing medical needs. Staffed by RNs, LPNs, and CNAs. Inspected and star-rated annually by CMS. Accepts Medicare (short-term rehab) and Medicaid (long-term care).

Bolingbrook
298
77.5%
+12%
2.88
+33%
-7%
2
48
5
236
C+
33
Descendants S Corp Fbo Ashley Maria Dimas
$33,2M
$11,6M
34.9%
145710
Meadowbrook Naperville
-
NH

Nursing Home Licensed facility providing 24/7 skilled nursing care for residents with complex, ongoing medical needs. Staffed by RNs, LPNs, and CNAs. Inspected and star-rated annually by CMS. Accepts Medicare (short-term rehab) and Medicaid (long-term care).

Bolingbrook
-
-
-
-
-
-
-
-
-
0
0
0
-
-
52
-
-
-
-
-

Places of interest near Meadowbrook Bolingbrook

Address 1.9 miles from city center

Address 431 Remington Blvd, Bolingbrook, IL 60440

Calculate Travel Distance to Meadowbrook Bolingbrook

Add your location

Address

Staffing Data (Q2 2025)

This data corresponds to Q2 2025 and is based on CMS Payroll-Based Journal.

Total staff 289
Employees 257
Contractors 32
Staff to resident ratio 1.27:1
33% worse than Illinois average

Illinois average ratio: 1.90:1

Avg staff/day 114
Average shift 8.5 hours
12% better than Illinois average

Illinois average: 7.6 hours

Total staff hours (quarter) 88,003
Nursing staff breakdown
Registered Nurse

Manages medical care and health needs.

Total count 54
Average shift length Info Average shift length. Calculated as total hours divided by days worked and average staff per day. 8.7 hours

No contractors work on this role.

Licensed Practical Nurse

Assists with medical care and medications.

Total count 31
Average shift length Info Average shift length. Calculated as total hours divided by days worked and average staff per day. 9.9 hours

No contractors work on this role.

Certified Nursing Assistant

Helps with daily care and mobility.

Total count 141
Average shift length Info Average shift length. Calculated as total hours divided by days worked and average staff per day. 8.4 hours

This role is partially covered by contractors.

Contractor staffing

Total hours from contractors

3.4%

3,036 contractor hours this quarter

Speech Language Pathologist: 6 Occupational Therapy Assistant: 6 Qualified Social Worker: 6 Respiratory Therapy Technician: 4 Physical Therapy Assistant: 3 Physical Therapy Aide: 2 Certified Nursing Assistant: 1 Mental Health Service Worker: 1 Dietitian: 1 Clinical Nurse Specialist: 1 Occupational Therapy Aide: 1
Staff by category
Certified Nursing Assistant140114145,28591100%8.4
Registered Nurse5405418,03691100%8.7
Licensed Practical Nurse3103112,54991100%9.9
Other Dietary Services Staff220225,89891100%7.6
Dental Services Staff5051,5236470%8
Physical Therapy Aide0227717380%6.7
Speech Language Pathologist0667715864%7.5
Respiratory Therapy Technician0445536167%7.9
Administrator1015126470%8
Dietitian1124936167%7.9
Mental Health Service Worker1124495560%7.8
Nurse Practitioner2024405257%8
Qualified Social Worker0662734347%5.7
Occupational Therapy Assistant0661296167%1.6
Physical Therapy Assistant0331242932%4.1
Occupational Therapy Aide0111232426%5.1
Clinical Nurse Specialist011781314%6
141 Certified Nursing Assistant
% of Days 100%
54 Registered Nurse
% of Days 100%
31 Licensed Practical Nurse
% of Days 100%
22 Other Dietary Services Staff
% of Days 100%
5 Dental Services Staff
% of Days 70%
2 Physical Therapy Aide
% of Days 80%
6 Speech Language Pathologist
% of Days 64%
4 Respiratory Therapy Technician
% of Days 67%
1 Administrator
% of Days 70%
2 Dietitian
% of Days 67%
2 Mental Health Service Worker
% of Days 60%
2 Nurse Practitioner
% of Days 57%
6 Qualified Social Worker
% of Days 47%
6 Occupational Therapy Assistant
% of Days 67%
3 Physical Therapy Assistant
% of Days 32%
1 Occupational Therapy Aide
% of Days 26%
1 Clinical Nurse Specialist
% of Days 14%

Facility Characteristics

Source: CMS Long-Term Care Facility Characteristics (Data as of Jan 2026)

Total census
227 residents
Residents by payment source
Medicare
15 residents (6.6%)
Medicaid
159 residents (70%)
Private pay or other
53 residents (23.3%)
Programs & Services
Residents' Group

Residents meet regularly to discuss policies, care quality, and activities

Active Resident Council

Organized group of residents that meets regularly to discuss facility policies, quality of life, and activities.

Quality of care over time

These measures show how residents usually do over time at this home, based on health outcomes and preventive care.

High-risk clinical events score Info A composite score based on pressure ulcers, falls with injury, weight loss, walking ability decline, and activities of daily living decline. 10.1
In line with Illinois average

Illinois average: 9.7

Functional decline score Info A composite score based on activities of daily living decline, walking ability decline, and incontinence. 13.8
26% better than Illinois average

Illinois average: 18.6

Long-stay resident measures
Above average Illinois avg: 3.6 Info CMS star rating based on long-stay quality measure performance. 5 stars = significantly above average, 1 star = significantly below average.
Need for Help with Daily Activities Increased Info Percent of long-stay residents whose need for help with daily activities has increased 11.3%
27% better than Illinois average

Illinois average: 15.5%

Walking Ability Worsened Info Percent of long-stay residents whose ability to move independently worsened 17.0%
8% better than Illinois average

Illinois average: 18.4%

Low Risk Residents with Bowel/Bladder Incontinence Info Percent of low risk long-stay residents who lose control of their bowels or bladder 13.1%
40% better than Illinois average

Illinois average: 21.6%

Falls with Major Injury Info Percent of long-stay residents experiencing one or more falls with major injury 2.6%
22% better than Illinois average

Illinois average: 3.4%

High Risk Residents with Pressure Ulcers Info Percent of long-stay high risk residents with pressure ulcers 5.8%
9% worse than Illinois average

Illinois average: 5.3%

Urinary Tract Infection Info Percent of long-stay residents with a urinary tract infection 0.9%
53% better than Illinois average

Illinois average: 1.8%

Lost Too Much Weight Info Percent of long-stay residents who lose too much weight 13.9%
112% worse than Illinois average

Illinois average: 6.5%

Depressive Symptoms Info Percent of long-stay residents who have depressive symptoms 46.8%
In line with Illinois average

Illinois average: 48.1%

Antipsychotic Use Info Percent of long-stay residents who received an antipsychotic medication 25.5%
26% worse than Illinois average

Illinois average: 20.2%

Pneumococcal Vaccine Info Percent of long-stay residents assessed and appropriately given the pneumococcal vaccine 96.9%
9% better than Illinois average

Illinois average: 89.2%

Influenza Vaccine Info Percent of long-stay residents assessed and appropriately given the seasonal influenza vaccine 85.3%
7% worse than Illinois average

Illinois average: 91.6%

Hospitalizations per 1,000 days Info Number of hospitalizations per 1,000 long-stay resident days. 1.78
13% better than Illinois average

Illinois average: 2.05

ED visits per 1,000 days Info Number of outpatient emergency department visits per 1,000 long-stay resident days. 1.05
53% better than Illinois average

Illinois average: 2.25

Short-stay resident measures
Significantly below average Illinois avg: 2.0 Info CMS star rating based on short-stay quality measure performance. 5 stars = much above average, 1 star = much below average.
Pneumococcal Vaccine Info Percent of short-stay residents assessed and appropriately given the pneumococcal vaccine 82.8%
21% better than Illinois average

Illinois average: 68.3%

Antipsychotic medication increase Info Percent of short-stay residents who newly received an antipsychotic medication 2.3%
In line with Illinois average

Illinois average: 2.3%

Influenza Vaccine Info Percent of short-stay residents assessed and appropriately given the seasonal influenza vaccine 64.7%
In line with Illinois average

Illinois average: 63.0%

Re-hospitalized after SNF stay Info Percentage of short-stay residents who were re-hospitalized after their nursing home admission. 26.6%
In line with Illinois average

Illinois average: 26.2%

Emergency department visits Info Percentage of short-stay residents who had an outpatient emergency department visit. 10.2%
27% better than Illinois average

Illinois average: 14.0%

Falls with major injury Info Percentage of SNF residents who experience falls with major injury during their stay. 2.5%
226% worse than Illinois average

Illinois average: 0.8%

Ability to care for self at discharge Info Percentage of residents at or above expected ability to care for themselves at discharge. 28.0%
48% worse than Illinois average

Illinois average: 53.7%

Successful return to home or community Info Rate of successful return to home or community from a skilled nursing facility. 49.2%
In line with Illinois average

Illinois average: 50.6%

Penalties and fines

Federal penalties imposed by CMS for regulatory violations, including civil money penalties (fines) and denials of payment for new Medicare/Medicaid admissions.

Source: CMS Penalties Database (Data as of Jan 2026)

Total fines amount $197K
38% higher than Illinois average

Illinois average: $143K

Number of fines 1
66% fewer fines than Illinois average

Illinois average: 3.0

Payment Denials Info Serious action where Medicare and/or Medicaid temporarily stops payments for new residents until issues are fixed. 0
100% fewer payment denials than Illinois average

Illinois average: 1.1

Fines amount comparison
This facility $197K
Illinois average $143K
Penalty History

Penalties are imposed by CMS for violations of federal nursing home regulations.

Civil Money Penalty Info Fines imposed for noncompliance, which can be assessed per day or per instance of violation. Feb 21, 2025
$197K

Last updated: Jan 2026

Guides for Better Senior Living

Care Cost Calculator: See Prices in Your Area

Nursing Home Data Explorer

Don’t Wait Too Long: 7 Red Flag Signs Your Parent Needs Assisted Living Now

The True Cost of Assisted Living in 2025 – And How Families Are Paying For It

Understanding Senior Living Costs: Pricing Models, Discounts & Financial Assistance

Financial Aid for Illinois Seniors

Get financial aid guidance

Community Care Program

Illinois CCP

Age 60+, Illinois resident, at risk of nursing home placement.

~$1,215/month (individual).

$17,500 (individual, excludes home, car).

High demand in urban areas; waitlists possible.

Illinois Respite Program

IL Respite (via NFCSP)

Caregiver of someone 60+ (or with dementia), Illinois resident.

No strict limit; prioritizes low-income.

Not applicable.

Limited slots; urban/rural balance.

Supportive Living Program (SLP)

Illinois Medicaid Supportive Living Program

Age 65+ or 22-64 with disability, Illinois resident, Medicaid-eligible, needs moderate assistance (not nursing home-level).

~$2,829/month (300% FBR, individual); QIT allowed.

$2,000 (individual), $3,000 (couple) (excludes home, car).

~200 SLP sites statewide; room/board not covered.

Persons Who Are Elderly Waiver

Illinois Medicaid Elderly Waiver

Age 65+, Illinois resident, Medicaid-eligible, nursing home-level care need.

~$2,829/month (300% FBR, individual).

$2,000 (individual), $3,000 (couple).

Part of HealthChoice Illinois; consumer-directed options available.

Medicare Savings Program (MSP)

Illinois Medicare Savings Program

Age 65+ or disabled, Illinois resident, Medicare Part A/B.

~$2,510/month (QMB), ~$3,380/month (SLMB), ~$3,598/month (QI)—individual.

$9,430 (individual), $14,130 (couple).

Three tiers; no waitlist.

Senior Community Service Employment Program (SCSEP)

Illinois SCSEP

Age 55+, unemployed, low-income, Illinois resident.

~$1,983/month (125% FPL).

Not specified; income-focused.

Priority for veterans, rural residents.

Optional State Supplementation (OSS)

Illinois Optional State Supplementation

Age 65+ or disabled, Illinois resident, in approved facility, SSI recipient or low-income.

~$1,004/month (including SSI).

$2,000 (individual), $3,000 (couple).

~$50-$500/month based on facility type.

VA Aid and Attendance (A&A) and Housebound Benefits

Illinois VA Aid and Attendance/Housebound

Age 65+ or disabled veteran/spouse, Illinois resident, wartime service, need for ADL help (A&A) or homebound.

Net income < ~$1,984/month (veteran with dependent, A&A); pension offsets income.

~$155,356 (net worth limit).

High veteran demand in urban/rural areas.

Tour Icon
Planning a tour? Check our touring checklist.
Chat Icon
Thinking of living here? We can help you speak to a current resident