Cedar Ridge Health & Rehab Center

CMS overall rating Info The Overall CMS Rating is scored from 1 to 5 stars and combines results from health inspections, staffing levels, and quality measures. Health inspections carry the most weight. Staffing and quality scores can increase or decrease the final rating based on performance compared to state and national standards.
Cedar Ridge Health & Rehab Center
CMS overall rating Info The Overall CMS Rating is scored from 1 to 5 stars and combines results from health inspections, staffing levels, and quality measures. Health inspections carry the most weight. Staffing and quality scores can increase or decrease the final rating based on performance compared to state and national standards.

Overview of Cedar Ridge Health & Rehab Center

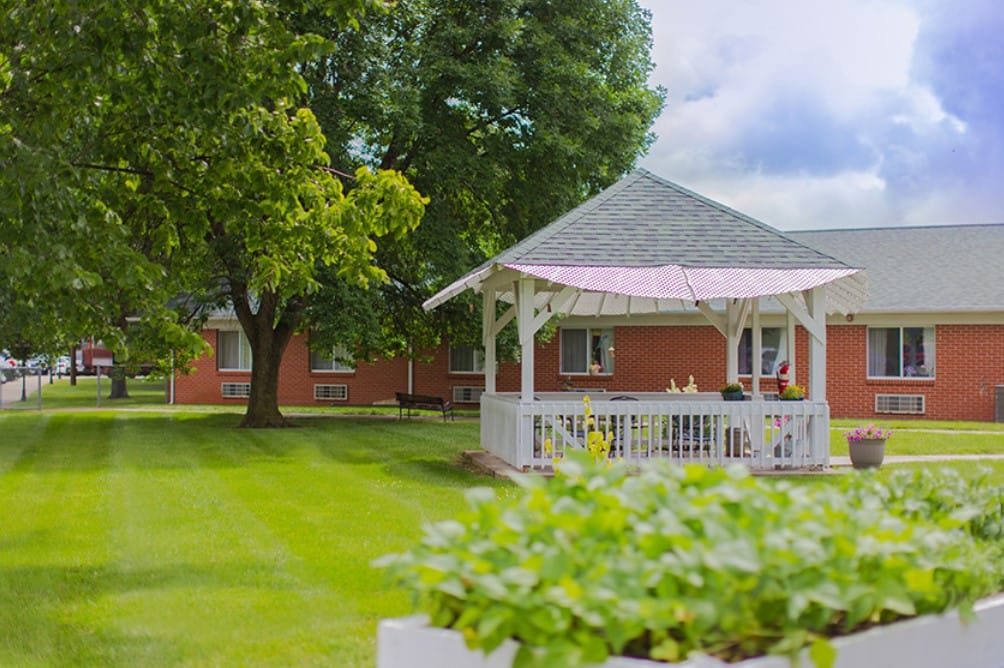
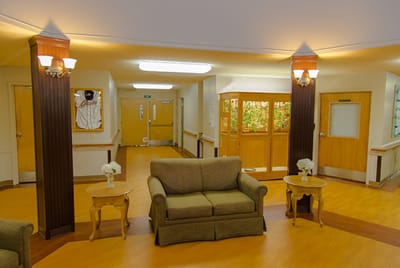
Experience the utmost care and assistance you deserve with Cedar Ridge Health & Rehab Center, a dedicated senior living community in Perryman Street, Lebanon, IL, offering skilled nursing, long-term care, and rehabilitation. Seniors keep their peace of mind with a licensed and well-trained team attending to their special needs and aspirations. Utilizing innovative technology and a holistic approach to care, the community strives to provide the highest quality of care 24/7.

The community is a certified great place to work, providing a conducive environment for residents and its care team to flourish and live to ther potential. Acknowledging the crucial role of meals to residents’ well-being, the community provides healthy and delicious meals that meets their nutritional needs and tastes. Cedar Ridge Health & Rehab Center is great for seniors aiming to maximize their independence with its incredible amenities.

Quality ratings

Measured by Centers for Medicare & Medicaid Services (CMS)

Overall rating Info The Overall CMS Rating combines results from health inspections, staffing levels and quality measures. Health inspections carry the most weight. Staffing and quality scores can increase or decrease the final rating based on performance compared to state and national standards.
1/5 ▼ 1.5 Illinois average: 2.5/5
Health Inspection Info Based on the results of the facility's three most recent standard inspections and any complaint investigations. CMS reviews the number, scope, and severity of deficiencies, with more recent findings weighted more heavily.
2/5 ▼ 0.8 Illinois average: 2.8/5
Staffing Info Measures average nursing staff hours per resident per day, including Registered Nurses (RNs) and total nursing staff. Ratings are adjusted based on the level of care residents require and are compared to state and national benchmarks.
1/5 ▼ 1.1 Illinois average: 2.1/5
Quality Measures Info Based on clinical and physical health indicators reported to CMS, such as hospital readmissions, falls, pressure ulcers, and improvements in mobility. These measures reflect how well residents' health needs are being managed.
2/5 ▼ 0.8 Illinois average: 2.8/5

Staffing hours breakdown

Info Daily nursing hours per resident by staff type, reported to CMS. Higher is generally better — compare this facility to state and national averages to see where staffing stands.

Hours per resident per day — compared to Illinois state averages

Total nursing care / resident Info This home is ranked 111th out of 128 homes in Illinois.

Total adjusted nursing hours per resident per day, combining RN, LPN, and aide time. CMS adjusts this for case-mix so facilities can be fairly compared.
2h 21m per day
Rank #111 / 128Nurse hours — state benchmarkedThis home is ranked 111th out of 128 homes in Illinois.Shows adjusted nurse hours per resident per day benchmarked to the Illinois average, with a ranking across 128 Illinois SNFs. More hours mean more direct care. The national average is about 3.5 hrs; below 3.0 is a red flag.
This facility Illinois avg (3h 6m per day)
vs Illinois avg
-24%

5 of 6 metrics below state avg

Staff type Hours / day vs state avg
Registered Nurse (RN) Info RNs hold the highest nursing license and can assess residents, interpret test results, and direct care plans. More RN hours per day often signals stronger clinical oversight and faster response to health changes. 45m per day ■ Avg State avg: 44m per day · National avg: 41m per day
LPN / LVN Info Licensed Practical Nurses (LPNs) or Licensed Vocational Nurses (LVNs) deliver routine hands-on care — medication administration, wound dressing, and monitoring vital signs. They work under RN supervision and make up a large share of daily bedside care. 27m per day ▼ 29% State avg: 38m per day · National avg: 52m per day
Nurse Aide Info Certified Nurse Aides (CNAs) provide the most direct day-to-day assistance: bathing, dressing, feeding, and mobility. Nurse aide hours are typically the largest staffing category and directly affect residents' quality of life. 1h 48m per day ▼ 16% State avg: 2h 8m per day · National avg: 2h 21m per day
Total Nursing (Weekend) Info Combined nursing hours (RN + LPN + Nurse Aide) per resident per day on weekends. Staffing often drops on weekends — this figure reveals whether the facility maintains adequate coverage outside of weekday hours. 2h 28m per day ▼ 20% State avg: 3h 5m per day · National avg: 3h 26m per day
Physical Therapist Info Hours per resident per day provided by licensed Physical Therapists (PTs) or PT Assistants. PT services help residents recover mobility after injury or illness and are especially important for post-acute (short-stay) rehabilitation. 1m per day ▼ 67% State avg: 3m per day · National avg: 4m per day
RN (Weekend) Info Registered nurse hours specifically on weekends. Facilities sometimes reduce RN presence on Saturdays and Sundays — a low weekend RN figure compared to weekday hours can indicate reduced clinical oversight when most administrative staff are absent. 24m per day ▼ 29% State avg: 34m per day · National avg: 29m per day

Capacity and availability

This home usually has limited availability

Occupancy between 85% and 95% suggests balanced demand.

Higher occupancy than the Illinois average: 69.3%
Occupancy rate 86.2% Rank #26 / 128Occupancy rate — state benchmarkedThis home is ranked 26th out of 128 homes in Illinois.Shows this facility's occupancy rate versus the Illinois average, with its statewide rank out of 128. Higher occupancy signals strong local demand and financial stability.
Avg. Length of Stay 77 days
Occupancy rate
86.2% Rank #26 / 128Occupancy rate — state benchmarkedThis home is ranked 26th out of 128 homes in Illinois.Shows this facility's occupancy rate versus the Illinois average, with its statewide rank out of 128. Higher occupancy signals strong local demand and financial stability.
Avg. Length of Stay
77 days

Who this home usually serves

TYPE OF STAY

Mix of rehab and long-term care

This home supports both short-term rehab and long-term care, with residents staying for a wide range of durations.

Breakdown by payment type

Medicare

24% of new residents, usually for short-term rehab.

Typical stay 25 days

Private pay

54% of new residents, often for short stays.

Typical stay 1 - 2 months

Medicaid

22% of new residents, often for long-term daily care.

Typical stay 7 - 8 months

Finances and operations

Privately-owned community
Operated by a business corporation.
Home revenue
$12.6M
Operating loss
-$749.3K
Privately-owned community Operated by a business corporation.
Home revenue
$12.6M Rank #77 / 126Revenue — state benchmarkedThis home is ranked 77th out of 126 homes in Illinois.Shows this facility's annual revenue compared to the Illinois SNF average. Higher revenue generally means more resources for staffing and capital — read alongside Payroll %.
Operating loss
-$749.3K
Payroll costs Info The portion of the home's budget spent on staff, including nurses, caregivers, and other employees who support care and operations. Rank #102 / 126Payroll — state benchmarkedThis home is ranked 102nd out of 126 homes in Illinois.Shows total annual staff payroll benchmarked to the Illinois average. Higher payroll investment relative to peers often signals better staffing and less reliance on cheaper contract labor.
$4.0M
31.6% of revenue Rank #91 / 126Payroll % — state benchmarkedThis home is ranked 91st out of 126 homes in Illinois.Shows payroll as a percentage of revenue versus the Illinois average. Well-run SNFs often land around 55–65%. Below 25% may signal understaffing or heavy agency use — read with Staffing ratings.
Other operating costs Info All remaining costs needed to run the home, such as food, utilities, building maintenance, supplies and administrative expenses.
$9.3M
Total costs $13.3M
Walk Score
Walk Score: 24 / 100 Rank #88 / 99Walk Score — state benchmarkedThis home is ranked 88th out of 99 homes in Illinois.Shows how walkable this facility's neighborhood is compared to the average Walk Score across Illinois SNFs. Higher scores benefit residents, families, and staff.
Car-dependent. Most errands require a car, with limited nearby walkable options.

About this community

Therapy & Rehabilitation

2 services
Rehabilitation Services
Respite Care

Staffing & Medical

1 service
24-Hour Staffing

Additional Services

2 services
Long/Short Term Care
Alzheimer's & Dementia Care

Amenities & Lifestyle

Beautiful Semi-Private Suites
Access To A Spacious Courtyard And Patio
Family Lounges To Entertain Guests
Laundry And Housekeeping Services
Wifi And Cable Tv
Specific ProgramsOrthopedic Rehabilitation, Cardiac Rehabilitation, Parkinson's Rehabilitation, Stroke Recovery, Discharge Concierge

What does this home offer?

Accepts Medicaid icon

Accept Medicaid: Yes, Accept

Total residents icon

Total Residents: 116 Residents

Housing options icon

Housing Options: Private / Semi-Private Rooms

Building type icon
Building type icon

Building Type: Single-story

Types of Care at Cedar Ridge Health & Rehab Center

Nursing Home Respite Care

Contact Cedar Ridge Health & Rehab Center

Health Inspection History

Inspections
Total health inspections 12

State average 10.4


Last Health inspection on Jan 2025

Total health citations
34 Rank #80 / 127Health citations — state benchmarkedThis home is ranked 80th out of 127 homes in Illinois.Shows this facility's total health deficiency citations benchmarked to the Illinois state average, with a ranking across all 127 IL SNFs. Lower citation counts earn a better rank.

State average 36.8

Citations per inspection
2.83

State average 3.68


Health citations are formal notices following inspections when they fail to comply with safety and care standards.

17 of 34 citations resulted from standard inspections; 16 of 34 resulted from complaint investigations; and 1 of 34 came from combined inspections (standard and complaint).

Breakdown of citation severity (last 3 years)
Critical Health citations More info
1 Rank #79 / 97Severe citations — state benchmarkedThis home is ranked 79th out of 97 homes in Illinois.Shows citations where actual resident harm occurred, compared to the Illinois average and ranked across 97 SNFs statewide. Even a single severe citation is significant — lower is always better.
43% worse than State average

State average: 0.7


Serious Health citations More info 6
67% worse than State average

State average: 3.6

1 critical citation More info State average: 0.7

6 serious citations More info State average: 3.6

27 moderate citations More info State average: 32

0 minor citations More info State average: 0.5
Citations history (last 3 years)
Infection Control moderate citation Info Issues related to preventing and controlling infections, including hygiene practices and safety protocols. Jan 30, 2025
Corrected

Infection Control moderate citation Info Issues related to preventing and controlling infections, including hygiene practices and safety protocols. Jan 30, 2025
Corrected

Nutrition moderate citation Info Issues related to food quality, meal service, and resident's nutritional needs. Jan 30, 2025
Corrected

Pharmacy moderate citation Info Issues related to medication management, including how drugs are stored, administered, and monitored. Jan 30, 2025
Corrected

Compare Nursing Homes around the area The information below is reported by the Illinois Department of Public Health, Office of Health Care Regulation.

1 facility compared · CMS & IL Dept. of Health data · Updated Apr 2026

Filter by care type
Cedar Ridge Health & Rehab Center
AL

Assisted Living A licensed, long-term care setting for seniors or individuals with disabilities who need help with daily activities — like bathing, dressing, and medication management — but not 24-hour skilled nursing. Offers housing, meals, and around-the-clock support while aiming to maximize resident independence.

IL

Independent Living Lifestyle-focused communities for older adults offering dining, activities, and transportation with minimal personal care. Best for active, independent seniors who want community without medical support.

MC

Memory Care Secured, specialized care for people living with Alzheimer's or dementia. Staff trained in cognitive impairment, with higher staff-to-resident ratios and an environment designed to reduce confusion and wandering risk.

NH

Nursing Home Licensed facility providing 24/7 skilled nursing care for residents with complex, ongoing medical needs. Staffed by RNs, LPNs, and CNAs. Inspected and star-rated annually by CMS. Accepts Medicare (short-term rehab) and Medicaid (long-term care).

Lebanon 116 86.2% +24% 2.35 +12% -24% 4 34 2.8 7 98 - 24 Altobella, Michael $12.6M $4.0M 31.6% 145571

Financial Assistance in
Illinois

Get Financial aid guidance

Community Care Program

Illinois CCP

Age 60+
General Illinois resident, at risk of nursing home placement.
Income Limits (2025) ~$1,215/month individual
Asset Limits $17,500 individual, excludes home, car
IL

High demand in urban areas; waitlists possible.

Benefits
In-home care (3-5 hours/day) Adult day services ($65/day) Emergency home response systems ($30/month)

Illinois Respite Program

IL Respite (via NFCSP)

Age Caregiver of someone 60+ (or with dementia)
General Illinois resident.
Income Limits No strict limit; prioritizes low-income.
Asset Limits Not applicable.
IL

Limited slots; urban/rural balance.

Benefits
In-home respite (4-6 hours/day) Adult day care (~$65/day) Short-term facility care (up to 5 days)

Supportive Living Program (SLP)

Illinois Medicaid Supportive Living Program

Age 65+ or 22-64 with disability
General Illinois resident, Medicaid-eligible, needs moderate assistance (not nursing home-level).
Income Limits (2025) ~$2,829/month (300% FBR, individual); QIT allowed.
Asset Limits $2,000 (individual), $3,000 (couple) (excludes home, car).
IL

~200 SLP sites statewide; room/board not covered.

Benefits
Personal care (5-7 hours/day, e.g., bathing, mobility) Meals Housekeeping Medication management Respite (~240 hours/year)

Persons Who Are Elderly Waiver

Illinois Medicaid Elderly Waiver

Age 65+
General Illinois resident, Medicaid-eligible, nursing home-level care need.
Income Limits (2025) ~$2,829/month 300% FBR, individual
Asset Limits $2,000 (individual), $3,000 (couple).
IL

Part of HealthChoice Illinois; consumer-directed options available.

Benefits
Personal care (5-7 hours/day, e.g., dressing, eating) Homemaker Adult day care (~$60/day) Respite (240 hours/year) Home mods ($1,000 avg.)

Medicare Savings Program (MSP)

Illinois Medicare Savings Program

Age 65+ or disabled
General Illinois resident, Medicare Part A/B.
Income Limits (2025) ~$2,510/month (QMB), ~$3,380/month (SLMB), ~$3,598/month (QI)—individual.
Asset Limits $9,430 (individual), $14,130 (couple).
IL

Three tiers; no waitlist.

Benefits
Covers Part B premiums ($174.70/month) Deductibles ($240/year) Copays (~20%)

Senior Community Service Employment Program (SCSEP)

Illinois SCSEP

Age 55+
General unemployed, low-income, Illinois resident.
Income Limits (2025) ~$1,983/month 125% FPL
Asset Limits Not specified; income-focused.
IL

Priority for veterans, rural residents.

Benefits
Paid training (~20 hours/week at ~$7.25/hour) Job placement

Optional State Supplementation (OSS)

Illinois Optional State Supplementation

Age 65+ or disabled
General Illinois resident, in approved facility, SSI recipient or low-income.
Income Limits (2025) ~$1,004/month including SSI
Asset Limits $2,000 (individual), $3,000 (couple).
IL

~$50-$500/month based on facility type.

Benefits
Cash (~$50-$500/month) for room/board in personal care homes or SLFs

VA Aid and Attendance (A&A) and Housebound Benefits

Illinois VA Aid and Attendance/Housebound

Age 65+ or disabled veteran/spouse
General Illinois resident, wartime service, need for ADL help (A&A) or homebound.
Income Limits (2025) Net income < ~$1,984/month (veteran with dependent, A&A); pension offsets income.
Asset Limits ~$155,356 net worth limit
IL

High veteran demand in urban/rural areas.

Benefits
Cash (~$1,433-$2,642/month veteran, ~$951-$1,318 spouse) for care costs (e.g., in-home, assisted living)

Places of interest near Cedar Ridge Health & Rehab Center

Address 7.5 miles from city center Info Estimated distance in miles from Lebanon's city center to Cedar Ridge Health & Rehab Center's address, calculated via Google Maps.

Calculate Travel Distance to Cedar Ridge Health & Rehab Center

Add your location

Address

Staffing Data (Q2 2025)

This data corresponds to Q2 2025 and is based on CMS Payroll-Based Journal.

Total staff 152
Employees 96
Contractors 56
Staff to resident ratio 1.54:1
19% worse than Illinois average

Illinois average ratio: 1.90:1

Avg staff/day 46
Average shift 7.6 hours
0% compared with Illinois average

Illinois average: 7.6 hours

Total staff hours (quarter) 31,891
Nursing staff breakdown
Registered Nurse

Manages medical care and health needs.

Total count 24
Average shift length Info Average shift length. Calculated as total hours divided by days worked and average staff per day. 7.5 hours

This role is partially covered by contractors.

Licensed Practical Nurse

Assists with medical care and medications.

Total count 14
Average shift length Info Average shift length. Calculated as total hours divided by days worked and average staff per day. 8.7 hours

No contractors work on this role.

Certified Nursing Assistant

Helps with daily care and mobility.

Total count 73
Average shift length Info Average shift length. Calculated as total hours divided by days worked and average staff per day. 8 hours

This role is partially covered by contractors.

Contractor staffing

Total hours from contractors

19%

6,045 contractor hours this quarter

Registered Nurse: 17 Certified Nursing Assistant: 9 Speech Language Pathologist: 6 Physical Therapy Aide: 5 Physical Therapy Assistant: 5 Qualified Social Worker: 4 Mental Health Service Worker: 4 Feeding Assistant: 3 Respiratory Therapy Technician: 2 Medical Director: 1
Staff by category
Certified Nursing Assistant 64 9 73 17,049 91 100% 8
Registered Nurse 7 17 24 4,791 91 100% 7.5
Licensed Practical Nurse 14 0 14 4,191 91 100% 8.7
Physical Therapy Aide 0 5 5 1,027 65 71% 5.8
Other Dietary Services Staff 4 0 4 908 83 91% 6.8
Diagnostic X-ray Services Staff 3 0 3 904 62 68% 8
Speech Language Pathologist 0 6 6 863 73 80% 6.6
Administrator 1 0 1 488 61 67% 8
Qualified Social Worker 0 4 4 473 63 69% 7.1
Nurse Practitioner 1 0 1 464 58 64% 8
Physical Therapy Assistant 0 5 5 287 66 73% 4.1
Respiratory Therapy Technician 0 2 2 243 62 68% 3.9
Occupational Therapy Aide 1 0 1 112 15 16% 7.5
Clinical Nurse Specialist 1 0 1 48 6 7% 8
Feeding Assistant 0 3 3 23 10 11% 2.1
Mental Health Service Worker 0 4 4 19 11 12% 1.6
Medical Director 0 1 1 2 1 1% 2
73 Certified Nursing Assistant
% of Days 100%
24 Registered Nurse
% of Days 100%
14 Licensed Practical Nurse
% of Days 100%
5 Physical Therapy Aide
% of Days 71%
4 Other Dietary Services Staff
% of Days 91%
3 Diagnostic X-ray Services Staff
% of Days 68%
6 Speech Language Pathologist
% of Days 80%
1 Administrator
% of Days 67%
4 Qualified Social Worker
% of Days 69%
1 Nurse Practitioner
% of Days 64%
5 Physical Therapy Assistant
% of Days 73%
2 Respiratory Therapy Technician
% of Days 68%
1 Occupational Therapy Aide
% of Days 16%
1 Clinical Nurse Specialist
% of Days 7%
3 Feeding Assistant
% of Days 11%
4 Mental Health Service Worker
% of Days 12%
1 Medical Director
% of Days 1%

Facility Characteristics

Source: CMS Long-Term Care Facility Characteristics (Data as of Jan 2026)

Total residents 99
Medicare
8
8.1% of residents
Medicaid
90
90.9% of residents
Private pay or other
1
1% of residents
Programs & Services
Residents Group

Residents meet regularly to discuss policies, care quality, and activities

Active Resident Council

Organized group of residents that meets regularly to discuss facility policies, quality of life, and activities.

Quality of care over time

These measures show how residents usually do over time at this home, based on health outcomes and preventive care.

High-risk clinical events score Info A composite score based on pressure ulcers, falls with injury, weight loss, walking ability decline, and activities of daily living decline. 7.6
22% better than Illinois average

Illinois average: 9.7

Functional decline score Info A composite score based on activities of daily living decline, walking ability decline, and incontinence. 16.2
13% better than Illinois average

Illinois average: 18.6

Long-stay resident measures
Above average Illinois avg: 3.6 Info CMS star rating based on long-stay quality measure performance. 5 stars = significantly above average, 1 star = significantly below average.
Need for Help with Daily Activities Increased Info Percent of long-stay residents whose need for help with daily activities has increased 9.6%
38% better than Illinois average

Illinois average: 15.5%

Walking Ability Worsened Info Percent of long-stay residents whose ability to move independently worsened 9.0%
51% better than Illinois average

Illinois average: 18.4%

Low Risk Residents with Bowel/Bladder Incontinence Info Percent of low risk long-stay residents who lose control of their bowels or bladder 30.0%
39% worse than Illinois average

Illinois average: 21.6%

Falls with Major Injury Info Percent of long-stay residents experiencing one or more falls with major injury 2.2%
33% better than Illinois average

Illinois average: 3.4%

High Risk Residents with Pressure Ulcers Info Percent of long-stay high risk residents with pressure ulcers 8.2%
55% worse than Illinois average

Illinois average: 5.3%

Urinary Tract Infection Info Percent of long-stay residents with a urinary tract infection 2.4%
30% worse than Illinois average

Illinois average: 1.8%

Lost Too Much Weight Info Percent of long-stay residents who lose too much weight 9.0%
38% worse than Illinois average

Illinois average: 6.5%

Depressive Symptoms Info Percent of long-stay residents who have depressive symptoms 78.9%
64% worse than Illinois average

Illinois average: 48.1%

Antipsychotic Use Info Percent of long-stay residents who received an antipsychotic medication 12.3%
39% better than Illinois average

Illinois average: 20.2%

Pneumococcal Vaccine Info Percent of long-stay residents assessed and appropriately given the pneumococcal vaccine 97.8%
10% better than Illinois average

Illinois average: 89.2%

Influenza Vaccine Info Percent of long-stay residents assessed and appropriately given the seasonal influenza vaccine 98.0%
7% better than Illinois average

Illinois average: 91.6%

Hospitalizations per 1,000 days Info Number of hospitalizations per 1,000 long-stay resident days. 2.72
33% worse than Illinois average

Illinois average: 2.05

ED visits per 1,000 days Info Number of outpatient emergency department visits per 1,000 long-stay resident days. 2.63
17% worse than Illinois average

Illinois average: 2.25

Short-stay resident measures
Significantly below average Illinois avg: 2.3 Info CMS star rating based on short-stay quality measure performance. 5 stars = much above average, 1 star = much below average.
Pneumococcal Vaccine Info Percent of short-stay residents assessed and appropriately given the pneumococcal vaccine 91.1%
33% better than Illinois average

Illinois average: 68.3%

Antipsychotic medication increase Info Percent of short-stay residents who newly received an antipsychotic medication 1.8%
24% better than Illinois average

Illinois average: 2.3%

Influenza Vaccine Info Percent of short-stay residents assessed and appropriately given the seasonal influenza vaccine 85.7%
36% better than Illinois average

Illinois average: 63.0%

Re-hospitalized after SNF stay Info Percentage of short-stay residents who were re-hospitalized after their nursing home admission. 26.6%
In line with Illinois average

Illinois average: 26.2%

Emergency department visits Info Percentage of short-stay residents who had an outpatient emergency department visit. 11.3%
19% better than Illinois average

Illinois average: 14.0%

Falls with major injury Info Percentage of SNF residents who experience falls with major injury during their stay. 0.0%
100% better than Illinois average

Illinois average: 0.8%

Ability to care for self at discharge Info Percentage of residents at or above expected ability to care for themselves at discharge. 45.6%
15% worse than Illinois average

Illinois average: 53.7%

Successful return to home or community Info Rate of successful return to home or community from a skilled nursing facility. 48.6%
In line with Illinois average

Illinois average: 50.6%

Penalties and fines

Federal penalties imposed by CMS for regulatory violations, including civil money penalties (fines) and denials of payment for new Medicare/Medicaid admissions.

Source: CMS Penalties Database (Data as of Jan 2026)

Total fines amount $141K
In line with Illinois average

Illinois average: $143K

Number of fines 3 Rank #58 / 74Federal fines — state benchmarkedThis home is ranked 58th out of 74 homes in Illinois.Shows this facility's CMS fine count alongside the Illinois average, and where it ranks among all 74 skilled nursing facilities in the state. Fewer fines mean a better rank.
In line with Illinois average

Illinois average: 3.0

Payment Denials Info Serious action where Medicare and/or Medicaid temporarily stops payments for new residents until issues are fixed. 2
89% more payment denials than Illinois average

Illinois average: 1.1

Fines amount comparison
This facility $141K
Illinois average $143K
Penalty History

Penalties are imposed by CMS for violations of federal nursing home regulations.

Civil Money Penalty Info Fines imposed for noncompliance, which can be assessed per day or per instance of violation. Aug 11, 2023
$15K
Civil Money Penalty Info Fines imposed for noncompliance, which can be assessed per day or per instance of violation. Jun 20, 2023
$55K
Payment Denial Info Serious action where Medicare and/or Medicaid temporarily stops payments for new residents until issues are fixed. Jun 20, 2023
13 days
Civil Money Penalty Info Fines imposed for noncompliance, which can be assessed per day or per instance of violation. Mar 7, 2023
$70K

Last updated: Jan 2026

Guides for Better Senior Living

Care Cost Calculator: See Prices in Your Area

Nursing Home Data Explorer

Don’t Wait Too Long: 7 Red Flag Signs Your Parent Needs Assisted Living Now

The True Cost of Assisted Living in 2025 – And How Families Are Paying For It

Understanding Senior Living Costs: Pricing Models, Discounts & Financial Assistance

Explore Open Rooms
1 Contact details
2 What type of senior care service are you looking for?
3 What budget do you have in mind for senior care?
4 How soon do you need to find care?
5 Additional details

Thank you for your interest!

Our team will be in touch shortly to help with next steps.