Explore Open Rooms

1 Contact details
2 What type of senior care service are you looking for?
3 What budget do you have in mind for senior care?
4 How soon do you need to find care?
5 Additional details

Thank you for your interest!

Our team will be in touch shortly to help with next steps.

Nursing Home in Pflugerville

CMS overall rating Info The Overall CMS Rating combines results from health inspections, staffing levels and quality measures. Health inspections carry the most weight. Staffing and quality scores can increase or decrease the final rating based on performance compared to state and national standards.

Pflugerville Nursing and Rehabilitation Center

104 Rex Kerwin Ct, Pflugerville, TX 78660 View map
Overview of Pflugerville Nursing and Rehabilitation Center

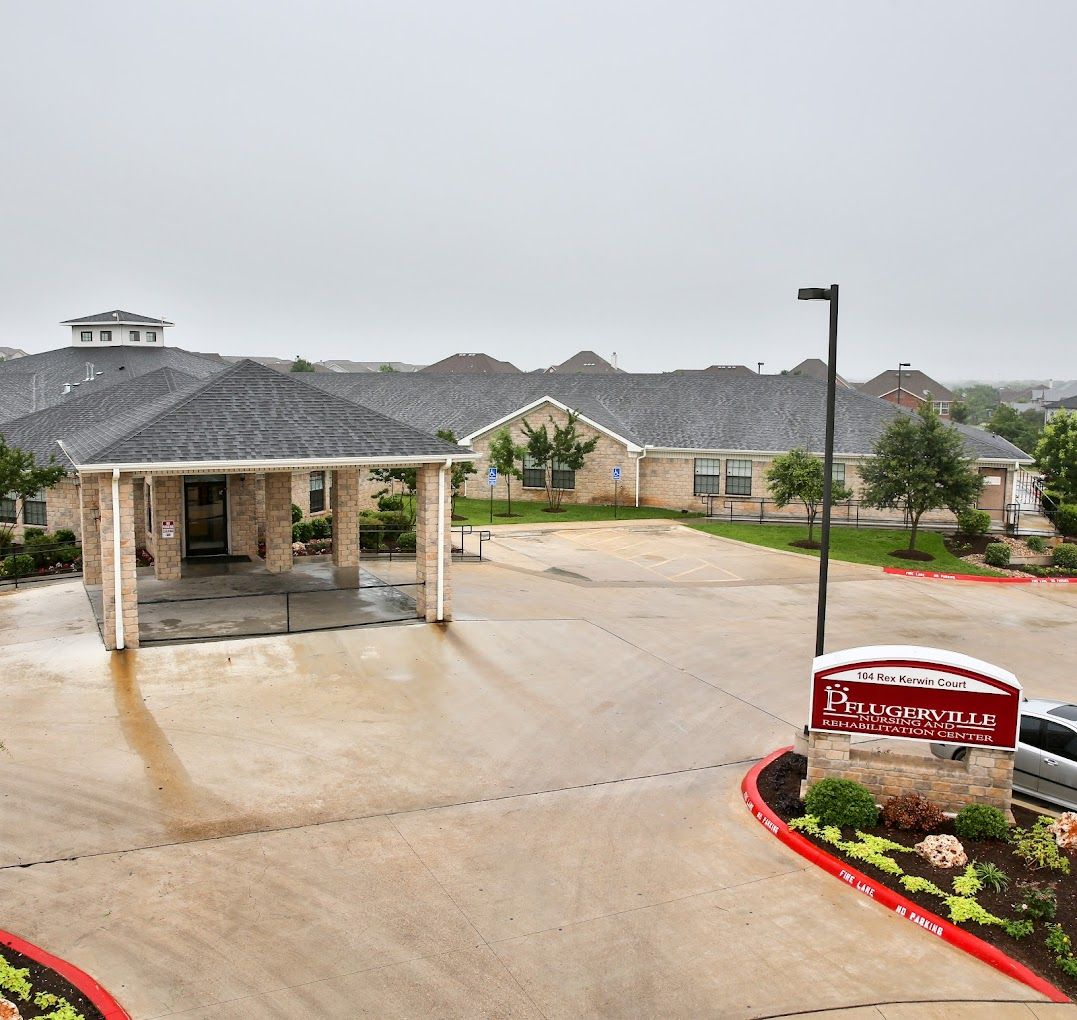
Located in the tranquil neighborhood of Rex Kerwin Court, Pflugerville, TX, is the outstanding senior living community of Pflugerville Nursing and Rehabilitation Center that provides skilled nursing, clinical services, therapy services, rehabilitation, and hospice care. The community works hard to meet seniors’ needs and aspirations 24/7 with the highest quality of care and assistance. With comprehensive care services, seniors and families can rest assured of finding the right care for their every need.

End-of-life journey can be intimidating and lonely, hence, the community supports families and accompanies residents to give them a positive outlook. With an abundance of recreational activities, residents always have something to do to keep an active and well-connected lifestyle. Pflugerville Nursing and Rehabilitation Center is a good place for seniors in need of supplementary care with its state-of-the-art amenities and genuine care.

(512) 251-3915

Quality ratings

Measured by Centers for Medicare & Medicaid Services (CMS)

Overall rating Info The Overall CMS Rating combines results from health inspections, staffing levels and quality measures. Health inspections carry the most weight. Staffing and quality scores can increase or decrease the final rating based on performance compared to state and national standards.
4/5
Texas average: 3.0/5
Health Inspection Info Based on the results of the facility's three most recent standard inspections and any complaint investigations. CMS reviews the number, scope, and severity of deficiencies, with more recent findings weighted more heavily.
3/5
Texas average: 2.9/5
Staffing Info Measures average nursing staff hours per resident per day, including Registered Nurses (RNs) and total nursing staff. Ratings are adjusted based on the level of care residents require and are compared to state and national benchmarks.
2/5
Texas average: 2.4/5
Quality Measures Info Based on clinical and physical health indicators reported to CMS, such as hospital readmissions, falls, pressure ulcers, and improvements in mobility. These measures reflect how well residents' health needs are being managed.
5/5
Texas average: 4.0/5

Nursing care per resident

Info This shows how many total hours of nursing staff time are available per resident each day. Higher numbers usually mean more staff support.
2h 43m per day

This home provides 28% less nursing time per resident than the Texas average.

Texas average: 3h 47m per day

Staffing hours breakdown

Info Hours of care per resident per day, broken down by staff type. Data from CMS Medicare.
Staff type Facility State avg National avg
Registered Nurse (RN) Info Registered nurse hours per resident per day. 18m per day 26m per day 41m per day
Nurse Aide Info Nurse aide hours per resident per day. 1h 49m per day 2h 1m per day 2h 21m per day
Total Nursing (Weekend) Info Total number of nurse staff hours per resident per day on weekends. 2h 27m per day 2h 59m per day 3h 26m per day
Physical Therapist Info Physical therapist staff hours per resident per day. 3m per day 4m per day 4m per day
RN (Weekend) Info Registered nurse hours per resident per day on weekends. 10m per day 21m per day 29m per day

Capacity and availability

Medium-capacity home

Offers a balance of services and community atmosphere.

Total beds 120

This home usually has availability

Lower occupancy suggests more openings may be available.

Lower demand than the Texas average
Occupancy rate 20%
Residents per day 24
Occupancy rate
20%
Residents per day
24

Who this home usually serves

TYPE OF STAY

Mostly long-term care residents

Most residents stay for extended periods and receive ongoing daily care.

Might be optimal for
Long-term daily care Ongoing support needs

Breakdown by payment type

Medicare

13% of new residents, usually for short-term rehab.

Typical stay 1 - 2 months

Private pay

61% of new residents, often for short stays.

Typical stay 1 months

Medicaid

26% of new residents, often for long-term daily care.

Typical stay 1 years

Finances and operations

Governmental community
Operated by city and county authorities.
Home revenue
$10.5M
Surplus of revenue
$939.5K
Governmental community Operated by city and county authorities.
Home revenue
$10,465,036.00
Surplus of revenue
$939,462.00
Payroll costs Info The portion of the home's budget spent on staff, including nurses, caregivers, and other employees who support care and operations.
$4.7M
45.3% of revenue
Other operating costs Info All remaining costs needed to run the home, such as food, utilities, building maintenance, supplies and administrative expenses.
$4.8M
Total costs $9.5M
Bed community size
120-bed community
A larger shared setting that may offer more common spaces and organized community services.
Years in operation
16 years in operation
A community with a solid operating history and experience delivering ongoing care.
Walk Score
Walk Score: 40 / 100
Somewhat walkable. A few nearby services may be reachable on foot, but most trips require transportation.

Services

Medicare/medicaid

About this community

Occupancy

Occupancy rate
20%
In line with Texas average
Occupied beds
24 / 120
Average residents 75 per day

License Details

Facility TypeNursing
StatusActive
IssuanceFebruary 28, 2025
ExpirationFebruary 28, 2028
CountyTRAVIS

Additional Licensing Details

License Number144961
Year Opened3/18/2010

Ownership & Operating Entity

Pflugerville Nursing and Rehabilitation Center is administrated by Akil A Chavies.

Management CompanyREGENCY IHS OF PFLUGERVILLE, LLC
OwnerDEWITT MEDICAL DISTRICT
Ownership TypeHOSPITAL DISTRICT/AUTHORITY

Type Of Units

Medicaid and Medicare
120 units
Total beds
120 units

Staffing

Key information about the people who lead and staff this community.

Leadership

Administrator Email [email protected]

What does this home offer?

Accepts Medicaid icon

Accept Medicaid: Yes, Accept

Total residents icon

Total Residents: 120 Residents

Housing options icon

Housing Options: Private / Semi-Private Rooms

Building type icon
Building type icon

Building Type: Single-story

Fitness and recreation icon

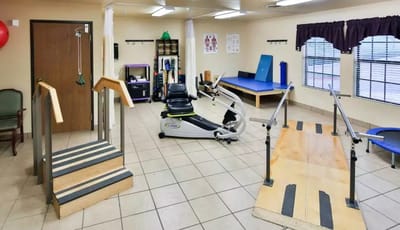
Fitness and Recreation

Types of Care at Pflugerville Nursing and Rehabilitation Center

Nursing Home
Contact Pflugerville Nursing and Rehabilitation Center

Inspection History

In Texas, the Health and Human Services Commission (HHSC) is the primary regulatory body that conducts unannounced inspections and publishes quality reports for all long-term care homes.

7 visits/inspections

4 visits/inspections triggered by complaints

4 routine inspections

Results

7 with issues

0 without issues

Latest inspection

Date June 25, 2025
Complaint Investigation

35 deficiencies

Deficiencies indicate regulatory issues. A higher number implies the facility had several areas requiring improvement.

Texas average: 32 deficiencies

Health Inspection History

Inspections
Total health inspections 7

Texas average 7.4


Last Health inspection on Jun 2025

Total health citations 30

Texas average 25.9

Citations per inspection
4.29

Texas average 3.67


Health citations are formal notices following inspections when they fail to comply with safety and care standards.

18 of 30 citations resulted from standard inspections; 5 of 30 resulted from complaint investigations; and 7 of 30 came from combined inspections (standard and complaint).

Breakdown of citation severity (last 3 years)
Critical Health citations More info 1
50% better than Texas average

Texas average: 2


Serious Health citations More info 0
100% better than Texas average

Texas average: 0.4

1 critical citation More info Texas average: 2

0 serious citations More info Texas average: 0.4

29 moderate citations More info Texas average: 23

0 minor citations More info Texas average: 0.4
Citations history (last 3 years)
Abuse/Neglect moderate citation Info Issues related to protecting resident's from harm, including abuse, neglect, or mistreatment. Jun 25, 2025
Corrected

Environmental moderate citation Info Issues related to building safety, cleanliness, maintenance, and overall living conditions. Apr 03, 2025
Corrected

Infection Control moderate citation Info Issues related to preventing and controlling infections, including hygiene practices and safety protocols. Apr 03, 2025
Corrected

Nutrition moderate citation Info Issues related to food quality, meal service, and resident's nutritional needs. Apr 03, 2025
Corrected

Compare Nursing Homes around Pflugerville The information below is reported by the Texas Health and Human Services Commission.

1 facility compared · CMS & TX Dept. of Health data · Updated Apr 2026

Filter by care type
Pflugerville Nursing and Rehabilitation Center
AL

Assisted Living A licensed, long-term care setting for seniors or individuals with disabilities who need help with daily activities — like bathing, dressing, and medication management — but not 24-hour skilled nursing. Offers housing, meals, and around-the-clock support while aiming to maximize resident independence.

IL

Independent Living Lifestyle-focused communities for older adults offering dining, activities, and transportation with minimal personal care. Best for active, independent seniors who want community without medical support.

MC

Memory Care Secured, specialized care for people living with Alzheimer's or dementia. Staff trained in cognitive impairment, with higher staff-to-resident ratios and an environment designed to reduce confusion and wandering risk.

NH

Nursing Home Licensed facility providing 24/7 skilled nursing care for residents with complex, ongoing medical needs. Staffed by RNs, LPNs, and CNAs. Inspected and star-rated annually by CMS. Accepts Medicare (short-term rehab) and Medicaid (long-term care).

Pflugerville (Kuempel Tract Phase 1)
120
88.2%
+39%
2.71
-1%
-25%
1
30
4.3
1
114
40
Regency Ihs Of Pflugerville Llc
$8.6M
$4.7M
54.8%
676245
Private / Semi-Private Rooms

Places of interest near Pflugerville Nursing and Rehabilitation Center

Address 1.5 miles from city center

Address 104 Rex Kerwin Ct, Pflugerville, TX 78660

Calculate Travel Distance to Pflugerville Nursing and Rehabilitation Center

Add your location

Address

Staffing Data (Q2 2025)

This data corresponds to Q2 2025 and is based on CMS Payroll-Based Journal.

Total staff 94
Employees 79
Contractors 15
Staff to resident ratio 0.87:1
42% worse than Texas average

Texas average ratio: 1.51:1

Avg staff/day 46
Average shift 7.8 hours
0% compared with Texas average

Texas average: 8.1 hours

Total staff hours (quarter) 32,851
Nursing staff breakdown
Registered Nurse

Manages medical care and health needs.

Total count 7
Average shift length Info Average shift length. Calculated as total hours divided by days worked and average staff per day. 10 hours

No contractors work on this role.

Licensed Practical Nurse

Assists with medical care and medications.

Total count 11
Average shift length Info Average shift length. Calculated as total hours divided by days worked and average staff per day. 8.8 hours

No contractors work on this role.

Certified Nursing Assistant

Helps with daily care and mobility.

Total count 41
Average shift length Info Average shift length. Calculated as total hours divided by days worked and average staff per day. 7.8 hours

No contractors work on this role.

Contractor staffing

Total hours from contractors

10.5%

3,434 contractor hours this quarter

Physical Therapy Aide: 3 Occupational Therapy Aide: 3 Speech Language Pathologist: 3 Qualified Social Worker: 2 Physical Therapy Assistant: 1 Respiratory Therapy Technician: 1 Medical Director: 1 Occupational Therapy Assistant: 1
Staff by category
Certified Nursing Assistant4104114,52291100%7.8
Licensed Practical Nurse110114,36591100%8.8
Registered Nurse7072,7988998%10
Medication Aide/Technician8082,75091100%7.4
RN Director of Nursing4042,0988391%7.8
Other Dietary Services Staff30399591100%7.5
Physical Therapy Aide0339377684%7.3
Speech Language Pathologist0337967886%5.7
Qualified Social Worker0226666673%5.4
Administrator1015536571%8.5
Nurse Practitioner1015466167%9
Dietitian1014996369%7.9
Respiratory Therapy Technician0114546167%7.4
Physical Therapy Assistant0114465965%7.6
Mental Health Service Worker2022933538%8.4
Occupational Therapy Aide0336489%8
Occupational Therapy Assistant0113667%6
Medical Director011331213%2.8
41 Certified Nursing Assistant
% of Days 100%
11 Licensed Practical Nurse
% of Days 100%
7 Registered Nurse
% of Days 98%
8 Medication Aide/Technician
% of Days 100%
4 RN Director of Nursing
% of Days 91%
3 Other Dietary Services Staff
% of Days 100%
3 Physical Therapy Aide
% of Days 84%
3 Speech Language Pathologist
% of Days 86%
2 Qualified Social Worker
% of Days 73%
1 Administrator
% of Days 71%
1 Nurse Practitioner
% of Days 67%
1 Dietitian
% of Days 69%
1 Respiratory Therapy Technician
% of Days 67%
1 Physical Therapy Assistant
% of Days 65%
2 Mental Health Service Worker
% of Days 38%
3 Occupational Therapy Aide
% of Days 9%
1 Occupational Therapy Assistant
% of Days 7%
1 Medical Director
% of Days 13%

Facility Characteristics

Source: CMS Long-Term Care Facility Characteristics (Data as of Jan 2026)

Total census
108 residents
Residents by payment source
Medicare
38 residents (35.2%)
Medicaid
70 residents (64.8%)
Programs & Services
Residents' Group

Residents meet regularly to discuss policies, care quality, and activities

Active Resident Council

Organized group of residents that meets regularly to discuss facility policies, quality of life, and activities.

Quality of care over time

These measures show how residents usually do over time at this home, based on health outcomes and preventive care.

High-risk clinical events score Info A composite score based on pressure ulcers, falls with injury, weight loss, walking ability decline, and activities of daily living decline. 8.0
7% better than Texas average

Texas average: 8.6

Functional decline score Info A composite score based on activities of daily living decline, walking ability decline, and incontinence. 16.3
In line with Texas average

Texas average: 16.0

Long-stay resident measures
Significantly above average Texas avg: 4.2 Info CMS star rating based on long-stay quality measure performance. 5 stars = significantly above average, 1 star = significantly below average.
Need for Help with Daily Activities Increased Info Percent of long-stay residents whose need for help with daily activities has increased 16.1%
In line with Texas average

Texas average: 16.2%

Walking Ability Worsened Info Percent of long-stay residents whose ability to move independently worsened 12.0%
26% better than Texas average

Texas average: 16.2%

Low Risk Residents with Bowel/Bladder Incontinence Info Percent of low risk long-stay residents who lose control of their bowels or bladder 20.7%
32% worse than Texas average

Texas average: 15.7%

Falls with Major Injury Info Percent of long-stay residents experiencing one or more falls with major injury 4.7%
44% worse than Texas average

Texas average: 3.2%

High Risk Residents with Pressure Ulcers Info Percent of long-stay high risk residents with pressure ulcers 3.0%
32% better than Texas average

Texas average: 4.4%

Urinary Tract Infection Info Percent of long-stay residents with a urinary tract infection 0.3%
68% better than Texas average

Texas average: 0.8%

Lost Too Much Weight Info Percent of long-stay residents who lose too much weight 4.2%
20% worse than Texas average

Texas average: 3.5%

Depressive Symptoms Info Percent of long-stay residents who have depressive symptoms 0.6%
80% better than Texas average

Texas average: 2.9%

Antipsychotic Use Info Percent of long-stay residents who received an antipsychotic medication 8.4%
7% worse than Texas average

Texas average: 7.9%

Pneumococcal Vaccine Info Percent of long-stay residents assessed and appropriately given the pneumococcal vaccine 100.0%
In line with Texas average

Texas average: 97.3%

Influenza Vaccine Info Percent of long-stay residents assessed and appropriately given the seasonal influenza vaccine 100.0%
In line with Texas average

Texas average: 97.9%

Short-stay resident measures
Above average Texas avg: 2.9 Info CMS star rating based on short-stay quality measure performance. 5 stars = much above average, 1 star = much below average.
Pneumococcal Vaccine Info Percent of short-stay residents assessed and appropriately given the pneumococcal vaccine 99.8%
10% better than Texas average

Texas average: 90.4%

Antipsychotic medication increase Info Percent of short-stay residents who newly received an antipsychotic medication 0.5%
68% better than Texas average

Texas average: 1.4%

Influenza Vaccine Info Percent of short-stay residents assessed and appropriately given the seasonal influenza vaccine 99.1%
13% better than Texas average

Texas average: 88.0%

Re-hospitalized after SNF stay Info Percentage of short-stay residents who were re-hospitalized after their nursing home admission. 47.3%
83% worse than Texas average

Texas average: 25.9%

Emergency department visits Info Percentage of short-stay residents who had an outpatient emergency department visit. 0.0%
100% better than Texas average

Texas average: 12.0%

Falls with major injury Info Percentage of SNF residents who experience falls with major injury during their stay. 0.0%
100% better than Texas average

Texas average: 0.8%

Ability to care for self at discharge Info Percentage of residents at or above expected ability to care for themselves at discharge. 45.0%
16% worse than Texas average

Texas average: 53.7%

Successful return to home or community Info Rate of successful return to home or community from a skilled nursing facility. 57.4%
14% better than Texas average

Texas average: 50.6%

Guides for Better Senior Living

Care Cost Calculator: See Prices in Your Area

Nursing Home Data Explorer

Don’t Wait Too Long: 7 Red Flag Signs Your Parent Needs Assisted Living Now

The True Cost of Assisted Living in 2025 – And How Families Are Paying For It

Understanding Senior Living Costs: Pricing Models, Discounts & Financial Assistance

Financial Aid for Texas Seniors

Get financial aid guidance

Community Care for the Aged and Disabled (CCAD)

TX Medicaid CCAD

Age 65+ or disabled, Texas resident, Medicaid-eligible, care need (not always nursing home level).

~$2,829/month (300% FBR, individual).

$2,000 (individual), $3,000 (couple).

Large state; rural access challenges.

Texas Community Care Services

TX CCS

Age 60+, Texas resident, at risk of decline.

~$2,000/month (individual, varies).

$5,000 (individual).

Limited funding; high demand in urban areas.

Area Agency on Aging (AAA) Services

Texas AAA Services

Age 60+, TX resident; no income/asset limits.

None; donations encouraged.

Not assessed.

28 AAAs; includes Meals on Wheels in some areas.

Medicare Savings Program (MSP)

Texas Medicare Savings Program

Age 65+ or disabled, TX resident, Medicare Part A/B.

~$2,510/month (QMB), ~$3,380/month (SLMB), ~$3,598/month (QI)—individual.

$9,430 (individual), $14,130 (couple).

Includes Extra Help for Part D; no waitlist.

Low-Income Home Energy Assistance Program (LIHEAP)

Texas Comprehensive Energy Assistance Program (CEAP)

Age 60+ prioritized, TX resident, low-income.

~$3,970/month (185% FPL).

Not assessed.

Priority for elderly/disabled; covers gas, electric, propane.

Family Caregiver Support Program (FCSP)

Texas Family Caregiver Support Program

Caregivers of 60+ needing care or 55+ caregivers of others; TX resident; 2+ ADLs.

No strict cap; prioritizes low-income (~$24,980/year).

Not assessed.

High rural demand; includes grandparent caregivers.

Senior Community Service Employment Program (SCSEP)

Texas SCSEP

Age 55+, unemployed, low-income, TX resident.

~$1,983/month (125% FPL).

Not specified.

Priority for veterans, rural residents; AARP partnership.

VA Aid and Attendance (A&A) and Housebound Benefits

Texas VA Aid and Attendance/Housebound

Age 65+ or disabled veteran/spouse, TX resident, wartime service, ADL help (A&A) or homebound.

Net income < ~$1,984/month (veteran with dependent, A&A); pension offsets income.

~$155,356 (net worth).

High veteran population; supports rural/urban needs.

Property Tax Exemption for Seniors

Texas Senior Property Tax Exemption

Age 65+, TX resident, homeowner (homestead).

None; tax-based eligibility.

Not assessed.

$25,000+ exemption; optional freeze in some counties; saves ~$500-$1,000/year.

Senior Farmers’ Market Nutrition Program (SFMNP)

Texas SFMNP

Age 60+, TX resident, low-income.

~$2,322/month (185% FPL).

Not assessed.

Vouchers (~$50/season); serves ~20,000 via 28 AAAs.