


Total health inspections
4
Massachusetts average 4.5
Last Health inspection on Aug 2025

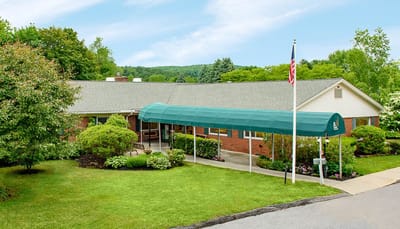
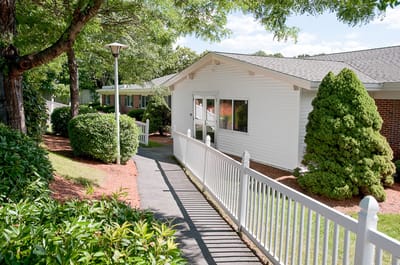
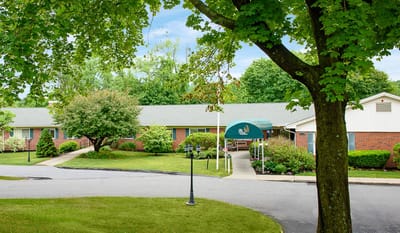
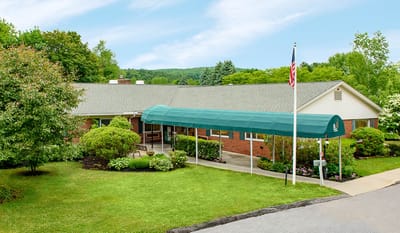
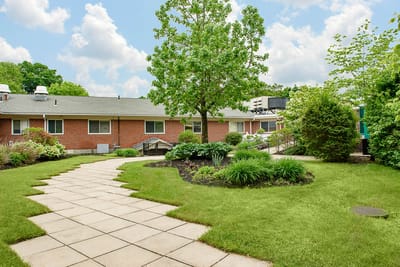
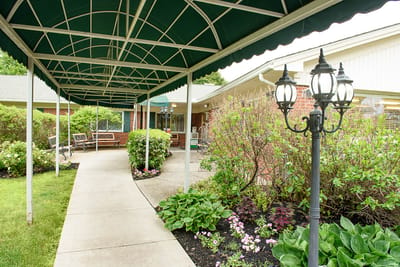

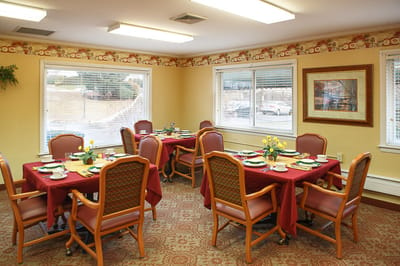

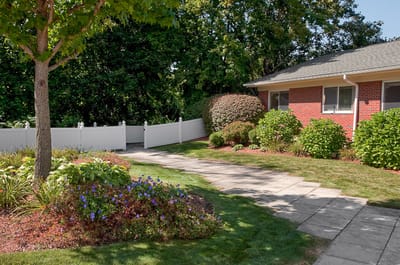


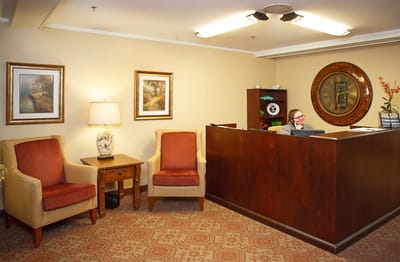
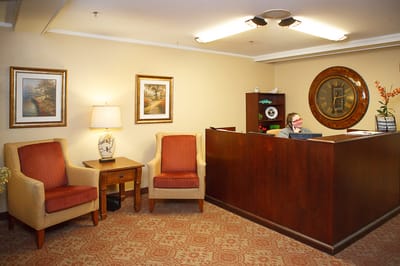
Nestled in the quiet neighborhood of Leominster, MA, Life Care Center of Leominster is a serene senior living community, offering skilled nursing and rehabilitation. A well-experienced team of nurses are available 24/7 to fulfill residents’ individual needs and help them recover successfully. With safe accommodations and individualized care plans, residents are sure to regain their abilities in a supportive environment.
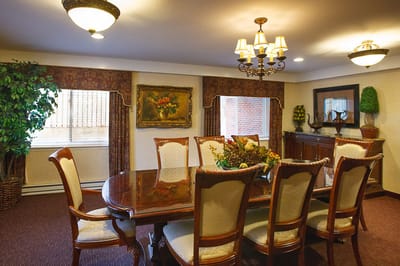
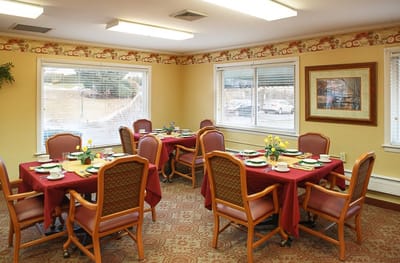
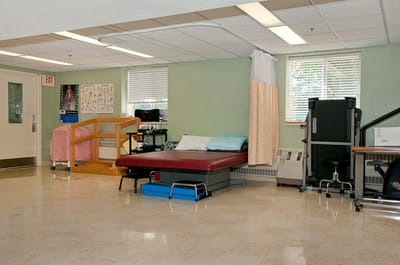
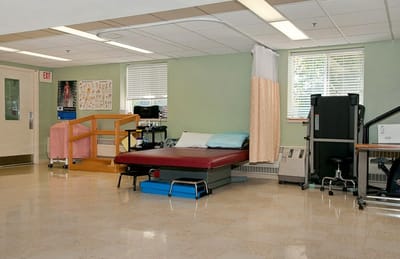
Physical, occupational, and speech therapies are also offered to give residents the services they need to recover successfully. Most of residents’ chores are handled to let them enjoy the community’s activities and amenities. Residents here also enjoy the community’s fine dining program with healthy and tasty meals tailored to their nutritional needs.
| Staff type | Hours / Day / Resident | vs state avg |
|---|---|---|
|
Registered Nurse (RN)
|
18m per day | ▼ 54% State avg: 39m per day · National avg: 41m per day |
|
LPN / LVN
|
1h 28m per day | ▲ 51% State avg: 58m per day · National avg: 52m per day |
|
Nurse Aide
|
2h 18m per day | ■ Avg State avg: 2h 16m per day · National avg: 2h 21m per day |
|
Weekend Total Nursing
|
3h 35m per day | ▲ 4% State avg: 3h 27m per day · National avg: 3h 26m per day |
|
Physical Therapist
|
5m per day | ▲ 25% State avg: 4m per day · National avg: 4m per day |
|
Weekend RN
|
4m per day | ▼ 85% State avg: 28m per day · National avg: 29m per day |
Key information about the people who lead and staff this community.
In Massachusetts, the Executive Office of Elder Affairs (for assisted living facilities) and the Department of Public Health (for nursing homes) are the agencies authorized to inspect and report on facility safety.
Citations
|
This Facility | MA Average | vs. MA Avg |
|---|---|---|---|
|
Total citations
|
21 | 14 | This facility has 50% more total citations than a typical Massachusetts nursing home (21 vs. MA avg 14).↑ 50% worse |
|
Citations per year
|
7 | 4.7 | This facility has 49% more citations per year than a typical Massachusetts nursing home (7 vs. MA avg 4.7).↑ 49% worse |
Massachusetts average 4.5
Last Health inspection on Aug 2025
Massachusetts average 32.7
Massachusetts average 7.24
Health citations are formal notices following inspections when they fail to comply with safety and care standards.
19 of 21 citations resulted from standard inspections; and 2 of 21 resulted from complaint investigations.
Massachusetts average: 0.3
Massachusetts average: 1.5
Reporting period: October 1 – December 31, 2025 (Q4 2025). Source: CMS Payroll-Based Journal report.
Manages medical care and health needs.
Assists with medical care and medications.
Helps with daily care and mobility.
Total hours from contractors
112 contractor hours this quarter
| Certified Nursing Assistant | 78 | 0 | 78 | 23,069 | 92 | 100% | 7.9 |
| Licensed Practical Nurse | 39 | 0 | 39 | 13,565 | 92 | 100% | 8.3 |
| Other Dietary Services Staff | 8 | 0 | 8 | 2,497 | 92 | 100% | 6.7 |
| Physical Therapy Assistant | 8 | 0 | 8 | 2,079 | 89 | 97% | 7.3 |
| Clinical Nurse Specialist | 8 | 0 | 8 | 1,679 | 72 | 78% | 7.4 |
| RN Director of Nursing | 5 | 0 | 5 | 1,141 | 66 | 72% | 7.4 |
| Speech Language Pathologist | 5 | 0 | 5 | 1,106 | 78 | 85% | 6.5 |
| Mental Health Service Worker | 2 | 0 | 2 | 918 | 68 | 74% | 7.9 |
| Registered Nurse | 11 | 1 | 12 | 872 | 79 | 86% | 6 |
| Respiratory Therapy Technician | 5 | 0 | 5 | 842 | 84 | 91% | 7.1 |
| Administrator | 1 | 0 | 1 | 528 | 66 | 72% | 8 |
| Nurse Practitioner | 1 | 0 | 1 | 480 | 60 | 65% | 8 |
| Dietitian | 1 | 0 | 1 | 469 | 59 | 64% | 7.9 |
| Qualified Social Worker | 5 | 0 | 5 | 379 | 56 | 61% | 5.9 |
| Physical Therapy Aide | 2 | 0 | 2 | 373 | 66 | 72% | 5.7 |
| Occupational Therapy Aide | 1 | 0 | 1 | 355 | 47 | 51% | 7.6 |
| Qualified Activities Professional | 1 | 0 | 1 | 209 | 51 | 55% | 4.1 |
| Therapeutic Recreation Specialist | 1 | 0 | 1 | 176 | 57 | 62% | 3.1 |
| Occupational Therapy Assistant | 0 | 4 | 4 | 61 | 8 | 9% | 6.1 |
| Medical Director | 0 | 1 | 1 | 44 | 3 | 3% | 14.5 |
| Nurse Aide in Training | 1 | 0 | 1 | 14 | 2 | 2% | 7.1 |
Federal penalties imposed by CMS for regulatory violations, including civil money penalties (fines) and denials of payment for new Medicare/Medicaid admissions.
Source: CMS Penalties Database (Data as of Jan 2026)
Massachusetts average: $72K
Massachusetts average: 1.7
Massachusetts average: 0.1
No penalties in the past 3 years
No civil money penalties or payment denials were reported in the last 3 years.
These measures show how residents usually do over time at this home, based on health outcomes and preventive care.
Massachusetts average: 10.2
Massachusetts average: 20.0
Massachusetts average: 18.7%
Massachusetts average: 19.3%
Massachusetts average: 22.1%
Massachusetts average: 3.6%
Massachusetts average: 4.7%
Massachusetts average: 2.1%
Massachusetts average: 5.2%
Massachusetts average: 10.7%
Massachusetts average: 20.3%
Massachusetts average: 91.9%
Massachusetts average: 94.8%
Massachusetts average: 1.86
Massachusetts average: 1.54
Massachusetts average: 76.7%
Massachusetts average: 1.3%
Massachusetts average: 77.7%
Massachusetts average: 25.8%
Massachusetts average: 11.8%
Massachusetts average: 0.8%
Massachusetts average: 53.7%
Massachusetts average: 50.6%
Quality measures are calculated from Minimum Data Set (MDS) assessments. For most measures, lower percentages indicate better care quality.
39% of new residents, usually for short-term rehab.
45% of new residents, often for short stays.
16% of new residents, often for long-term daily care.
Source: CMS Long-Term Care Facility Characteristics (Data as of Jan 2026)
Residents meet regularly to discuss policies, care quality, and activities
Organized group of residents that meets regularly to discuss facility policies, quality of life, and activities.
Data sourced from CMS Long-Term Care Facility Characteristics quarterly report. Payer mix reflects the current resident census by primary payment source.
Historical financial and operational data for Life Care Center of Leominster from 2011–2023, based on CMS SNF Cost Reports.
Based on CMS SNF Cost Report for fiscal year ending in 12/2023.
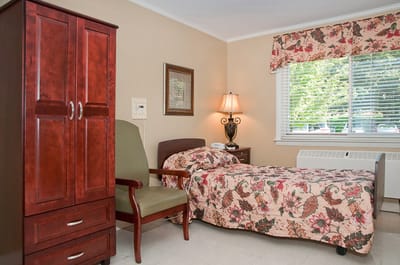
Housing Options: Private / Semi-Private Rooms
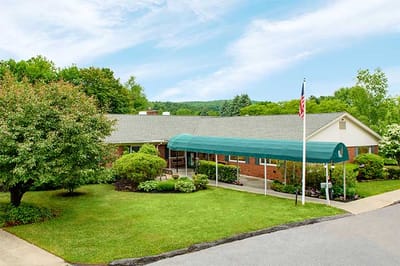
Building Type: Single-story
Three Meals Per Day
Fitness and Recreation
Transportation Services
This home supports both short-term rehab and long-term care, with residents staying for a wide range of durations.
New residents most often arrive under private pay (45% of admissions), and a typical private pay stay runs around 1 - 2 months.
Coverage residents most often arrive under.
Coverage residents most often leave under.
![]() 1.2 miles from city center
1.2 miles from city center
![]() Estimated distance in miles from Leominster's city center to Life Care Center of Leominster's address, calculated via Google Maps.
Estimated distance in miles from Leominster's city center to Life Care Center of Leominster's address, calculated via Google Maps.
Add your location
The information below is reported by the Massachusetts Executive Office of Elder Affairs and Department of Public Health.
|
|
|
|
|
|
|
|
|
|
|
|
|
|
|
|
|
|
|
|
|
|
|
|
|
|
|---|---|---|---|---|---|---|---|---|---|---|---|---|---|---|---|---|---|---|---|---|---|---|---|---|
| Life Care Center of Leominster |
NH
NC
|
Leominster |
133
Facility
133
MA AVG
94
Rank
#45 / 280
|
86.8%
Facility
86.8%
MA AVG
82%
Rank
#45 / 96
| +6% |
3.82
Facility
3.82
MA AVG
3.93
Rank
#50 / 93
| -51% | -3% |
$0
Facility
$0
MA AVG
$76.6k
Rank
#1 / 94
|
21
Facility
21
MA AVG
32.7
Rank
#32 / 93
|
5.3
Facility
5.3
MA AVG
7.2
Rank
#34 / 93
| 2 | 110 | - |
31
Facility
31
MA AVG
53
Rank
#356 / 499
| William Reidt |
$14.5M
Facility
$14.5M
MA AVG
$17.4M
Rank
#37 / 96
|
$10.5M
Facility
$10.5M
MA AVG
$6.5M
Rank
#30 / 96
|
72.7%
Facility
72.7%
MA AVG
43.6%
Rank
#40 / 96
| 225038 | ||||
| The Highlands |
NH
|
Fitchburg |
168
Facility
168
MA AVG
94
Rank
#17 / 280
|
87.9%
Facility
87.9%
MA AVG
82%
Rank
#39 / 96
| +7% |
3.62
Facility
3.62
MA AVG
3.93
Rank
#68 / 93
| -42% | -8% |
$0
Facility
$0
MA AVG
$76.6k
Rank
#1 / 94
|
12
Facility
12
MA AVG
32.7
Rank
#13 / 93
|
3.0
Facility
3.0
MA AVG
7.2
Rank
#7 / 93
| - | 156 | - |
27
Facility
27
MA AVG
53
Rank
#369 / 499
| Carlos Bonilla |
$20.2M
Facility
$20.2M
MA AVG
$17.4M
Rank
#16 / 96
|
$12.8M
Facility
$12.8M
MA AVG
$6.5M
Rank
#20 / 96
|
63.5%
Facility
63.5%
MA AVG
43.6%
Rank
#62 / 96
| 225315 | ||||
| Leominster Rehabilitation and Nursing Center |
NH
HC
PC
RC
|
Leominster |
124
Facility
124
MA AVG
94
Rank
#50 / 280
|
84.2%
Facility
84.2%
MA AVG
82%
Rank
#53 / 96
| +3% |
3.36
Facility
3.36
MA AVG
3.93
Rank
#80 / 93
| -33% | -14% |
$0
Facility
$0
MA AVG
$76.6k
Rank
#1 / 94
|
35
Facility
35
MA AVG
32.7
Rank
#64 / 93
|
8.8
Facility
8.8
MA AVG
7.2
Rank
#71 / 93
| - | 105 | - |
35
Facility
35
MA AVG
53
Rank
#335 / 499
| Gardner Nursing Home Holding Company LLC |
$13.9M
Facility
$13.9M
MA AVG
$17.4M
Rank
#64 / 96
|
$8.2M
Facility
$8.2M
MA AVG
$6.5M
Rank
#58 / 96
|
58.9%
Facility
58.9%
MA AVG
43.6%
Rank
#23 / 96
| 225196 |
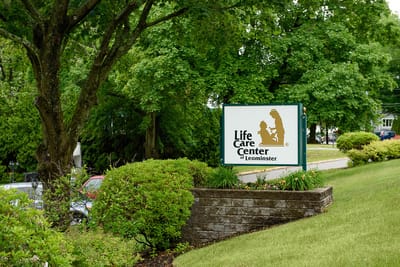
Life Care Center of Leominster is located in Leominster, Massachusetts.
Here are the financial assistance programs available to residents in Massachusetts.
Life Care Center of Leominster has a walk score of 31. Somewhat walkable. A few nearby services may be reachable on foot, but most trips require transportation.
Life Care Center of Leominster's occupancy is 86.8%.
Life Care Center of Leominster is registered as a for-profit in MA.
Yes — there are 28 photos of Life Care Center of Leominster in the photo gallery on this page.
Life Care Center of Leominster is located at 370 West St, Leominster, MA 01453.
(978) 537-0771 will put you in contact with the team at Life Care Center of Leominster.
Yes — Life Care Center of Leominster is a CMS-certified provider of Medicare and Medicaid.
Care Cost Calculator: See Prices in Your Area
Nursing Home Data Explorer
Don’t Wait Too Long: 7 Red Flag Signs Your Parent Needs Assisted Living Now
The True Cost of Assisted Living in 2025 – And How Families Are Paying For It
Understanding Senior Living Costs: Pricing Models, Discounts & Financial Assistance


