

Total staff
140
Employees
90
Contractors
50

We arrange tours, appointments, and even moving support so you don’t have to
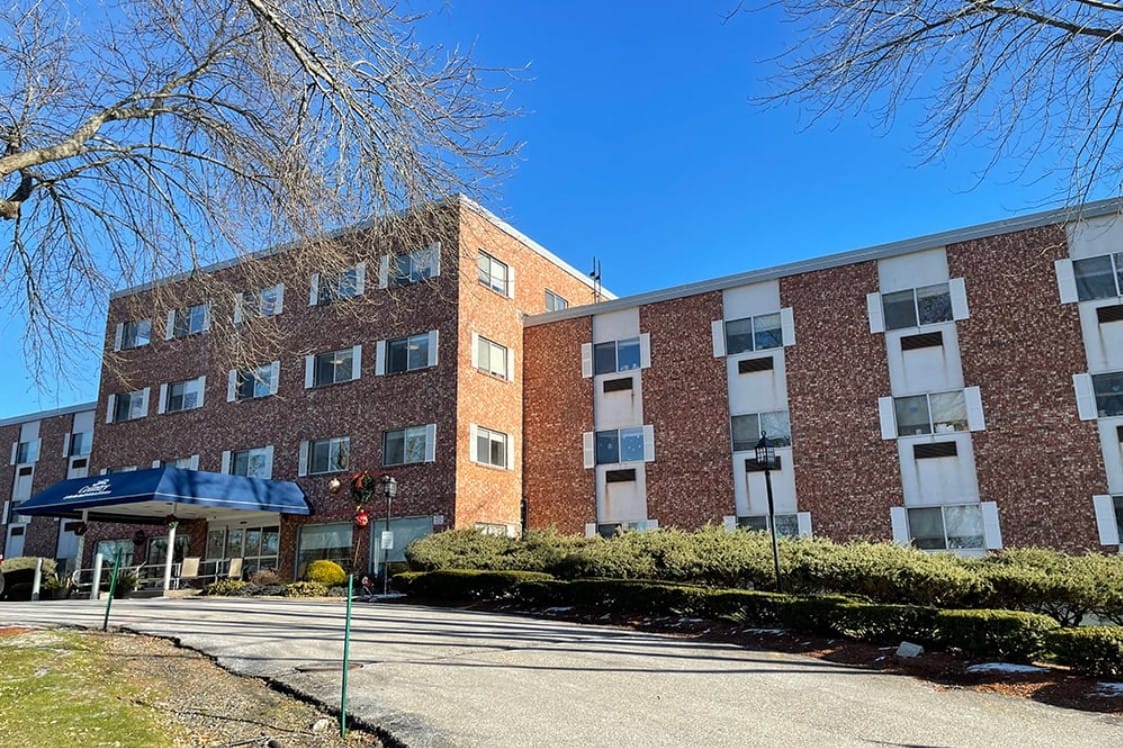
Tucked away within a serene setting in Newburyport, MA, Adviniacare Country Center is a relaxing senior living community that offers short-term rehabilitation, skilled nursing, and long-term care. Residents here enjoy serene and spacious accommodation that allows them to enjoy their rests and personal time in utmost comfort and privacy. An excellent and professional care team is always available to deliver the care services and support residents need whenever they need them.
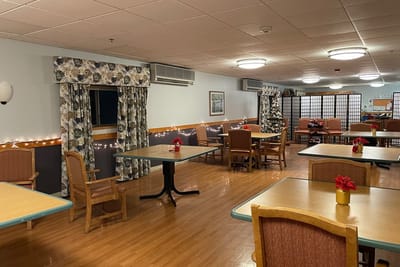
All-day dining options are available to make sure residents’ cravings and nutritional needs are always satisfied. Fun and engaging recreation activities are also offered for a vibrant living experience that allows residents to thrive and maintain their activity. A wide array of amenities, such as a beautiful patio, common areas, and hair salon are offered to further enhance residents’ stay within the community.
| Staff type | Hours / Day / Resident | vs state avg |
|---|---|---|
|
Registered Nurse (RN)
| 40m per day | ■ Avg State avg: 39m per day · National avg: 41m per day |
|
LPN / LVN
| 44m per day | ▼ 24% State avg: 58m per day · National avg: 52m per day |
|
Nurse Aide
| 1h 56m per day | ▼ 15% State avg: 2h 16m per day · National avg: 2h 21m per day |
|
Weekend Total Nursing
| 2h 58m per day | ▼ 14% State avg: 3h 27m per day · National avg: 3h 26m per day |
|
Physical Therapist
| 4m per day | ▼ 10% State avg: 4m per day · National avg: 4m per day |
|
Weekend RN
| 34m per day | ▲ 22% State avg: 28m per day · National avg: 29m per day |
Reporting period: October 1 – December 31, 2025 (Q4 2025). Source: CMS Payroll-Based Journal report.
Manages medical care and health needs.
Assists with medical care and medications.
Helps with daily care and mobility.
Total hours from contractors
3,760 contractor hours this quarter
| Certified Nursing Assistant | 41 | 0 | 41 | 16,471 | 92 | 100% | 8.5 |
| Licensed Practical Nurse | 20 | 10 | 30 | 5,712 | 92 | 100% | 8.2 |
| Registered Nurse | 11 | 15 | 26 | 3,817 | 92 | 100% | 7.6 |
| Dietitian | 6 | 0 | 6 | 1,656 | 92 | 100% | 6.5 |
| Clinical Nurse Specialist | 4 | 0 | 4 | 1,347 | 64 | 70% | 8 |
| Speech Language Pathologist | 0 | 2 | 2 | 767 | 66 | 72% | 7 |
| Physical Therapy Aide | 0 | 4 | 4 | 643 | 68 | 74% | 6.5 |
| RN Director of Nursing | 3 | 0 | 3 | 565 | 72 | 78% | 5.8 |
| Mental Health Service Worker | 1 | 2 | 3 | 552 | 60 | 65% | 7.7 |
| Qualified Social Worker | 0 | 2 | 2 | 538 | 62 | 67% | 6.8 |
| Physical Therapy Assistant | 0 | 6 | 6 | 522 | 74 | 80% | 6.4 |
| Respiratory Therapy Technician | 0 | 5 | 5 | 513 | 63 | 68% | 7 |
| Administrator | 1 | 0 | 1 | 440 | 55 | 60% | 8 |
| Nurse Practitioner | 1 | 0 | 1 | 440 | 55 | 60% | 8 |
| Occupational Therapy Aide | 2 | 2 | 4 | 235 | 49 | 53% | 4.3 |
| Medical Director | 0 | 1 | 1 | 60 | 24 | 26% | 2.5 |
| Occupational Therapy Assistant | 0 | 1 | 1 | 27 | 6 | 7% | 4.5 |
Includes penalties issued in 2023-2024
Federal penalties imposed by CMS for regulatory violations, including civil money penalties (fines) and denials of payment for new Medicare/Medicaid admissions.
Source: CMS Penalties Database (Data as of Jan 2026)
Massachusetts average: $72K
Massachusetts average: 1.7
Massachusetts average: 0.1
Penalties are imposed by CMS for violations of federal nursing home regulations.
5 penalties in the past 3 years
Multiple penalties were reported in the last 3 years.
Last updated: Jan 2026
These measures show how residents usually do over time at this home, based on health outcomes and preventive care.
Massachusetts average: 10.2
Massachusetts average: 20.0
Massachusetts average: 18.7%
Massachusetts average: 19.3%
Massachusetts average: 22.1%
Massachusetts average: 3.6%
Massachusetts average: 4.7%
Massachusetts average: 2.1%
Massachusetts average: 5.2%
Massachusetts average: 10.7%
Massachusetts average: 20.3%
Massachusetts average: 91.9%
Massachusetts average: 94.8%
Massachusetts average: 1.86
Massachusetts average: 1.54
Massachusetts average: 76.7%
Massachusetts average: 1.3%
Massachusetts average: 77.7%
Massachusetts average: 25.8%
Massachusetts average: 11.8%
Massachusetts average: 0.8%
Massachusetts average: 53.7%
Massachusetts average: 50.6%
Quality measures are calculated from Minimum Data Set (MDS) assessments. For most measures, lower percentages indicate better care quality.
77% of new residents, usually for short-term rehab.
21% of new residents, often for short stays.
2% of new residents, often for long-term daily care.
Source: CMS Long-Term Care Facility Characteristics (Data as of Jan 2026)
Residents meet regularly to discuss policies, care quality, and activities
Family members meet regularly to discuss policies, care quality, and activities
Organized group of family members that meets regularly to discuss facility policies, resident care, and activities.
Organized group of residents that meets regularly to discuss facility policies, quality of life, and activities.
Data sourced from CMS Long-Term Care Facility Characteristics quarterly report. Payer mix reflects the current resident census by primary payment source.
Historical financial and operational data for AdviniaCare Country Center from 2012–2023, based on CMS SNF Cost Reports.
Based on the 2023 CMS SNF Cost Report.
Room Sizes: Private / Semi-Private Rooms
Building Type: Mid-rise Building
Most residents typically stay for a few weeks or months before returning home or moving on.
Most new residents arrive under Medicare (77% of admissions), and a typical Medicare stay runs around 24 days.
Coverage residents most often arrive under.
Coverage residents most often leave under.
![]() 1.7 miles from city center
1.7 miles from city center
![]() Estimated distance in miles from Newburyport's city center to AdviniaCare Country Center's address, calculated via Google Maps.
Estimated distance in miles from Newburyport's city center to AdviniaCare Country Center's address, calculated via Google Maps.
Add your location
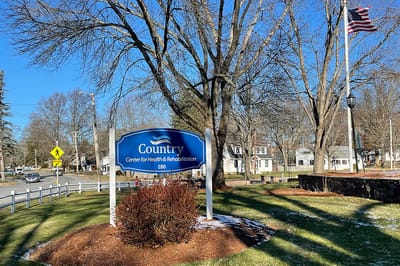
AdviniaCare Country Center is located in Newburyport, Massachusetts.
Here are the financial assistance programs available to residents in Massachusetts.
The information below is reported by the Massachusetts Executive Office of Elder Affairs and Department of Public Health.
| Port Rehabilitation & Healthcare Center |
NH Nursing Home Licensed facility providing 24/7 skilled nursing care for residents with complex, ongoing medical needs. Staffed by RNs, LPNs, and CNAs. Inspected and star-rated annually by CMS. Accepts Medicare (short-term rehab) and Medicaid (long-term care). | Newburyport | 123
Facility
123
MA AVG
94
Rank
#55 / 280 |
93.6%
Facility
93.6%
MA AVG
82%
Rank
#16 / 92 | +14% | 3.72
Facility
3.72
MA AVG
3.93
Rank
#55 / 89 | +35% | -5% | $0
Facility
$0
MA AVG
$76.6k
Rank
#1 / 90 | 22
Facility
22
MA AVG
32.7
Rank
#34 / 89 | 4.4
Facility
4.4
MA AVG
7.2
Rank
#25 / 89 | - | 116 | - |
27
Facility
27
MA AVG
53
Rank
#369 / 499 | Whittier Healthcare Holdings, Inc. | $21.2M
Facility
$21.2M
MA AVG
$17.4M
Rank
#44 / 92 | $11.4M
Facility
$11.4M
MA AVG
$6.5M
Rank
#34 / 92 | 53.5%
Facility
53.5%
MA AVG
43.6%
Rank
#31 / 92 | 225271 | ||||
| AdviniaCare Country Center |
NH Nursing Home Licensed facility providing 24/7 skilled nursing care for residents with complex, ongoing medical needs. Staffed by RNs, LPNs, and CNAs. Inspected and star-rated annually by CMS. Accepts Medicare (short-term rehab) and Medicaid (long-term care).
AL Assisted Living A licensed, long-term care setting for seniors or individuals with disabilities who need help with daily activities — like bathing, dressing, and medication management — but not 24-hour skilled nursing. Offers housing, meals, and around-the-clock support while aiming to maximize resident independence.
IL Independent Living Lifestyle-focused communities for older adults offering dining, activities, and transportation with minimal personal care. Best for active, independent seniors who want community without medical support.
MC Memory Care Secured, specialized care for people living with Alzheimer's or dementia. Staff trained in cognitive impairment, with higher staff-to-resident ratios and an environment designed to reduce confusion and wandering risk. | Newburyport | 111
Facility
111
MA AVG
94
Rank
#79 / 280 |
71.9%
Facility
71.9%
MA AVG
82%
Rank
#68 / 92 | -12% | 3.14
Facility
3.14
MA AVG
3.93
Rank
#85 / 89 | +46% | -20% | $322.1k
Facility
$322.1k
MA AVG
$76.6k
Rank
#90 / 90 | 72
Facility
72
MA AVG
32.7
Rank
#87 / 89 | 14.4
Facility
14.4
MA AVG
7.2
Rank
#86 / 89 | 8 | 93 | - |
51
Facility
51
MA AVG
53
Rank
#254 / 499 | Ma Holdco Op LLC | $11.4M
Facility
$11.4M
MA AVG
$17.4M
Rank
#79 / 92 | $7.2M
Facility
$7.2M
MA AVG
$6.5M
Rank
#71 / 92 | 63.4%
Facility
63.4%
MA AVG
43.6%
Rank
#12 / 92 | 225332 | ||||
| Brigham Health and Rehabilitation Center |
NH Nursing Home Licensed facility providing 24/7 skilled nursing care for residents with complex, ongoing medical needs. Staffed by RNs, LPNs, and CNAs. Inspected and star-rated annually by CMS. Accepts Medicare (short-term rehab) and Medicaid (long-term care). | Newburyport | 63
Facility
63
MA AVG
94
Rank
#204 / 280 |
88.9%
Facility
88.9%
MA AVG
82%
Rank
#34 / 92 | +8% | 3.21
Facility
3.21
MA AVG
3.93
Rank
#82 / 89 | -33% | -18% | $5.5k
Facility
$5.5k
MA AVG
$76.6k
Rank
#41 / 90 | 43
Facility
43
MA AVG
32.7
Rank
#71 / 89 | 8.6
Facility
8.6
MA AVG
7.2
Rank
#67 / 89 | 3 | 59 | - |
88
Facility
88
MA AVG
53
Rank
#63 / 499 | Marta Subira | $9.2M
Facility
$9.2M
MA AVG
$17.4M
Rank
#87 / 92 | $4.4M
Facility
$4.4M
MA AVG
$6.5M
Rank
#90 / 92 | 48.3%
Facility
48.3%
MA AVG
43.6%
Rank
#53 / 92 | 225360 |
AdviniaCare Country Center has a walk score of 51. Moderately walkable. Some errands can be accomplished on foot, with a mix of nearby amenities.
AdviniaCare Country Center's occupancy is 71.9%.
Yes — there are 3 photos of AdviniaCare Country Center in the photo gallery on this page.
AdviniaCare Country Center is located at 180 Low St, Newburyport, MA 01950, United States.
(978) 465-5361 will put you in contact with the team at AdviniaCare Country Center.
Yes — AdviniaCare Country Center is a CMS-certified provider of Medicare and Medicaid.
Care Cost Calculator: See Prices in Your Area
Nursing Home Data Explorer
Don’t Wait Too Long: 7 Red Flag Signs Your Parent Needs Assisted Living Now
The True Cost of Assisted Living in 2025 – And How Families Are Paying For It
Understanding Senior Living Costs: Pricing Models, Discounts & Financial Assistance


Thank you for your interest!
Our team will be in touch shortly to help with next steps.
