Hale Makua Health Services

Nursing Home in Kahului

Hale Makua Health Services

Nursing Home in Kahului

Overview of Hale Makua Health Services

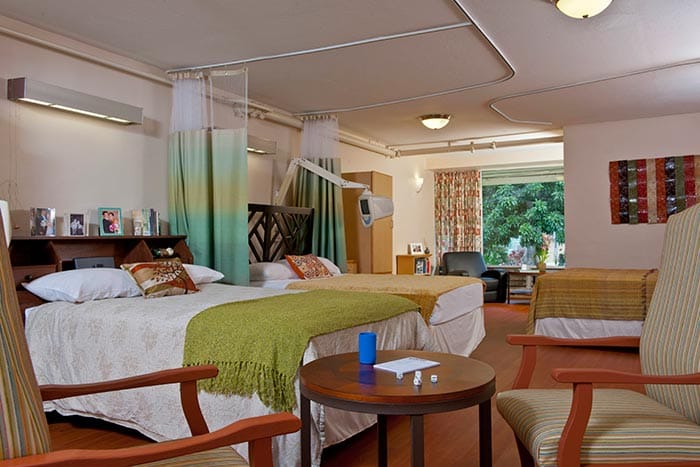
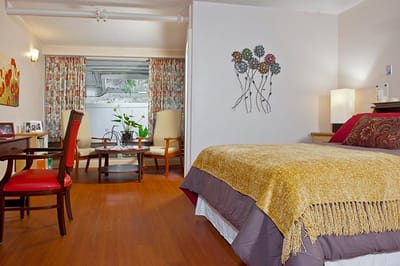
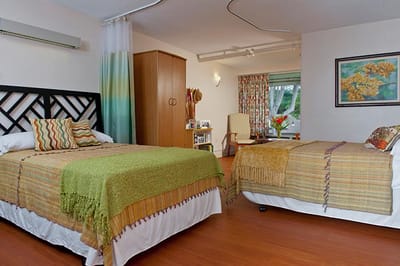
Wonderfully nestled between Kahului Park and Kahului Disc Golf Course in Kahului, HI, Hale Makua Health Services is an outstanding community offering a wide range of care, including adult day health, residential care, home health, long-term care, and rehabilitation. The community strives to meet residents’ needs with a compassionate and well-trained team attending to their needs around the clock. Whether at home or in our stress-free setting, residents can keep their peace of mind and receive exceptional care.

Aside from their healthcare needs, residents’ leisure and wellness are also taken into consideration, so fun recreational activities and enriching programs are also conducted. The community also provides physical, occupational, and speech therapy to enhance residents’ living experiences. With continuum of care services, residents age with dignity wherever they prefer.

(808) 877-2761

Staffing hours breakdown

Info Daily nursing hours per resident by staff type, reported to CMS. Higher is generally better — compare this facility to state and national averages to see where staffing stands.

Hours per resident per day — compared to Hawaii state averages

Total nursing care / resident Info This home is ranked 7th out of 26 homes in Hawaii.

Total adjusted nursing hours per resident per day, combining RN, LPN, and aide time. CMS adjusts this for case-mix so facilities can be fairly compared.
4h 47m per day
vs Hawaii avg

3 of 5 metrics below state avg

Standout metric Total Nursing (Weekend) is +5% above state avg
Staff typeHours / dayvs state avg
Registered Nurse (RN) Info RNs hold the highest nursing license and can assess residents, interpret test results, and direct care plans. More RN hours per day often signals stronger clinical oversight and faster response to health changes. 1h 18m per day ▼ 20% State avg: 1h 38m per day · National avg: 41m per day
Nurse Aide Info Certified Nurse Aides (CNAs) provide the most direct day-to-day assistance: bathing, dressing, feeding, and mobility. Nurse aide hours are typically the largest staffing category and directly affect residents' quality of life. 2h 50m per day ▲ 4% State avg: 2h 44m per day · National avg: 2h 21m per day
Total Nursing (Weekend) Info Combined nursing hours (RN + LPN + Nurse Aide) per resident per day on weekends. Staffing often drops on weekends — this figure reveals whether the facility maintains adequate coverage outside of weekday hours. 4h 23m per day ▲ 5% State avg: 4h 11m per day · National avg: 3h 26m per day
Physical Therapist Info Hours per resident per day provided by licensed Physical Therapists (PTs) or PT Assistants. PT services help residents recover mobility after injury or illness and are especially important for post-acute (short-stay) rehabilitation. 4m per day ▼ 20% State avg: 5m per day · National avg: 4m per day
RN (Weekend) Info Registered nurse hours specifically on weekends. Facilities sometimes reduce RN presence on Saturdays and Sundays — a low weekend RN figure compared to weekday hours can indicate reduced clinical oversight when most administrative staff are absent. 54m per day ▼ 27% State avg: 1h 14m per day · National avg: 29m per day

Capacity and availability

High-capacity home

May provide extensive amenities, services and programs.

Total beds 254

This home usually has limited availability

Occupancy is moderate, suggesting balanced demand.

Similar demand to the Hawaii average: 74.2%
Occupancy rate 91.7%
Avg. Length of Stay 142 days
Occupancy rate
91.7%
Avg. Length of Stay
142 days

Who this home usually serves

TYPE OF STAY

Primarily short stays

Residents typically stay for brief periods, with frequent admissions and discharges throughout the year.

Might be optimal for
Post-acute recovery Temporary care Transitional stays

Breakdown by payment type

Medicare

22% of new residents, usually for short-term rehab.

Typical stay 1 - 2 months

Private pay

68% of new residents, often for short stays.

Typical stay 2 - 3 months

Medicaid

10% of new residents, often for long-term daily care.

Typical stay 2 - 3 years

Finances and operations

Voluntary non-profit community
Home revenue
$62.4M
Operating deficit
-$1.9M
Voluntary non-profit community
Home revenue
$62.4M
Operating deficit
-$1.9M
Payroll costs Info The portion of the home's budget spent on staff, including nurses, caregivers, and other employees who support care and operations.
$16.7M
26.7% of revenue
Other operating costs Info All remaining costs needed to run the home, such as food, utilities, building maintenance, supplies and administrative expenses.
$47.6M
Total costs $64.3M
Walk Score
Walk Score: 27 / 100
Somewhat walkable. A few nearby services may be reachable on foot, but most trips require transportation.

About this community

Therapy & Rehabilitation

2 services
Rehabilitation Services
Respite Care

Staffing & Medical

1 service
Skilled Nursing

Amenities & Lifestyle

0 amenities
Specific ProgramsAdult Day Health, Care Homes, Home Health, Rehab

What does this home offer?

Housing options icon

Housing Options: Private / Semi-Private

Building type icon
Building type icon

Building Type: Single-story

Dining services icon

Dining Services

Housekeeping icon
Housekeeping icon

Housekeeping Services

Social and recreational activities icon

Social and Recreational Activities

On-site medical care and health services icon

On-site Medical Care and Health Services

Types of Care at Hale Makua Health Services

Nursing Home Memory Care

Contact Hale Makua Health Services

Health Inspection History

Inspections
Total health inspections 9

Hawaii average 4.4


Last Health inspection on Apr 2025

Total health citations 63

Hawaii average 35.5

Citations per inspection
7

Hawaii average 8.23


Health citations are formal notices following inspections when they fail to comply with safety and care standards.

34 of 63 citations resulted from standard inspections; 19 of 63 resulted from complaint investigations; and 10 of 63 came from combined inspections (standard and complaint).

Breakdown of citation severity (last 3 years)
Critical Health citations More info 1
900% worse than Hawaii average

Hawaii average: 0.1


Serious Health citations More info 6
500% worse than Hawaii average

Hawaii average: 1

1 critical citation More info Hawaii average: 0.1

6 serious citations More info Hawaii average: 1

56 moderate citations More info Hawaii average: 34.2

0 minor citations More info Hawaii average: 0.1
Citations history (last 3 years)
Resident Rights moderate citation Info Issues related to resident's rights, including dignity, privacy, and the ability to make decisions about their care. Apr 11, 2025
Corrected

Quality of Care moderate citation Info Issues related to how well residents receive appropriate treatment and support for their medical and daily care needs. Jan 14, 2025
Corrected

Care Planning moderate citation Info Issues related to creating and updating personalized care plans for residents based on their needs and conditions. Jan 14, 2025
Corrected

Care Planning moderate citation Info Issues related to creating and updating personalized care plans for residents based on their needs and conditions. Jan 14, 2025
Corrected

Compare Nursing Homes around Kahului The information below is reported by the Hawaii Department of Health, Office of Health Care Assurance.

3 facilities compared · CMS & HI Dept. of Health data · Updated Apr 2026

Filter by care type
Lanai Community Hospital
NH

Nursing Home Licensed facility providing 24/7 skilled nursing care for residents with complex, ongoing medical needs. Staffed by RNs, LPNs, and CNAs. Inspected and star-rated annually by CMS. Accepts Medicare (short-term rehab) and Medicaid (long-term care).

Lanai City (7Th Street)10--- - --000.0010- 58 ----125023
Kula Hospital
NH

Nursing Home Licensed facility providing 24/7 skilled nursing care for residents with complex, ongoing medical needs. Staffed by RNs, LPNs, and CNAs. Inspected and star-rated annually by CMS. Accepts Medicare (short-term rehab) and Medicaid (long-term care).

Kula (Keokea Place)105--5.73 -+36%000.0092- 25 ----125003
Hale Makua Health Services -
MC

Memory Care Secured, specialized care for people living with Alzheimer's or dementia. Staff trained in cognitive impairment, with higher staff-to-resident ratios and an environment designed to reduce confusion and wandering risk.

NH

Nursing Home Licensed facility providing 24/7 skilled nursing care for residents with complex, ongoing medical needs. Staffed by RNs, LPNs, and CNAs. Inspected and star-rated annually by CMS. Accepts Medicare (short-term rehab) and Medicaid (long-term care).

Kahului (Kaulana Street)254 91.7% +24%4.78----29%+14%4637.07201- 27 Chun, Grant$59.0M$16.7M28.3%125007

Financial Assistance for
Nursing Home in Hawaii

Get Financial aid guidance

QUEST Integration

Hawaii Medicaid QUEST Integration

Age 65+ or disabled
General Hawaii resident, Medicaid-eligible, long-term care need.
Income Limits (2025) ~$2,829/month 300% FBR, individual
Asset Limits $2,000 (individual), $3,000 (couple).
HI

High cost of living adjustments.

Benefits
In-home care (6-8 hours/day) Nursing home Respite (240 hours/year) Medical services

Kupuna Care

Hawaii Kupuna Care

Age 60+
General Hawaii resident, unable to perform 2+ ADLs.
Income Limits No strict limit; prioritizes low-income.
Asset Limits Not applicable.
HI

Limited funding; island-specific delivery.

Benefits
In-home care (3-5 hours/week) Adult day care (~$70/day) Transportation (~5 trips/month)

Program of All-Inclusive Care for the Elderly (PACE)

Hawaii Medicaid PACE

Age 55+
General Hawaii resident, nursing home-level care need, safe with PACE support.
Income Limits (2025) ~$2,829/month 300% FBR
Asset Limits $2,000 (individual), $3,000 (couple).
HI

Limited to Oahu (e.g., Maluhia in Honolulu); few providers.

Benefits
Personal care (5-7 hours/day) Medical care Meals Transportation Therapy Respite

Medicare Savings Program (MSP)

Hawaii Medicare Savings Program

Age 65+ or disabled
General Hawaii resident, Medicare Part A/B.
Income Limits (2025) ~$2,510/month (QMB), ~$3,380/month (SLMB), ~$3,598/month (QI)—individual, adjusted annually.
Asset Limits $9,430 (individual), $14,130 (couple).
HI

Three tiers; no waitlist.

Benefits
Covers Part B premiums ($174.70/month) Deductibles ($240/year) Copays (~20%)

Senior Community Service Employment Program (SCSEP)

Hawaii SCSEP (Federally Funded, State-Administered)

Age 55+
General unemployed, low-income, Hawaii resident.
Income Limits (2025) ~$1,983/month 125% FPL
Asset Limits Not specified; income-focused.
HI

~800 slots; prioritizes veterans, rural residents.

Benefits
Paid training (~20 hours/week at ~$7.25/hour) Job placement

National Family Caregiver Support Program (NFCSP) Respite

Hawaii NFCSP Respite Care

Age
General Caregivers of 60+ needing care or 55+ caregivers of others; Hawaii resident; functional needs (2+ ADLs).
Income Limits (2025) Prioritizes ~$24,980/year (individual); no strict cap.
Asset Limits Not assessed; need-based.
HI

Four county AAAs; prioritizes low-income.

Benefits
Respite (4-6 hours/week or 5 days/year) Adult day care ($80/day) Counseling

VA Aid and Attendance (A&A) and Housebound Benefits

Hawaii VA Aid and Attendance/Housebound

Age 65+ or disabled veteran/surviving spouse
General Hawaii resident, wartime service, need for aid with ADLs (A&A) or homebound status.
Income Limits (2025) Net income < ~$1,984/month (veteran with dependent, A&A); pension offsets income.
Asset Limits ~$155,356 2025 net worth limit
HI

Applies statewide; high demand due to veteran population.

Benefits
Cash (~$1,433-$2,642/month veteran, ~$951-$1,318 spouse) for care costs (e.g., in-home, assisted living)

Senior Companion Program (SCP)

Hawaii Senior Companion Program

Age
General Volunteers: 55+, low-income, Hawaii resident, able to work 20 hours/week. Recipients: Frail elders needing companionship.
Income Limits (2025) Volunteers: ~$24,980/year (200% FPL); recipients: no limit.
Asset Limits Not specified for volunteers; need-based for recipients.
HI

Statewide; managed by DHS Social Services.

Benefits
Volunteers paid ~$4/hour for companionship (~20 hours/week); recipients get free support (~4-6 hours/week)

Places of interest near Hale Makua Health Services

Address 1.2 miles from city center Info Estimated distance in miles from Kahului's city center to Hale Makua Health Services's address, calculated via Google Maps.

Calculate Travel Distance to Hale Makua Health Services

Add your location

Address

Staffing Data (Q2 2025)

This data corresponds to Q2 2025 and is based on CMS Payroll-Based Journal.

Total staff 288
Employees 208
Contractors 80
Staff to resident ratio 1.41:1
14% worse than Hawaii average

Hawaii average ratio: 1.64:1

Avg staff/day 138
Average shift 8.2 hours
5% better than Hawaii average

Hawaii average: 7.8 hours

Total staff hours (quarter) 103,422
Nursing staff breakdown
Registered Nurse

Manages medical care and health needs.

Total count 42
Average shift length Info Average shift length. Calculated as total hours divided by days worked and average staff per day. 9 hours

This role is partially covered by contractors.

Licensed Practical Nurse

Assists with medical care and medications.

Total count 47
Average shift length Info Average shift length. Calculated as total hours divided by days worked and average staff per day. 8.8 hours

This role is partially covered by contractors.

Certified Nursing Assistant

Helps with daily care and mobility.

Total count 120
Average shift length Info Average shift length. Calculated as total hours divided by days worked and average staff per day. 8.1 hours

This role is partially covered by contractors.

Contractor staffing

Total hours from contractors

20%

20,676 contractor hours this quarter

Certified Nursing Assistant: 25 Licensed Practical Nurse: 22 Respiratory Therapy Technician: 7 Physical Therapy Assistant: 7 Physical Therapy Aide: 4 Registered Nurse: 3 Qualified Social Worker: 3 Speech Language Pathologist: 3 Occupational Therapy Assistant: 3 Administrator: 1 Other Physician: 1 Medical Director: 1
Staff by category
Certified Nursing Assistant952512049,23691100%8.1
Registered Nurse3934215,96191100%9
Licensed Practical Nurse25224714,53991100%8.8
Clinical Nurse Specialist150156,57191100%8.1
Other Dietary Services Staff7072,8049099%8
Dental Services Staff5052,4467886%7.9
RN Director of Nursing8082,4148391%8.5
Dietitian3031,4086976%7.9
Respiratory Therapy Technician0771,2537987%7.2
Nurse Aide in Training6061,2217886%7.9
Speech Language Pathologist0331,0928593%6.9
Occupational Therapy Aide2021,0086470%8
Physical Therapy Aide0447267380%6.3
Physical Therapy Assistant0776328593%5.1
Administrator1125046369%8
Nurse Practitioner1015046369%8
Qualified Social Worker0334826268%7.5
Mental Health Service Worker1014045156%7.9
Occupational Therapy Assistant0331493943%3.3
Medical Director011602325%2.6
Other Physician0111155%2.2
120 Certified Nursing Assistant
% of Days 100%
42 Registered Nurse
% of Days 100%
47 Licensed Practical Nurse
% of Days 100%
15 Clinical Nurse Specialist
% of Days 100%
7 Other Dietary Services Staff
% of Days 99%
5 Dental Services Staff
% of Days 86%
8 RN Director of Nursing
% of Days 91%
3 Dietitian
% of Days 76%
7 Respiratory Therapy Technician
% of Days 87%
6 Nurse Aide in Training
% of Days 86%
3 Speech Language Pathologist
% of Days 93%
2 Occupational Therapy Aide
% of Days 70%
4 Physical Therapy Aide
% of Days 80%
7 Physical Therapy Assistant
% of Days 93%
2 Administrator
% of Days 69%
1 Nurse Practitioner
% of Days 69%
3 Qualified Social Worker
% of Days 68%
1 Mental Health Service Worker
% of Days 56%
3 Occupational Therapy Assistant
% of Days 43%
1 Medical Director
% of Days 25%
1 Other Physician
% of Days 5%

Facility Characteristics

Source: CMS Long-Term Care Facility Characteristics (Data as of Jan 2026)

Total residents 204
Medicare
29
14.2% of residents
Medicaid
136
66.7% of residents
Private pay or other
39
19.1% of residents
Programs & Services
Residents Group

Residents meet regularly to discuss policies, care quality, and activities

Family Member Group

Family members meet regularly to discuss policies, care quality, and activities

Active Family Council

Organized group of family members that meets regularly to discuss facility policies, resident care, and activities.

Active Resident Council

Organized group of residents that meets regularly to discuss facility policies, quality of life, and activities.

Quality of care over time

These measures show how residents usually do over time at this home, based on health outcomes and preventive care.

High-risk clinical events score Info A composite score based on pressure ulcers, falls with injury, weight loss, walking ability decline, and activities of daily living decline. 16.3
60% worse than Hawaii average

Hawaii average: 10.2

Functional decline score Info A composite score based on activities of daily living decline, walking ability decline, and incontinence. 29.2
46% worse than Hawaii average

Hawaii average: 20.0

Long-stay resident measures
Need for Help with Daily Activities Increased Info Percent of long-stay residents whose need for help with daily activities has increased 24.6%
40% worse than Hawaii average

Hawaii average: 17.6%

Walking Ability Worsened Info Percent of long-stay residents whose ability to move independently worsened 43.4%
68% worse than Hawaii average

Hawaii average: 25.8%

Low Risk Residents with Bowel/Bladder Incontinence Info Percent of low risk long-stay residents who lose control of their bowels or bladder 19.5%
7% worse than Hawaii average

Hawaii average: 18.3%

Falls with Major Injury Info Percent of long-stay residents experiencing one or more falls with major injury 2.2%
In line with Hawaii average

Hawaii average: 2.1%

High Risk Residents with Pressure Ulcers Info Percent of long-stay high risk residents with pressure ulcers 3.2%
11% better than Hawaii average

Hawaii average: 3.6%

Urinary Tract Infection Info Percent of long-stay residents with a urinary tract infection 2.4%
In line with Hawaii average

Hawaii average: 2.4%

Lost Too Much Weight Info Percent of long-stay residents who lose too much weight 8.0%
70% worse than Hawaii average

Hawaii average: 4.7%

Depressive Symptoms Info Percent of long-stay residents who have depressive symptoms 0.2%
86% better than Hawaii average

Hawaii average: 1.5%

Antipsychotic Use Info Percent of long-stay residents who received an antipsychotic medication 11.0%
9% worse than Hawaii average

Hawaii average: 10.1%

Pneumococcal Vaccine Info Percent of long-stay residents assessed and appropriately given the pneumococcal vaccine 96.6%
In line with Hawaii average

Hawaii average: 96.3%

Influenza Vaccine Info Percent of long-stay residents assessed and appropriately given the seasonal influenza vaccine 95.7%
In line with Hawaii average

Hawaii average: 95.4%

Hospitalizations per 1,000 days Info Number of hospitalizations per 1,000 long-stay resident days. 1.17
13% better than Hawaii average

Hawaii average: 1.34

ED visits per 1,000 days Info Number of outpatient emergency department visits per 1,000 long-stay resident days. 1.99
124% worse than Hawaii average

Hawaii average: 0.89

Short-stay resident measures
Pneumococcal Vaccine Info Percent of short-stay residents assessed and appropriately given the pneumococcal vaccine 91.9%
10% better than Hawaii average

Hawaii average: 83.4%

Antipsychotic medication increase Info Percent of short-stay residents who newly received an antipsychotic medication 1.1%
9% better than Hawaii average

Hawaii average: 1.2%

Influenza Vaccine Info Percent of short-stay residents assessed and appropriately given the seasonal influenza vaccine 91.5%
8% better than Hawaii average

Hawaii average: 84.7%

Re-hospitalized after SNF stay Info Percentage of short-stay residents who were re-hospitalized after their nursing home admission. 20.0%
In line with Hawaii average

Hawaii average: 19.6%

Emergency department visits Info Percentage of short-stay residents who had an outpatient emergency department visit. 18.6%
71% worse than Hawaii average

Hawaii average: 10.9%

Falls with major injury Info Percentage of SNF residents who experience falls with major injury during their stay. 0.0%
100% better than Hawaii average

Hawaii average: 0.8%

Ability to care for self at discharge Info Percentage of residents at or above expected ability to care for themselves at discharge. 56.0%
In line with Hawaii average

Hawaii average: 53.7%

Successful return to home or community Info Rate of successful return to home or community from a skilled nursing facility. 70.2%
39% better than Hawaii average

Hawaii average: 50.6%

Penalties and fines

Federal penalties imposed by CMS for regulatory violations, including civil money penalties (fines) and denials of payment for new Medicare/Medicaid admissions.

Source: CMS Penalties Database (Data as of Jan 2026)

Total fines amount $170K
351% higher than Hawaii average

Hawaii average: $38K

Number of fines 3
97% more fines than Hawaii average

Hawaii average: 1.5

Payment Denials Info Serious action where Medicare and/or Medicaid temporarily stops payments for new residents until issues are fixed. 0
100% fewer payment denials than Hawaii average

Hawaii average: 0.1

Fines amount comparison
This facility $170K
Hawaii average $38K
Penalty History

Penalties are imposed by CMS for violations of federal nursing home regulations.

Civil Money Penalty Info Fines imposed for noncompliance, which can be assessed per day or per instance of violation. Oct 18, 2024
$71K
Civil Money Penalty Info Fines imposed for noncompliance, which can be assessed per day or per instance of violation. Aug 12, 2024
$56K
Civil Money Penalty Info Fines imposed for noncompliance, which can be assessed per day or per instance of violation. Oct 19, 2023
$44K

Last updated: Jan 2026

Guides for Better Senior Living

Care Cost Calculator: See Prices in Your Area

Nursing Home Data Explorer

Don’t Wait Too Long: 7 Red Flag Signs Your Parent Needs Assisted Living Now

The True Cost of Assisted Living in 2025 – And How Families Are Paying For It

Understanding Senior Living Costs: Pricing Models, Discounts & Financial Assistance

Tour Icon
Planning a tour? Check our touring checklist.
Chat Icon
Thinking of living here? We can help you speak to a current resident
Explore Open Rooms
1 Contact details
2 What type of senior care service are you looking for?
3 What budget do you have in mind for senior care?
4 How soon do you need to find care?
5 Additional details

Thank you for your interest!

Our team will be in touch shortly to help with next steps.