• Home
  • Nursing Home in Florida
Sandhill Cove Retirement Living
Nursing Home, Assisted Living, Independent Living, Memory Care & Respite Care · Palm City, FL
CMS overall rating Info CMS (the Centers for Medicare & Medicaid Services) is the federal agency that rates nursing home quality. Its Overall Rating runs from 1 to 5 stars, combining health inspections, staffing, and quality measures, with inspections weighted most heavily.

Sandhill Cove Retirement Living

Nursing Home, Assisted Living, Independent Living, Memory Care & Respite Care · Palm City, FL
CMS overall rating Info CMS (the Centers for Medicare & Medicaid Services) is the federal agency that rates nursing home quality. Its Overall Rating runs from 1 to 5 stars, combining health inspections, staffing, and quality measures, with inspections weighted most heavily.
Calculator: See prices in your area
Sandhill Cove Retirement Living accepts Medicare, Medicaid, and private pay.

Overview of Sandhill Cove Retirement Living

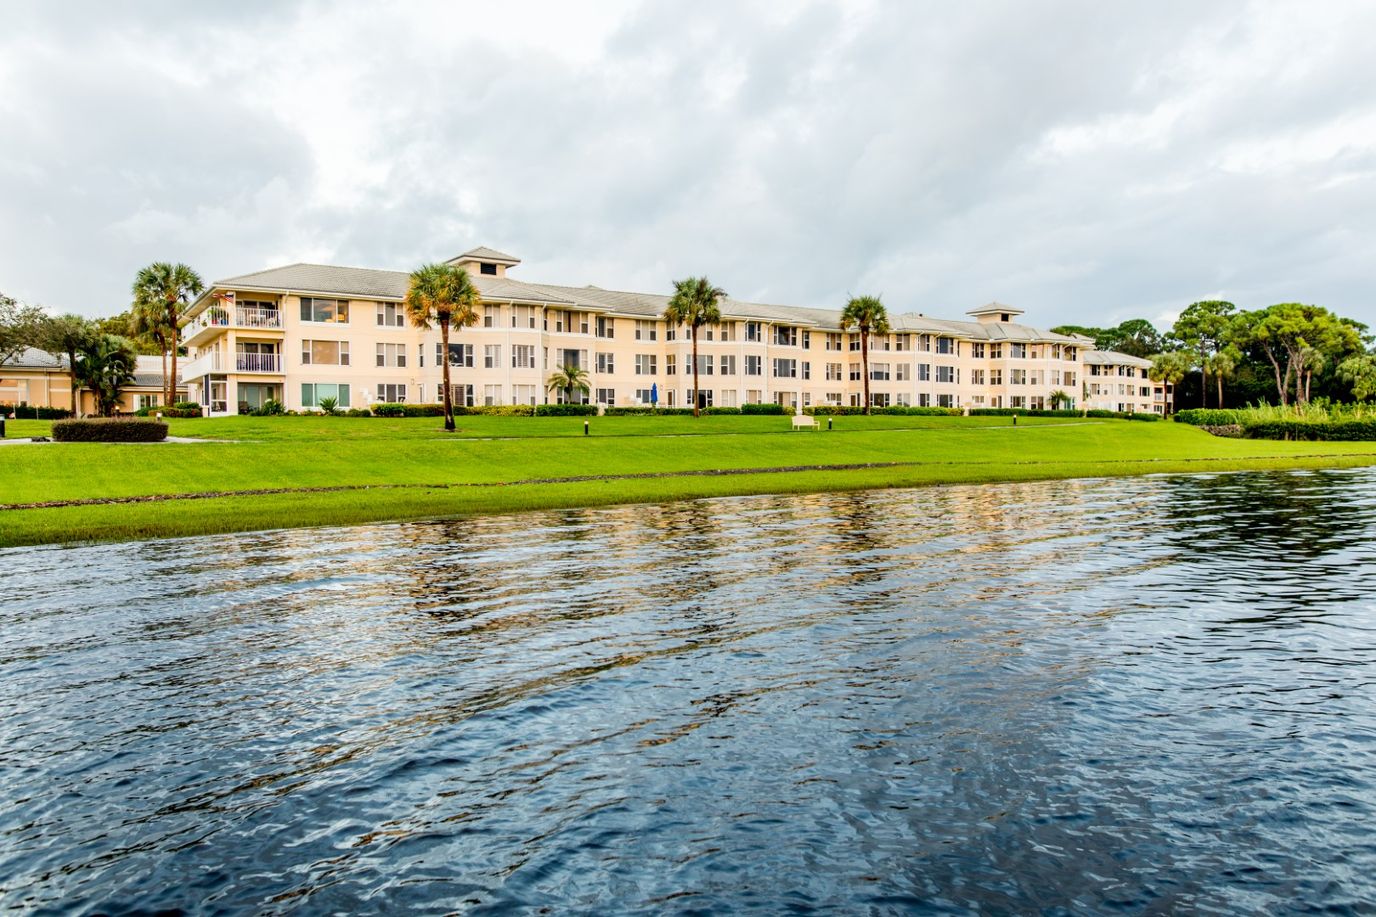
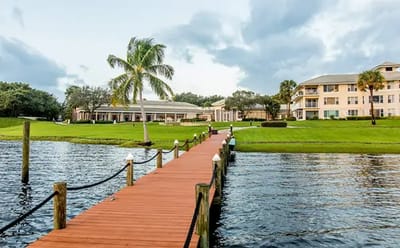
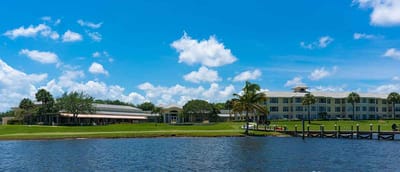
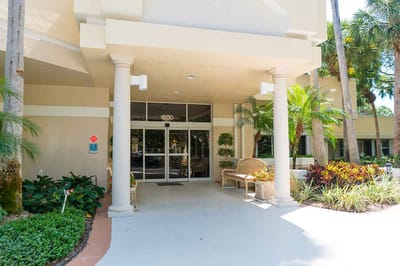
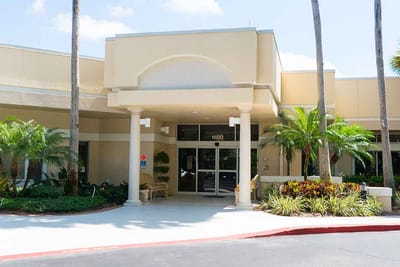
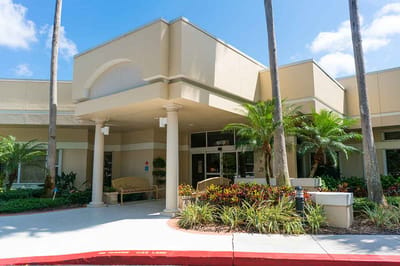
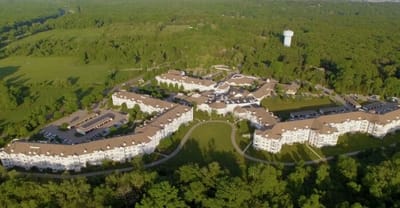
Sandhill Cove Retirement Living, located at 1500 SW Capri Street in Palm City, Martin County, Florida, is a 56-bed skilled nursing facility with independent living options. Privately owned and Medicare/Medicaid certified since 2011, the community operates predominantly as a post-acute rehabilitation center. Most residents arrive under Medicare coverage (72% of admissions) and typically remain 22 days before returning home or transferring.

Nursing personnel provide 5 hours 25 minutes of care per resident daily; 23% above the Florida average and ranked 24th among 252 state nursing homes. Weekend coverage reaches 4 hours 45 minutes per resident, 35% above state norms. The staff-to-resident ratio of 2.93-to-1 outperforms the Florida average by 99%, and the nursing roster includes 11 registered nurses, 12 licensed practical nurses, and 38 certified nursing assistants.

Inspection history spans three surveys since 2022, yielding nine moderate-level citations. The facility ranks 40th in total citations and 53rd in citation rate per inspection among Florida’s 251 nursing homes; an above-average performance.

No critical or serious deficiencies emerged. All citations have been corrected. Zero federal penalties or fines were imposed in the past three years.

CMS overall rating stands 36.6% above the Florida average, with health inspection results 57.7% above state baseline.

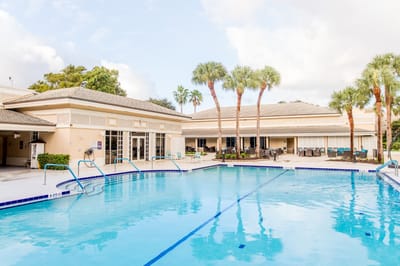
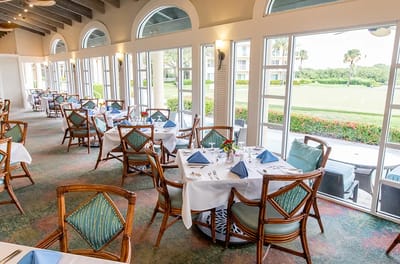
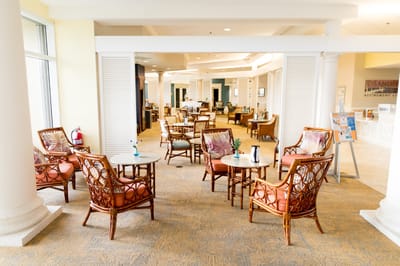
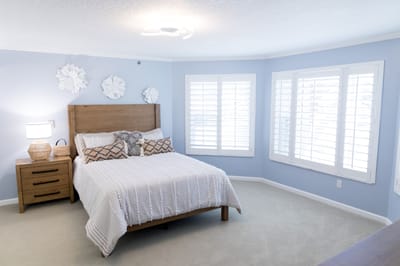
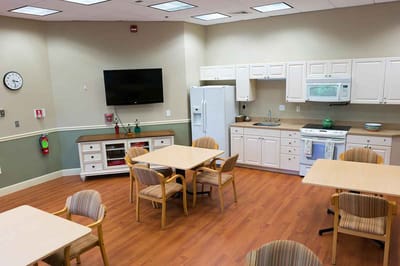
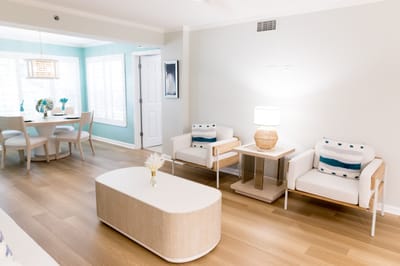
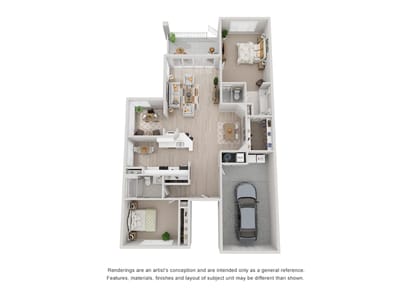
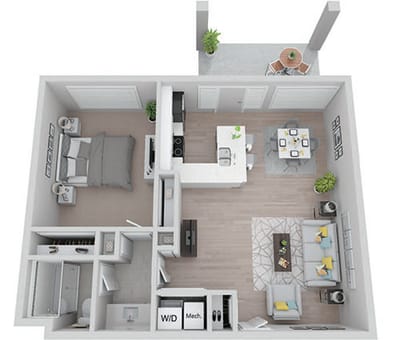
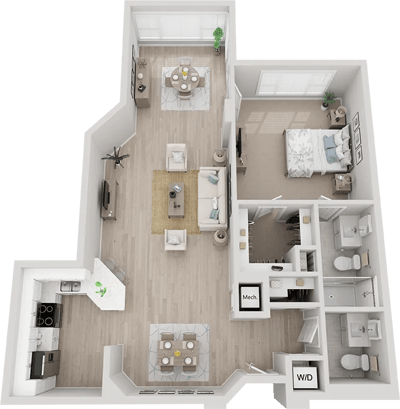
Residents occupy one- and two-bedroom accommodations with utilities included, housekeeping, and linen service. An art studio, outdoor pool, and recreational spaces support activity programming: parties, dinners, lectures, and concerts. Private dining, respite care, and short-term rehabilitation round the service portfolio.

Occupancy runs 86.9%, modestly above the state average of 84.3%.

The financial pressure of a $1.0 million operating loss in 2023 reflects sector-wide margins.

The community suits short-term post-acute patients and Medicare rehabilitation candidates. Long-stay outcomes are less uniform, with strong performance on clinical stability but variation in functional preservation and incontinence management.

Quality ratings

Measured by Centers for Medicare & Medicaid Services (CMS)

Overall rating Info The Overall CMS Rating combines results from health inspections, staffing levels and quality measures. Health inspections carry the most weight. Staffing and quality scores can increase or decrease the final rating based on performance compared to state and national standards.
Health Inspection Info Based on the results of the facility's three most recent standard inspections and any complaint investigations. CMS reviews the number, scope, and severity of deficiencies, with more recent findings weighted more heavily.
Staffing Info Measures average nursing staff hours per resident per day, including Registered Nurses (RNs) and total nursing staff. Ratings are adjusted based on the level of care residents require and are compared to state and national benchmarks.
Quality Measures Info Based on clinical and physical health indicators reported to CMS, such as hospital readmissions, falls, pressure ulcers, and improvements in mobility. These measures reflect how well residents' health needs are being managed.

Staffing hours breakdown

Info Daily nursing hours per resident by staff type, reported to CMS. Higher is generally better — compare this facility to state and national averages to see where staffing stands.

Hours per resident per day — compared to state averages

Total nursing care / resident Info Total adjusted nursing hours per resident per day, combining RN, LPN, and aide time. CMS adjusts this for case-mix so facilities can be fairly compared.
5h 25m per day
Rank #25 / 253Nurse hours — State benchmarkedThis home is ranked 25th out of 253 homes in Florida. Shows adjusted nurse hours per resident per day benchmarked to the Florida average, with a ranking across 253 Florida facilities. More hours mean more direct care. The national average is about 3.5 hrs; below 3.0 is a red flag.Rankings are based only on facilities in Florida that report data for that category. Facilities without available data are excluded from the ranking.Click the rank badge to see the full State ranking.Click here to see the full State ranking.
vs avg
Staff typeHours / Day / Residentvs state avg
Registered Nurse (RN) Info RNs hold the highest nursing license and can assess residents, interpret test results, and direct care plans. More RN hours per day often signals stronger clinical oversight and faster response to health changes. 1h 7m per day
LPN / LVN Info Licensed Practical Nurses (LPNs) or Licensed Vocational Nurses (LVNs) deliver routine hands-on care — medication administration, wound dressing, and monitoring vital signs. They work under RN supervision and make up a large share of daily bedside care. 1h 7m per day
Nurse Aide Info Certified Nurse Aides (CNAs) provide the most direct day-to-day assistance: bathing, dressing, feeding, and mobility. Nurse aide hours are typically the largest staffing category and directly affect residents' quality of life. 3h 3m per day
Weekend Total Nursing Info Combined nursing hours (RN + LPN + Nurse Aide) per resident per day on weekends. Staffing often drops on weekends — this figure reveals whether the facility maintains adequate coverage outside of weekday hours. 4h 51m per day
Physical Therapist Info Hours per resident per day provided by licensed Physical Therapists (PTs) or PT Assistants. PT services help residents recover mobility after injury or illness and are especially important for post-acute (short-stay) rehabilitation. 6m per day
Weekend RN Info Registered nurse hours specifically on weekends. Facilities sometimes reduce RN presence on Saturdays and Sundays — a low weekend RN figure compared to weekday hours can indicate reduced clinical oversight when most administrative staff are absent. 30m per day

Capacity and availability

This home usually has limited availability

Similar occupancy to the state average
Occupancy rate
86.9% Rank #156 / 258Occupancy rate — State benchmarkedThis home is ranked 156th out of 258 homes in Florida. Shows this facility's occupancy rate versus the Florida average, with its Statewide rank out of 258. Higher occupancy signals strong local demand and financial stability.Rankings are based only on facilities in Florida that report data for that category. Facilities without available data are excluded from the ranking.Click the rank badge to see the full State ranking.Click here to see the full State ranking.
Avg. Length of Stay
67 days
Bed community size
36-bed community Rank #843 / 1074Bed count — State benchmarkedThis home is ranked 843rd out of 1074 homes in Florida. Shows this facility's certified or reported bed count compared to other Florida facilities. Larger communities may offer more amenities, programs, and on-site services for residents and families.Rankings are based only on facilities in Florida that report data for that category. Facilities without available data are excluded from the ranking.Click the rank badge to see the full State ranking.Click here to see the full State ranking.
A moderately sized community that may balance personal attention with shared amenities and social activities.
Walk Score
Walk Score: 8 / 100 Rank #1301 / 1486Walk Score — State benchmarkedThis home is ranked 1301st out of 1486 homes in Florida. Shows how walkable this facility's neighborhood is compared to the average Walk Score across Florida facilities. Higher scores benefit residents, families, and staff.Rankings are based only on facilities in Florida that report data for that category. Facilities without available data are excluded from the ranking.Click the rank badge to see the full State ranking.Click here to see the full State ranking.
Car-dependent. Most errands require a car, with limited nearby walkable options.
BBB Rating
BBB Rating: A+ (Not Accredited)
An independent rating from the Better Business Bureau based on factors such as complaint history, transparency, and business practices.
How BBB ratings work

Safety & Compliance

Secured Perimeter
Grab Bars
Emergency SystemsYes

Staffing

Key information about the people who lead and staff this community.

Leadership

ContactMs. Pam Twohey, Director of Administration

Payment & Insurance

1 service
Accept Medicare

Therapy & Rehabilitation

3 services
Rehabilitation Services
Respite Care
Short-Term Rehab

Staffing & Medical

1 service
24-Hour Staffing

Additional Policies & Features

Pets Allowed
HousekeepingYes
Linen ServiceYes
Utilities IncludedYes

Amenities & Lifestyle

ActivitiesThe community hosts various events including parties, dinners, lectures, and concerts, ensuring there is always something happening
Branded ProgramsLife Care
Specific ProgramsArea Attractions, Health Services
Operating Hours00:00-23:59

Contact Sandhill Cove Retirement Living

Health Inspection History

Inspections since 2022
Total health inspections 3

State average N/A


Last Health inspection on May 2025

Total health citations
9 Rank #40 / 252Health citations — State benchmarkedThis home is ranked 40th out of 252 homes in Florida. Shows this facility's total health deficiency citations benchmarked to the Florida State average, with a ranking across all 252 FL facilities. Lower citation counts earn a better rank.Rankings are based only on facilities in Florida that report data for that category. Facilities without available data are excluded from the ranking.Click the rank badge to see the full State ranking.Click here to see the full State ranking.

State average N/A

Citations per inspection
3 Rank #53 / 252Citations per inspection — State benchmarkedThis home is ranked 53rd out of 252 homes in Florida. Shows average deficiency citations per CMS inspection for this facility versus the Florida mean across 252 facilities with citation data. Lower is better.Rankings are based only on facilities in Florida that report data for that category. Facilities without available data are excluded from the ranking.Click the rank badge to see the full State ranking.Click here to see the full State ranking.

State average N/A


Health citations are formal notices following inspections when they fail to comply with safety and care standards.

All 9 citations resulted from standard inspections.

Breakdown of citation severity (last 4 years)
Critical health citations
0
In line with State average

State average: N/A


Serious health citations
0
In line with State average

State average: N/A

0 critical citations State average: N/A

0 serious citations State average: N/A

9 moderate citations State average: N/A

0 minor citations State average: N/A
Citations history (last 4 years)
Infection Control moderate citation May 30, 2025
Corrected

Infection Control moderate citation Feb 22, 2024
Corrected

Quality of Care moderate citation Feb 22, 2024
Corrected

Pharmacy moderate citation Nov 15, 2022
Corrected

Staffing Data

Reporting period: October 1 – December 31, 2025 (Q4 2025). Source: CMS Payroll-Based Journal report.

Total staff 88
Employees 46
Contractors 42
Staff to resident ratio 2.93 : 1
0% compared with State average

State average ratio: 0 : 0

Avg staff/day 28
Average shift 7.8 hours
0% compared with State average

State average: 0 hours

Total staff hours (quarter) 19,971

Nursing staff breakdown

Q4 2025 · Oct 1 – Dec 31 More info This data comes from the CMS Payroll-Based Journal report covering October 1 – December 31, 2025.
Registered Nurse

Manages medical care and health needs.

RN Staff Info 11 total: 6 full-time employees and 5 contractors. 11
Average shift length Info Average shift length. Calculated as total hours divided by days worked and average staff per day. 10.3 hours
Licensed Practical Nurse

Assists with medical care and medications.

LPN Staff Info 12 total: 8 full-time employees and 4 contractors. 12
Average shift length Info Average shift length. Calculated as total hours divided by days worked and average staff per day. 9.8 hours
Certified Nursing Assistant

Helps with daily care and mobility.

CNA Staff Info 38 total: 24 full-time employees and 14 contractors. 38
Average shift length Info Average shift length. Calculated as total hours divided by days worked and average staff per day. 7.9 hours

Contractor staffing

Q4 2025 · Oct 1 – Dec 31 More info This data comes from the CMS Payroll-Based Journal report covering October 1 – December 31, 2025.

Total hours from contractors

17.6%

3,524 contractor hours this quarter

Certified Nursing Assistant: 14 Speech Language Pathologist: 6 Registered Nurse: 5 Licensed Practical Nurse: 4 Physical Therapy Assistant: 3 Physical Therapy Aide: 2 Respiratory Therapy Technician: 2 Medication Aide/Technician: 2 Qualified Social Worker: 1 Administrator: 1 Occupational Therapy Assistant: 1 Medical Director: 1

Staff by category

Q4 2025 · Oct 1 – Dec 31 More info This data comes from the CMS Payroll-Based Journal report covering October 1 – December 31, 2025.
Certified Nursing Assistant2414388,78692100%7.9
Licensed Practical Nurse84123,22592100%9.8
Registered Nurse65111,81492100%10.3
Other Dietary Services Staff20297092100%7.9
Clinical Nurse Specialist2028886571%8
Speech Language Pathologist0666637480%5.1
Nurse Practitioner1015126470%8
Occupational Therapy Aide1014966267%8
Mental Health Service Worker1014725964%8
Administrator0114645863%8
Dietitian1014565762%8
Physical Therapy Assistant0333325661%5.7
Qualified Social Worker0112786267%4.5
Respiratory Therapy Technician0222767177%2.5
Physical Therapy Aide0222766368%4.3
Medication Aide/Technician0223367%5.4
Occupational Therapy Assistant0112567%4.2
Medical Director011644%1.4
38 Certified Nursing Assistant
% of Days 100%
12 Licensed Practical Nurse
% of Days 100%
11 Registered Nurse
% of Days 100%
2 Other Dietary Services Staff
% of Days 100%
2 Clinical Nurse Specialist
% of Days 71%
6 Speech Language Pathologist
% of Days 80%
1 Nurse Practitioner
% of Days 70%
1 Occupational Therapy Aide
% of Days 67%
1 Mental Health Service Worker
% of Days 64%
1 Administrator
% of Days 63%
1 Dietitian
% of Days 62%
3 Physical Therapy Assistant
% of Days 61%
1 Qualified Social Worker
% of Days 67%
2 Respiratory Therapy Technician
% of Days 77%
2 Physical Therapy Aide
% of Days 68%
2 Medication Aide/Technician
% of Days 7%
1 Occupational Therapy Assistant
% of Days 7%
1 Medical Director
% of Days 4%

Penalties and fines

Federal penalties imposed by CMS for regulatory violations, including civil money penalties (fines) and denials of payment for new Medicare/Medicaid admissions.

Source: CMS Penalties Database

No penalties in the past 3 years

No civil money penalties or payment denials were reported in the last 3 years.

Quality of care over time

These measures show how residents usually do over time at this home, based on health outcomes and preventive care.

High-risk clinical events score Info A composite score based on pressure ulcers, falls with injury, weight loss, walking ability decline, and activities of daily living decline. 5.4
27% better than State average

State average: 7.4

Functional decline score Info A composite score based on activities of daily living decline, walking ability decline, and incontinence. 19.3
56% worse than State average

State average: 12.4

Long-stay resident measures
Need for Help with Daily Activities Increased Info Percent of long-stay residents whose need for help with daily activities has increased 18.2%
73% worse than State average

State average: 10.5%

Low Risk Residents with Bowel/Bladder Incontinence Info Percent of low risk long-stay residents who lose control of their bowels or bladder 20.5%
51% worse than State average

State average: 13.5%

Falls with Major Injury Info Percent of long-stay residents experiencing one or more falls with major injury 3.5%
30% worse than State average

State average: 2.6%

High Risk Residents with Pressure Ulcers Info Percent of long-stay high risk residents with pressure ulcers 0.0%
100% better than State average

State average: 5.4%

Urinary Tract Infection Info Percent of long-stay residents with a urinary tract infection 2.3%
164% worse than State average

State average: 0.9%

Lost Too Much Weight Info Percent of long-stay residents who lose too much weight 0.0%
100% better than State average

State average: 6.0%

Depressive Symptoms Info Percent of long-stay residents who have depressive symptoms 1.3%
61% better than State average

State average: 3.3%

Antipsychotic Use Info Percent of long-stay residents who received an antipsychotic medication 2.3%
71% better than State average

State average: 8.0%

Pneumococcal Vaccine Info Percent of long-stay residents assessed and appropriately given the pneumococcal vaccine 100.0%
In line with State average

State average: 97.7%

Influenza Vaccine Info Percent of long-stay residents assessed and appropriately given the seasonal influenza vaccine 100.0%
In line with State average

State average: 99.2%

Short-stay resident measures
Pneumococcal Vaccine Info Percent of short-stay residents assessed and appropriately given the pneumococcal vaccine 99.4%
6% better than State average

State average: 94.0%

Antipsychotic medication increase Info Percent of short-stay residents who newly received an antipsychotic medication 0.5%
68% better than State average

State average: 1.5%

Influenza Vaccine Info Percent of short-stay residents assessed and appropriately given the seasonal influenza vaccine 100.0%
6% better than State average

State average: 94.7%

Breakdown by payment type

Medicare

72% of new residents, usually for short-term rehab.

Typical stay 22 days

Private pay

24% of new residents, often for short stays.

Typical stay 10 - 11 months

Medicaid

3% of new residents, often for long-term daily care.

Typical stay 11 - 12 months

Facility Characteristics

Source: CMS Long-Term Care Facility Characteristics (Data as of Jan 2026)

Total residents 30
Medicare
6
20% of residents
Medicaid
10
33.3% of residents
Private pay or other
14
46.7% of residents
Programs & Services
Residents Group

Residents meet regularly to discuss policies, care quality, and activities

CCRC

Part of a Continuing Care Retirement Community offering multiple care levels

Active Resident Council

Organized group of residents that meets regularly to discuss facility policies, quality of life, and activities.

Finances and operations

Based on CMS SNF Cost Report for fiscal year ending in 12/2023.

For-profit
Corporation
Net patient revenue Info Net patient revenue — what the home actually collects for resident care, after contractual allowances, bad debt and discounts are subtracted from its gross charges (CMS cost report, Worksheet G-3). It covers resident care only; money the home earns from other sources is shown separately as "Other income."
$5.4M
Net patient income Info Net patient income: net patient revenue minus the home's total operating expenses. A positive figure means it earns more from resident care than it spends to deliver it; a negative figure means the opposite. It excludes non-operating "other income."
-$18.7M
For-profit Corporation
Net patient revenue Info Net patient revenue — what the home actually collects for resident care, after contractual allowances, bad debt and discounts are subtracted from its gross charges (CMS cost report, Worksheet G-3). It covers resident care only; money the home earns from other sources is shown separately as "Other income."
$5.4M Rank #69 / 257Revenue — State benchmarkedThis home is ranked 69th out of 257 homes in Florida. Shows this facility's annual revenue compared to the Florida average. Higher revenue generally means more resources for staffing and capital — read alongside Payroll %.Rankings are based only on facilities in Florida that report data for that category. Facilities without available data are excluded from the ranking.Click the rank badge to see the full State ranking.Click here to see the full State ranking.
Net patient income Info Net patient income: net patient revenue minus the home's total operating expenses. A positive figure means it earns more from resident care than it spends to deliver it; a negative figure means the opposite. It excludes non-operating "other income."
-$18.7M
Other income Info Money the home earns outside of resident care — such as investments, grants, rentals and other non-operating sources (CMS cost report, Worksheet G-3). It is tracked separately from net patient revenue: it is not part of that figure, and it is not included in net patient income.
$17.7M
Payroll costs Info Staff salaries plus wage-related costs — benefits such as payroll taxes, health insurance and retirement — from the home's own accounting records (CMS cost report, Worksheet A). Contract or agency labor is counted separately, under other operating costs. Rank #67 / 257Payroll — State benchmarkedThis home is ranked 67th out of 257 homes in Florida. Shows total annual staff payroll benchmarked to the Florida average. Higher payroll investment relative to peers often signals better staffing and less reliance on cheaper contract labor.Rankings are based only on facilities in Florida that report data for that category. Facilities without available data are excluded from the ranking.Click the rank badge to see the full State ranking.Click here to see the full State ranking.
$9.3M 171.4% of net patient revenue Info Payroll as a share of revenue: staff salaries and wage-related benefits divided by net patient revenue. A higher figure means more of each revenue dollar goes to staff pay. Rank #164 / 257Payroll % — State benchmarkedThis home is ranked 164th out of 257 homes in Florida. Shows payroll as a percentage of revenue versus the Florida average. Well-run Florida facilities typically land around 49–56% — the top third Statewide. Below 25% may signal understaffing or heavy agency use — read with Staffing ratings.Rankings are based only on facilities in Florida that report data for that category. Facilities without available data are excluded from the ranking.Click the rank badge to see the full State ranking.Click here to see the full State ranking.
Other operating costs Info Everything it costs to run the home apart from payroll — food, utilities, supplies, maintenance, contract labor and administration. Calculated as total operating expense minus payroll (staff salaries and wage-related benefits).
$14.8M
Total costs Info The home's total operating expense for the year — all the costs of running it, salaries included (CMS cost report, Worksheet G-3).
$24.1M

What does this home offer?

Housing options icon

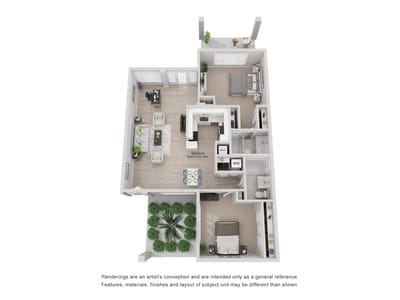
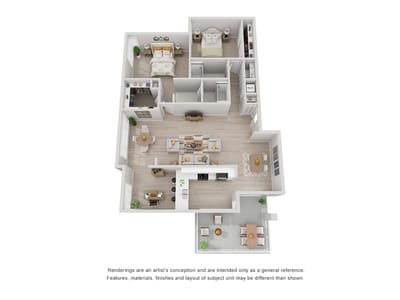
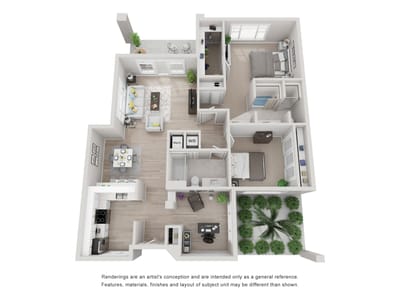
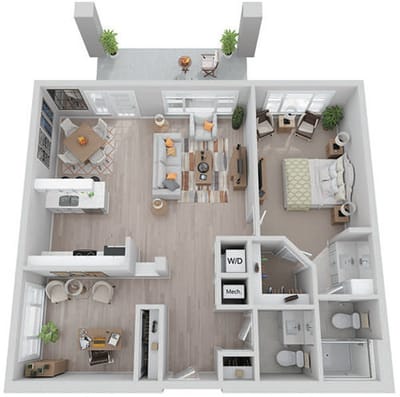
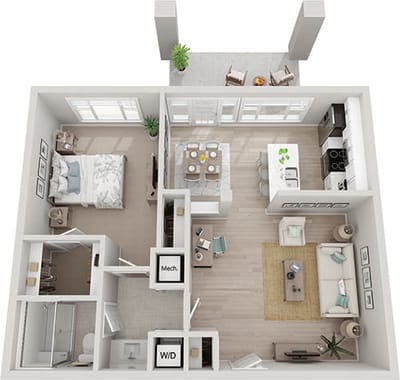
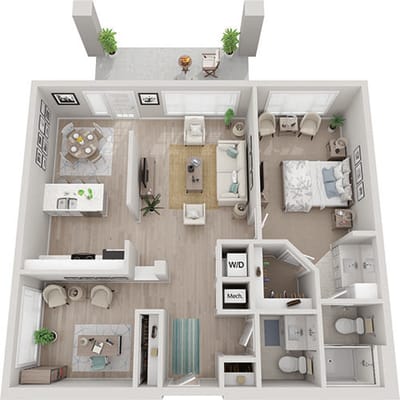
Housing Options: 1 Bed / 2 Bed

Building type icon
Building type icon

Building Type: Single-story

Beauty services icon

Beauty Services

Transportation services icon

Transportation Services

Housekeeping icon
Housekeeping icon

Housekeeping Services

Social and recreational activities icon

Social and Recreational Activities

Wellness Programs icon

Wellness Programs

Who this home usually serves

TYPE OF STAY

Mostly short-term rehab stays

Most residents typically stay for a few weeks or months before returning home or moving on.

Most new residents arrive under Medicare (72% of admissions), and a typical Medicare stay runs around 22 days.

Admissions
177 total

Coverage residents most often arrive under.

Medicare 72%
Private pay 24%
Medicaid 3%
Discharges
175 total

Coverage residents most often leave under.

Medicare 67%
Private pay 29%
Medicaid 4%

Places of interest near Sandhill Cove Retirement Living

Address 2.2 miles from city center Info Estimated distance in miles from Palm City's city center to Sandhill Cove Retirement Living's address, calculated via Google Maps.

Calculate Travel Distance to Sandhill Cove Retirement Living

Add your location

Address

Compare Nursing Homes around the area

The information below is reported by the Florida Agency for Health Care Administration (AHCA).

Sandhill Cove Retirement Living
NH
AL
IL
MC
RC
Palm City -36 A+ 8 1 Bed / 2 Bed
Terracina Grand
NH
AL
IL
MC
RC
Naples -200 A+ 12 Studio / 1 Bed / 2 Bed
Brookdale DeLand
NH
AL
MC
Deland (Scarlett) -89 A+ 14 Studio / Suite
The Oaks of Clearwater
NH
AL
IL
MC
Clearwater (Oak Bluffs) -175 B- 64 Studio / 1 Bed / 2 Bed
The Bridge at Ocala
NH
AL
Ocala -95 A+ 44 Studio / 1 Bed

Frequently Asked Questions about Sandhill Cove Retirement Living

Is Sandhill Cove Retirement Living in a walkable area?

Sandhill Cove Retirement Living has a walk score of 8. Car-dependent. Most errands require a car, with limited nearby walkable options.

What is the occupancy rate at Sandhill Cove Retirement Living?

Sandhill Cove Retirement Living's occupancy is 86.9%.

Does Sandhill Cove Retirement Living operate as a for-profit or non-profit?

Sandhill Cove Retirement Living is registered as a for-profit in FL.

Are there photos of Sandhill Cove Retirement Living?

Yes — there are 31 photos of Sandhill Cove Retirement Living in the photo gallery on this page.

What is the address of Sandhill Cove Retirement Living?

Sandhill Cove Retirement Living is located at 1500 Sw Capri St, Palm City, FL 34990.

What is the phone number of Sandhill Cove Retirement Living?

(772) 220-1090 will put you in contact with the team at Sandhill Cove Retirement Living.

Is Sandhill Cove Retirement Living Medicare or Medicaid certified?

Yes — Sandhill Cove Retirement Living is a CMS-certified provider of Medicare and Medicaid.

Guides for Better Senior Living

Care Cost Calculator: See Prices in Your Area

Nursing Home Data Explorer

Don’t Wait Too Long: 7 Red Flag Signs Your Parent Needs Assisted Living Now

The True Cost of Assisted Living in 2025 – And How Families Are Paying For It

Understanding Senior Living Costs: Pricing Models, Discounts & Financial Assistance