Hawthorne Inn of Ocala
Nursing Home, Assisted Living, Independent Living & Memory Care · Florida, FL
CMS overall rating Info CMS (the Centers for Medicare & Medicaid Services) is the federal agency that rates nursing home quality. Its Overall Rating runs from 1 to 5 stars, combining health inspections, staffing, and quality measures, with inspections weighted most heavily.

Hawthorne Inn of Ocala

Nursing Home, Assisted Living, Independent Living & Memory Care · Florida, FL
CMS overall rating Info CMS (the Centers for Medicare & Medicaid Services) is the federal agency that rates nursing home quality. Its Overall Rating runs from 1 to 5 stars, combining health inspections, staffing, and quality measures, with inspections weighted most heavily.
Calculator: See prices in your area
Hawthorne Inn of Ocala accepts Medicaid, Medicare, and private pay.

Overview of Hawthorne Inn of Ocala

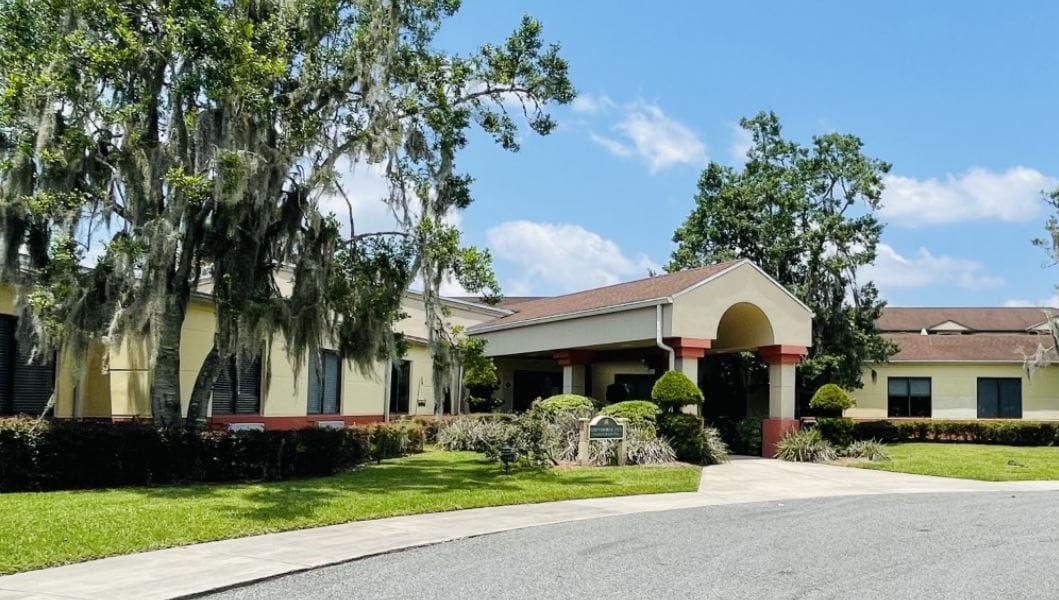
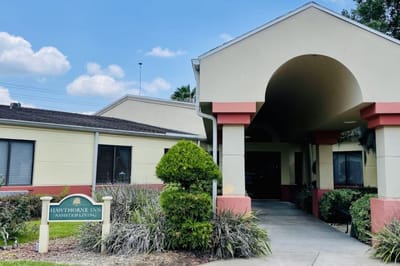
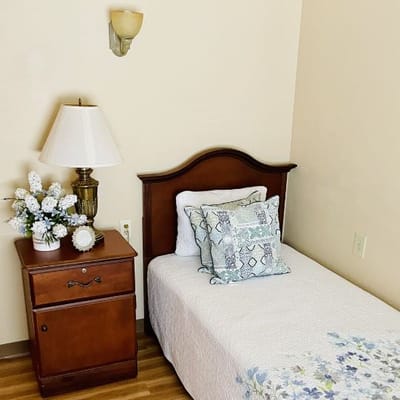
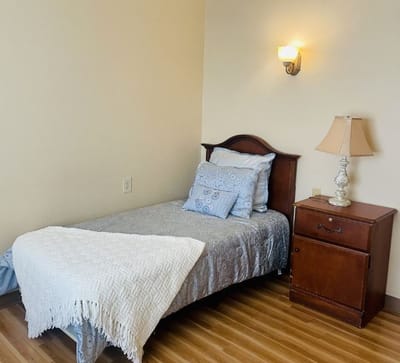
With seniors’ well-being in mind, the extraordinary senior living community of Hawthorne Inn of Ocala situated in the serene neighborhood of South West 33rd Avenue, Ocala, FL, offers assisted living and independent living. The community features elegant and snug residences with various one-bedroom and two-bedroom floor plans to ensure seniors live in comfort and style. Enjoy the care and assistance you need and prefer with a compassionate and well-trained team.

Carefully curated activities and enjoyable programs are conducted based on residents’ interests and strengths for a happy life. Indulge in healthy and tasty meals for dietary satisfaction. Hawthorne Inn of Ocala is ideal for seniors who want to optimize their independence while receiving the utmost attention for their ever-changing needs.

(352) 237-7773

Quality ratings

Measured by Centers for Medicare & Medicaid Services (CMS)

Overall rating Info The Overall CMS Rating combines results from health inspections, staffing levels and quality measures. Health inspections carry the most weight. Staffing and quality scores can increase or decrease the final rating based on performance compared to state and national standards.
▼ 68.5% Below FL avg. ▼ 68.5% Below FL avg.FL average: 3.2Click the badge to see the full State ranking.Click here to see the full State ranking.
Health Inspection Info Based on the results of the facility's three most recent standard inspections and any complaint investigations. CMS reviews the number, scope, and severity of deficiencies, with more recent findings weighted more heavily.
▼ 64.4% Below FL avg. ▼ 64.4% Below FL avg.FL average: 2.8Click the badge to see the full State ranking.Click here to see the full State ranking.
Staffing Info Measures average nursing staff hours per resident per day, including Registered Nurses (RNs) and total nursing staff. Ratings are adjusted based on the level of care residents require and are compared to state and national benchmarks.
▼ 40.9% Below FL avg. ▼ 40.9% Below FL avg.FL average: 3.4Click the badge to see the full State ranking.Click here to see the full State ranking.
Quality Measures Info Based on clinical and physical health indicators reported to CMS, such as hospital readmissions, falls, pressure ulcers, and improvements in mobility. These measures reflect how well residents' health needs are being managed.
▼ 1.4% Below FL avg. ▼ 1.4% Below FL avg.FL average: 4.1Click the badge to see the full State ranking.Click here to see the full State ranking.

Staffing hours breakdown

Info Daily nursing hours per resident by staff type, reported to CMS. Higher is generally better — compare this facility to state and national averages to see where staffing stands.

Hours per resident per day — compared to Florida state averages

Total nursing care / resident Info This home is ranked 145th out of 253 homes in Florida for nurse hours. Total adjusted nursing hours per resident per day, combining RN, LPN, and aide time. CMS adjusts this for case-mix so facilities can be fairly compared.
3h 50m per day
Rank #145 / 253Nurse hours — State benchmarkedThis home is ranked 145th out of 253 homes in Florida. Shows adjusted nurse hours per resident per day benchmarked to the Florida average, with a ranking across 253 Florida facilities. More hours mean more direct care. The national average is about 3.5 hrs; below 3.0 is a red flag.Rankings are based only on facilities in Florida that report data for that category. Facilities without available data are excluded from the ranking.Click the rank badge to see the full State ranking.Click here to see the full State ranking.
This facility Florida avg (4h 2m per day)
vs Florida avg
-5%

4 of 6 metrics below state avg

Standout metric LPN / LVN is +18% above state avg
Staff typeHours / Day / Residentvs state avg
Registered Nurse (RN) Info RNs hold the highest nursing license and can assess residents, interpret test results, and direct care plans. More RN hours per day often signals stronger clinical oversight and faster response to health changes. 31m per day ▼ 29% State avg: 44m per day · National avg: 41m per day
LPN / LVN Info Licensed Practical Nurses (LPNs) or Licensed Vocational Nurses (LVNs) deliver routine hands-on care — medication administration, wound dressing, and monitoring vital signs. They work under RN supervision and make up a large share of daily bedside care. 56m per day ▲ 18% State avg: 47m per day · National avg: 52m per day
Nurse Aide Info Certified Nurse Aides (CNAs) provide the most direct day-to-day assistance: bathing, dressing, feeding, and mobility. Nurse aide hours are typically the largest staffing category and directly affect residents' quality of life. 2h 17m per day ▼ 3% State avg: 2h 20m per day · National avg: 2h 20m per day
Weekend Total Nursing Info Combined nursing hours (RN + LPN + Nurse Aide) per resident per day on weekends. Staffing often drops on weekends — this figure reveals whether the facility maintains adequate coverage outside of weekday hours. 3h 27m per day ■ Avg State avg: 3h 32m per day · National avg: 3h 27m per day
Physical Therapist Info Hours per resident per day provided by licensed Physical Therapists (PTs) or PT Assistants. PT services help residents recover mobility after injury or illness and are especially important for post-acute (short-stay) rehabilitation. 4m per day ▼ 38% State avg: 6m per day · National avg: 4m per day
Weekend RN Info Registered nurse hours specifically on weekends. Facilities sometimes reduce RN presence on Saturdays and Sundays — a low weekend RN figure compared to weekday hours can indicate reduced clinical oversight when most administrative staff are absent. 19m per day ▼ 41% State avg: 32m per day · National avg: 29m per day

Capacity and availability

Avg. Length of Stay
67 days
Bed community size
44-bed community Rank #798 / 1074Bed count — State benchmarkedThis home is ranked 798th out of 1074 homes in Florida. Shows this facility's certified or reported bed count compared to other Florida facilities. Larger communities may offer more amenities, programs, and on-site services for residents and families.Rankings are based only on facilities in Florida that report data for that category. Facilities without available data are excluded from the ranking.Click the rank badge to see the full State ranking.Click here to see the full State ranking.
A moderately sized community that may balance personal attention with shared amenities and social activities.
Years in operation
15 years in operation
A community with a solid operating history and experience delivering ongoing care.
Walk Score
Walk Score: 36 / 100 Rank #817 / 1486Walk Score — State benchmarkedThis home is ranked 817th out of 1486 homes in Florida. Shows how walkable this facility's neighborhood is compared to the average Walk Score across Florida facilities. Higher scores benefit residents, families, and staff.Rankings are based only on facilities in Florida that report data for that category. Facilities without available data are excluded from the ranking.Click the rank badge to see the full State ranking.Click here to see the full State ranking.
Somewhat walkable. A few nearby services may be reachable on foot, but most trips require transportation.

About this community

Occupancy

Occupancy rate
92%
Rank #90 / 258Occupancy rate — State benchmarkedThis home is ranked 90th out of 258 homes in Florida. Shows this facility's occupancy rate versus the Florida average, with its Statewide rank out of 258. Higher occupancy signals strong local demand and financial stability.Rankings are based only on facilities in Florida that report data for that category. Facilities without available data are excluded from the ranking.Click the rank badge to see the full State ranking.Click here to see the full State ranking.
Higher than the Florida average: 84.3%
Occupied beds
40 / 44
Average occupied beds in Florida homes 108 beds

License Details

Facility TypeAssisted Living Facility
StatusLicensed
IssuanceApril 1, 2025
ExpirationMarch 31, 2027
CountyMarion
License Number7129

Ownership & Operating Entity

Hawthorne Inn of Ocala is legally operated by Hawthorne Ocala Operations Llc, and administered by Shawnicka Hart.

Management CompanyHAWTHORNE CARE CONSULTING LLC
Profit StatusFor-Profit

Type Of Units

Private
44 units
Total beds
44 units

Staffing

Key information about the people who lead and staff this community.

Languages Spoken

English Spanish

Leadership

ContactDavid Minnici, Executive Director

Contact Hawthorne Inn of Ocala

Inspection History

In Florida, the Agency for Health Care Administration (AHCA) is the primary authority that conducts unannounced inspections and completes official health quality reports for all healthcare facilities.

Since 2011 · 15 years of data 21 citations 24 inspections 1 fine $1.0K fined
Inspection Score Info A composite 0–100 score combining this facility's inspections, citations, complaints, and enforcement actions relative to the Florida state average. The score below shows how many points this facility sits above or below the typical Florida nursing home score (the benchmark); higher is better.

11 points above the Florida average for nursing homes (83/100)

Rank #162 / 876 in Florida Inspection Score — State benchmarked This home is ranked 162nd out of 876 homes in Florida. Shows this facility's inspection score compared to the Florida average among 876 comparable communities in the ranking pool. Rankings are based only on facilities in Florida that report data for that category. Facilities without available data are excluded from the ranking. Inspection score: 94 out of 100. Letter grade A. 11 points above the Florida average for nursing homes (83/100)

Inspection Scorecard Info This scorecard compares key inspection, citation, and complaint metrics at this facility against the Florida state average. Metrics rated ≥15% worse than average are highlighted in red; those ≥15% better are highlighted in green.

Since 2013 vs. Florida state average
Overall vs. FL average 0 Worse No metrics in this bucket. 6 Better Metrics better than Florida average:
• Total citations (36% below)
• Citations per year (36% below)
• Citations per inspection (31% below)
• Total inspections (8% below)
• Inspections with citations (44% below)
• Inspection citation rate (39% below)
Latest Inspection March 27, 2025 Routine

Citations Info Citations are formal regulatory issues recorded during state inspections.

This FacilityFL Averagevs. FL Avg
Total citations Info Formal regulatory issues recorded by inspectors across all inspection types. 2133 This facility has 36% fewer total citations than a typical Florida nursing home (21 vs. FL avg 33).↓ 36% better Rank #316 / 919 Total citations — State benchmarked This home is ranked 316th out of 919 homes in Florida. Shows this facility's total citations compared to the Florida average among 919 comparable communities in the ranking pool. Rankings are based only on facilities in Florida that report data for that category. Facilities without available data are excluded from the ranking.
Citations per year Info Average citations per year since 2013. 1.62.5 This facility has 36% fewer citations per year than a typical Florida nursing home (1.6 vs. FL avg 2.5).↓ 36% better
Citations per inspection Info Average citations per inspection. 0.91.3 This facility has 31% fewer citations per inspection than a typical Florida nursing home (0.9 vs. FL avg 1.3).↓ 31% better Rank #64 / 919 Citations per inspection — State benchmarked This home is ranked 64th out of 919 homes in Florida. Shows this facility's citations per inspection compared to the Florida average among 919 comparable communities in the ranking pool. Rankings are based only on facilities in Florida that report data for that category. Facilities without available data are excluded from the ranking.

Inspections Info State inspections evaluate whether the facility meets health and safety standards.

This FacilityFL Averagevs. FL Avg
Total inspections Info Combined count of all routine and focused inspections. Excludes complaint investigations. 2426 This facility has 8% fewer total inspections than a typical Florida nursing home (24 vs. FL avg 26).↓ 8% better
Inspections with citations Info Inspections that resulted in at least one regulatory citation. 916 This facility has 44% fewer inspections with citations than a typical Florida nursing home (9 vs. FL avg 16).↓ 44% better
Inspection citation rate Info Percentage of inspections that resulted in at least one citation. 38%62% This facility has 24 percentage points lower inspection citation rate than a typical Florida nursing home (38% vs. FL avg 62%).↓ 24% better Rank #201 / 919 Inspection citation rate — State benchmarked This home is ranked 201st out of 919 homes in Florida. Shows this facility's % of inspections with citations compared to the Florida average among 919 comparable communities in the ranking pool. Rankings are based only on facilities in Florida that report data for that category. Facilities without available data are excluded from the ranking.

Inspection Reports Summary Info An editor-reviewed summary of the themes and findings across this facility's recent inspection reports.

  • The most recent inspection on March 27, 2025, found no deficiencies and no complaints.
  • Past deficiencies mostly involved low-severity issues in admissions assessments, staff records, medication assistance, and resident care supervision.
  • The facility’s inspection record shows consistent improvement with no deficiencies noted in the last five inspections since July 2021.

Health Inspection History

Inspections since 2022
Total health inspections 6

Florida average 4.3


Last Health inspection on Jun 2025

Total health citations
17 Rank #123 / 252Health citations — State benchmarkedThis home is ranked 123rd out of 252 homes in Florida. Shows this facility's total health deficiency citations benchmarked to the Florida State average, with a ranking across all 252 FL facilities. Lower citation counts earn a better rank.Rankings are based only on facilities in Florida that report data for that category. Facilities without available data are excluded from the ranking.Click the rank badge to see the full State ranking.Click here to see the full State ranking.

Florida average 19.7

Citations per inspection
2.83 Rank #45 / 252Citations per inspection — State benchmarkedThis home is ranked 45th out of 252 homes in Florida. Shows average deficiency citations per CMS inspection for this facility versus the Florida mean across 252 facilities with citation data. Lower is better.Rankings are based only on facilities in Florida that report data for that category. Facilities without available data are excluded from the ranking.Click the rank badge to see the full State ranking.Click here to see the full State ranking.

Florida average 4.48


Health citations are formal notices following inspections when they fail to comply with safety and care standards.

12 of 17 citations resulted from standard inspections; and 5 of 17 resulted from complaint investigations.

Breakdown of citation severity (last 4 years)
Critical health citations
2
150% worse than Florida average

Florida average: 0.8


Serious health citations
0
100% better than Florida average

Florida average: 0.4

2 critical citations Florida average: 0.8

0 serious citations Florida average: 0.4

15 moderate citations Florida average: 18.4

0 minor citations Florida average: 0.2
Citations history (last 4 years)
Administration critical citation Jun 17, 2025
Corrected

Quality of Care critical citation Jun 17, 2025
Corrected

Care Planning moderate citation Jun 17, 2025
Corrected

Infection Control moderate citation Jan 16, 2025
Corrected

Staffing Data

Reporting period: October 1 – December 31, 2025 (Q4 2025). Source: CMS Payroll-Based Journal report.

Total staff 155
Employees 130
Contractors 25
Staff to resident ratio 1.32 : 1
10% fewer staff per resident than Florida average
Florida average ratio: 1.47 : 1 Florida average ratio: 1.47 : 1See full Florida ranking
Avg staff/day 61
Average shift 8 hours
0% compared with Florida average
Florida average: 7.9 hours Florida average shift: 7.9 hoursSee full Florida ranking
Total staff hours (quarter) 45,086

Nursing staff breakdown

Q4 2025 · Oct 1 – Dec 31 More info This data comes from the CMS Payroll-Based Journal report covering October 1 – December 31, 2025.
Registered Nurse

Manages medical care and health needs.

RN Staff Info All 15 RN Staff are full-time employees. No contractors work on this role. 15
Average shift length Info Average shift length. Calculated as total hours divided by days worked and average staff per day. 8.1 hours
Licensed Practical Nurse

Assists with medical care and medications.

LPN Staff Info All 29 LPN Staff are full-time employees. No contractors work on this role. 29
Average shift length Info Average shift length. Calculated as total hours divided by days worked and average staff per day. 9.5 hours
Certified Nursing Assistant

Helps with daily care and mobility.

CNA Staff Info All 74 CNA Staff are full-time employees. No contractors work on this role. 74
Average shift length Info Average shift length. Calculated as total hours divided by days worked and average staff per day. 7.8 hours

Contractor staffing

Q4 2025 · Oct 1 – Dec 31 More info This data comes from the CMS Payroll-Based Journal report covering October 1 – December 31, 2025.

Total hours from contractors

7.9%

3,573 contractor hours this quarter

Physical Therapy Aide: 6 Respiratory Therapy Technician: 4 Physical Therapy Assistant: 4 Speech Language Pathologist: 3 Qualified Social Worker: 3 Occupational Therapy Aide: 2 Occupational Therapy Assistant: 2 Medical Director: 1

Staff by category

Q4 2025 · Oct 1 – Dec 31 More info This data comes from the CMS Payroll-Based Journal report covering October 1 – December 31, 2025.
Certified Nursing Assistant7407423,42792100%7.8
Licensed Practical Nurse290299,33392100%9.5
Registered Nurse150153,40192100%8.1
Clinical Nurse Specialist3031,4426672%8
Other Dietary Services Staff20296792100%7.6
Physical Therapy Assistant0449048390%6.7
Speech Language Pathologist0338776672%7.2
Occupational Therapy Aide1236286267%7.5
Respiratory Therapy Technician0446127683%6.4
Dental Services Staff1016086571%9.4
Physical Therapy Aide0665346874%6.3
Dietitian1015046368%8
Administrator1014966368%7.9
Nurse Practitioner1014886166%8
Qualified Social Worker0333725459%6.6
RN Director of Nursing1012403033%8
Mental Health Service Worker1011281617%8
Occupational Therapy Assistant0221023235%2.7
Medical Director0112433%8
74 Certified Nursing Assistant
% of Days 100%
29 Licensed Practical Nurse
% of Days 100%
15 Registered Nurse
% of Days 100%
3 Clinical Nurse Specialist
% of Days 72%
2 Other Dietary Services Staff
% of Days 100%
4 Physical Therapy Assistant
% of Days 90%
3 Speech Language Pathologist
% of Days 72%
3 Occupational Therapy Aide
% of Days 67%
4 Respiratory Therapy Technician
% of Days 83%
1 Dental Services Staff
% of Days 71%
6 Physical Therapy Aide
% of Days 74%
1 Dietitian
% of Days 68%
1 Administrator
% of Days 68%
1 Nurse Practitioner
% of Days 66%
3 Qualified Social Worker
% of Days 59%
1 RN Director of Nursing
% of Days 33%
1 Mental Health Service Worker
% of Days 17%
2 Occupational Therapy Assistant
% of Days 35%
1 Medical Director
% of Days 3%

Penalties and fines

Includes penalties issued in 2025

Federal penalties imposed by CMS for regulatory violations, including civil money penalties (fines) and denials of payment for new Medicare/Medicaid admissions.

Source: CMS Penalties Database (Data as of Jan 2026)

Total fines amount $158K Rank #246 / 258Federal fines — State benchmarkedThis home is ranked 246th out of 258 homes in Florida. Shows this facility's cumulative CMS federal fine dollars versus the Florida average among facilities with fines, and where it ranks among 258 facilities in the pool. Lower total dollars mean a better rank.Rankings are based only on facilities in Florida that report data for that category. Facilities without available data are excluded from the ranking.Click the rank badge to see the full State ranking.Click here to see the full State ranking.
119% higher than Florida average

Florida average: $72K

Number of fines 1
62% fewer fines than Florida average

Florida average: 2.6

Payment Denials Info Serious action where Medicare and/or Medicaid temporarily stops payments for new residents until issues are fixed. 0
100% fewer payment denials than Florida average

Florida average: 0.1

Fines amount comparison
This facility $158K
Florida average $72K
Penalty History

Penalties are imposed by CMS for violations of federal nursing home regulations.

1 penalty in the past 3 years

Jun 17, 2025 · $158K

Civil Money Penalty Info Fines imposed for noncompliance, which can be assessed per day or per instance of violation. Jun 17, 2025
$158K

Last updated: Jan 2026

Quality of care over time

These measures show how residents usually do over time at this home, based on health outcomes and preventive care.

High-risk clinical events score Info A composite score based on pressure ulcers, falls with injury, weight loss, walking ability decline, and activities of daily living decline. 6.0
19% better than Florida average

Florida average: 7.4

Functional decline score Info A composite score based on activities of daily living decline, walking ability decline, and incontinence. 7.3
41% better than Florida average

Florida average: 12.4

Long-stay resident measures
Need for Help with Daily Activities Increased Info Percent of long-stay residents whose need for help with daily activities has increased 5.7%
45% better than Florida average

Florida average: 10.5%

Walking Ability Worsened Info Percent of long-stay residents whose ability to move independently worsened 9.0%
31% better than Florida average

Florida average: 12.9%

Low Risk Residents with Bowel/Bladder Incontinence Info Percent of low risk long-stay residents who lose control of their bowels or bladder 7.2%
47% better than Florida average

Florida average: 13.5%

Falls with Major Injury Info Percent of long-stay residents experiencing one or more falls with major injury 2.4%
8% better than Florida average

Florida average: 2.6%

High Risk Residents with Pressure Ulcers Info Percent of long-stay high risk residents with pressure ulcers 3.3%
38% better than Florida average

Florida average: 5.4%

Urinary Tract Infection Info Percent of long-stay residents with a urinary tract infection 1.6%
78% worse than Florida average

Florida average: 0.9%

Lost Too Much Weight Info Percent of long-stay residents who lose too much weight 9.6%
61% worse than Florida average

Florida average: 6.0%

Depressive Symptoms Info Percent of long-stay residents who have depressive symptoms 1.8%
46% better than Florida average

Florida average: 3.3%

Antipsychotic Use Info Percent of long-stay residents who received an antipsychotic medication 2.3%
72% better than Florida average

Florida average: 8.0%

Pneumococcal Vaccine Info Percent of long-stay residents assessed and appropriately given the pneumococcal vaccine 98.5%
In line with Florida average

Florida average: 97.7%

Influenza Vaccine Info Percent of long-stay residents assessed and appropriately given the seasonal influenza vaccine 100.0%
In line with Florida average

Florida average: 99.2%

Short-stay resident measures
Pneumococcal Vaccine Info Percent of short-stay residents assessed and appropriately given the pneumococcal vaccine 87.9%
6% worse than Florida average

Florida average: 94.0%

Antipsychotic medication increase Info Percent of short-stay residents who newly received an antipsychotic medication 0.6%
60% better than Florida average

Florida average: 1.5%

Influenza Vaccine Info Percent of short-stay residents assessed and appropriately given the seasonal influenza vaccine 91.6%
In line with Florida average

Florida average: 94.7%

Breakdown by payment type

Medicare

38% of new residents, usually for short-term rehab.

Typical stay 28 days

Private pay

9% of new residents, often for short stays.

Typical stay 7 - 8 months

Medicaid

53% of new residents, often for long-term daily care.

Typical stay 2 months

Facility Characteristics

Source: CMS Long-Term Care Facility Characteristics (Data as of Jan 2026)

Total residents 117
Medicare
22
18.8% of residents
Medicaid
43
36.8% of residents
Private pay or other
52
44.4% of residents
Programs & Services
Residents Group

Residents meet regularly to discuss policies, care quality, and activities

Active Resident Council

Organized group of residents that meets regularly to discuss facility policies, quality of life, and activities.

Finances and operations

Based on CMS SNF Cost Report for fiscal year ending in 12/2023.

Privately-owned community
Operated by a single business entity.
Net patient revenue Info Net patient revenue — what the home actually collects for resident care, after contractual allowances, bad debt and discounts are subtracted from its gross charges (CMS cost report, Worksheet G-3). It covers resident care only; money the home earns from other sources is shown separately as "Other income."
$13.8M
Net patient income Info Net patient income: net patient revenue minus the home's total operating expenses. A positive figure means it earns more from resident care than it spends to deliver it; a negative figure means the opposite. It excludes non-operating "other income."
-$1.6M
Privately-owned community Operated by a single business entity.
Net patient revenue Info Net patient revenue — what the home actually collects for resident care, after contractual allowances, bad debt and discounts are subtracted from its gross charges (CMS cost report, Worksheet G-3). It covers resident care only; money the home earns from other sources is shown separately as "Other income."
$13.8M Rank #142 / 257Revenue — State benchmarkedThis home is ranked 142nd out of 257 homes in Florida. Shows this facility's annual revenue compared to the Florida average. Higher revenue generally means more resources for staffing and capital — read alongside Payroll %.Rankings are based only on facilities in Florida that report data for that category. Facilities without available data are excluded from the ranking.Click the rank badge to see the full State ranking.Click here to see the full State ranking.
Net patient income Info Net patient income: net patient revenue minus the home's total operating expenses. A positive figure means it earns more from resident care than it spends to deliver it; a negative figure means the opposite. It excludes non-operating "other income."
-$1.6M
Other income Info Money the home earns outside of resident care — such as investments, grants, rentals and other non-operating sources (CMS cost report, Worksheet G-3). It is tracked separately from net patient revenue: it is not part of that figure, and it is not included in net patient income.
$1.6M
Payroll costs Info Staff salaries plus wage-related costs — benefits such as payroll taxes, health insurance and retirement — from the home's own accounting records (CMS cost report, Worksheet A). Contract or agency labor is counted separately, under other operating costs. Rank #110 / 257Payroll — State benchmarkedThis home is ranked 110th out of 257 homes in Florida. Shows total annual staff payroll benchmarked to the Florida average. Higher payroll investment relative to peers often signals better staffing and less reliance on cheaper contract labor.Rankings are based only on facilities in Florida that report data for that category. Facilities without available data are excluded from the ranking.Click the rank badge to see the full State ranking.Click here to see the full State ranking.
$8.7M 63% of net patient revenue Info Payroll as a share of revenue: staff salaries and wage-related benefits divided by net patient revenue. A higher figure means more of each revenue dollar goes to staff pay. Rank #75 / 257Payroll % — State benchmarkedThis home is ranked 75th out of 257 homes in Florida. Shows payroll as a percentage of revenue versus the Florida average. Well-run Florida facilities typically land around 49–56% — the top third Statewide. Below 25% may signal understaffing or heavy agency use — read with Staffing ratings.Rankings are based only on facilities in Florida that report data for that category. Facilities without available data are excluded from the ranking.Click the rank badge to see the full State ranking.Click here to see the full State ranking.
Other operating costs Info Everything it costs to run the home apart from payroll — food, utilities, supplies, maintenance, contract labor and administration. Calculated as total operating expense minus payroll (staff salaries and wage-related benefits).
$6.7M
Total costs Info The home's total operating expense for the year — all the costs of running it, salaries included (CMS cost report, Worksheet G-3).
$15.4M

What does this home offer?

Housing options icon

Housing Options: 1 Bed / 2 Bed

Building type icon
Building type icon

Building Type: Single-story

Transportation services icon

Transportation Services

Fitness and recreation icon

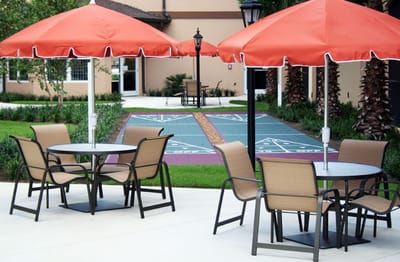
Fitness and Recreation

Who this home usually serves

TYPE OF STAY

Mostly long-term care residents

Most residents stay for extended periods and receive ongoing daily care.

Most new residents arrive under Medicaid (53% of admissions), and a typical Medicaid stay runs around 2 months.

Admissions
616 total

Coverage residents most often arrive under.

Medicare 38%
Private pay 9%
Medicaid 53%
Discharges
599 total

Coverage residents most often leave under.

Medicare 23%
Private pay 33%
Medicaid 44%

Activities in this home

Places of interest near Hawthorne Inn of Ocala

Address 15.5 miles from city center Info Estimated distance in miles from Ocala's city center to Hawthorne Inn of Ocala's address, calculated via Google Maps.

Calculate Travel Distance to Hawthorne Inn of Ocala

Add your location

Address

Compare Nursing Homes around Florida

The information below is reported by the Florida Agency for Health Care Administration (AHCA).

5 facilities compared · CMS & FL Dept. of Health data

Terracina Grand
NH
AL
IL
MC
RC
Naples
200
Facility 200
FL AVG 89
Rank #38 / 1074
90.0%
Facility 90.0%
FL AVG 84.3%
Rank #116 / 258
+7%
4.20
Facility 4.20
FL AVG 4.04
Rank #75 / 253
+66%+4%
$10.9k
Facility $10.9k
FL AVG $78.9k
Rank #181 / 258
76
Facility 76
FL AVG 83
Rank #641 / 876
4
Facility 4
FL AVG 19.7
Rank #10 / 252
2.0
Facility 2.0
FL AVG 4.5
Rank #16 / 252
-26A+
12
Facility 12
FL AVG 40
Rank #1224 / 1486
2012 Goodman Family Gst
$5.5M
Facility $5.5M
FL AVG $15.7M
Rank #247 / 257
$2.6M
Facility $2.6M
FL AVG $6.1M
Rank #232 / 257
46.1%
Facility 46.1%
FL AVG 39.8%
Rank #28 / 257
106129
Life Care Center at Inverrary
NH
Lauderhill (Inverrary)
120
Facility 120
FL AVG 89
Rank #256 / 1074
89.2%
Facility 89.2%
FL AVG 84.3%
Rank #134 / 258
+6%
4.08
Facility 4.08
FL AVG 4.04
Rank #91 / 253
+52%+1%
$0
Facility $0
FL AVG $78.9k
Rank #1 / 258
-
22
Facility 22
FL AVG 19.7
Rank #161 / 252
7.3
Facility 7.3
FL AVG 4.5
Rank #224 / 252
-108A+
12
Facility 12
FL AVG 40
Rank #1224 / 1486
Cody Brayton
$13.5M
Facility $13.5M
FL AVG $15.7M
Rank #104 / 257
$8.0M
Facility $8.0M
FL AVG $6.1M
Rank #121 / 257
59.5%
Facility 59.5%
FL AVG 39.8%
Rank #177 / 257
106047
Brookdale Palmer Ranch
NH
AL
IL
MC
Sarasota (Bee Ridge)
118
Facility 118
FL AVG 89
Rank #337 / 1074
61.6%
Facility 61.6%
FL AVG 84.3%
Rank #243 / 258
-27%
4.61
Facility 4.61
FL AVG 4.04
Rank #50 / 253
-23%+14%
$59.7k
Facility $59.7k
FL AVG $78.9k
Rank #222 / 258
79
Facility 79
FL AVG 83
Rank #589 / 876
24
Facility 24
FL AVG 19.7
Rank #172 / 252
4.8
Facility 4.8
FL AVG 4.5
Rank #158 / 252
645A+
3
Facility 3
FL AVG 40
Rank #1383 / 1486
Brea Emeritus LLC
$11.4M
Facility $11.4M
FL AVG $15.7M
Rank #222 / 257
$7.4M
Facility $7.4M
FL AVG $6.1M
Rank #148 / 257
65.3%
Facility 65.3%
FL AVG 39.8%
Rank #3 / 257
106022
The Oaks of Clearwater
NH
AL
IL
MC
Clearwater (Oak Bluffs)
175
Facility 175
FL AVG 89
Rank #84 / 1074
29.7%
Facility 29.7%
FL AVG 84.3%
Rank #253 / 258
-65%
4.55
Facility 4.55
FL AVG 4.04
Rank #50 / 253
-50%+13%
$0
Facility $0
FL AVG $78.9k
Rank #1 / 258
67
Facility 67
FL AVG 83
Rank #770 / 876
30
Facility 30
FL AVG 19.7
Rank #210 / 252
6.0
Facility 6.0
FL AVG 4.5
Rank #201 / 252
-46B-
64
Facility 64
FL AVG 40
Rank #291 / 1486
Oaks On The Bay LLC
$5.8M
Facility $5.8M
FL AVG $15.7M
Rank #46 / 257
$5.4M
Facility $5.4M
FL AVG $6.1M
Rank #185 / 257
93.7%
Facility 93.7%
FL AVG 39.8%
Rank #254 / 257
105323
Hawthorne Inn of Ocala
NH
AL
IL
MC
Ocala
44
Facility 44
FL AVG 89
Rank #798 / 1074
91.7%
Facility 91.7%
FL AVG 84.3%
Rank #90 / 258
+9%
3.83
Facility 3.83
FL AVG 4.04
Rank #145 / 253
-20%-5%
$157.7k
Facility $157.7k
FL AVG $78.9k
Rank #246 / 258
94
Facility 94
FL AVG 83
Rank #162 / 876
17
Facility 17
FL AVG 19.7
Rank #123 / 252
2.8
Facility 2.8
FL AVG 4.5
Rank #45 / 252
2112-
36
Facility 36
FL AVG 40
Rank #817 / 1486
Hawthorne Operations Holdings LLC
$13.8M
Facility $13.8M
FL AVG $15.7M
Rank #142 / 257
$8.7M
Facility $8.7M
FL AVG $6.1M
Rank #110 / 257
63%
Facility 63%
FL AVG 39.8%
Rank #75 / 257
105602

Financial Assistance for
Nursing Home in Florida

Hawthorne Inn of Ocala is located in Ocala, Florida.
Here are the financial assistance programs available to residents in Florida.

Get Financial aid guidance

Long-Term Care Waiver

Florida Medicaid LTC Waiver

Age 65+ or 21+ disabled
General Florida resident, Medicaid- eligible, nursing home-level care need.
Income Limits (2025) ~$2,829/month 300% FBR, individual
Asset Limits $2,000 (individual), $3,000 (couple).
FL

High demand; waitlists common.

Benefits
In-home care (6-8 hours/day) Assisted living Respite (240 hours/year) Case management

Community Care for the Elderly (CCE)

Florida CCE

Age 60+
General Florida resident, at risk of nursing home.
Income Limits ~$2,000/month varies
Asset Limits $5,000 individual
FL

Limited funding; regional variation.

Benefits
Homemaker services (3-5 hours/week) Adult day care (~$60/day) Respite (up to 10 days/year)

Home Care for the Elderly (HCE)

Florida Home Care for the Elderly

Age 60+
General Florida resident, at risk of nursing home placement; caregiver must be approved.
Income Limits (2025) ~$2,829/month individual, aligned with Medicaid thresholds
Asset Limits ~$2,000 (individual); varies by case manager discretion.
FL

Limited funding (~3,500 served annually); prioritizes low-income frail seniors.

Benefits
Basic subsidy (~$160/month) for housing/medical costs; special subsidies for supplies/services (e.g., incontinence supplies, ~$50-$200/month)

Program of All-Inclusive Care for the Elderly (PACE)

Florida Medicaid PACE

Age 55+
General Florida resident, nursing home-level care need, safe with PACE support.
Income Limits (2025) ~$2,829/month 300% FBR
Asset Limits $2,000 (individual), $3,000 (couple).
FL

Limited to specific counties (e.g., Hillsborough, Miami-Dade); ~10 sites statewide.

Benefits
Personal care (5-7 hours/day) Medical care Meals Transportation Therapy

Optional State Supplementation (OSS)

Florida Optional State Supplementation

Age 65+ or disabled
General Florida resident, living in approved facility, receiving SSI or low-income.
Income Limits (2025) ~$1,004/month individual, including SSI
Asset Limits $2,000 (individual), $3,000 (couple).
FL

Limited to specific facility types; ~$78.40/month max supplement.

Benefits
Cash payment (~$78.40/month) for room/board or personal needs in facilities

Frequently Asked Questions about Hawthorne Inn of Ocala

What languages are spoken at Hawthorne Inn of Ocala?

The team at Hawthorne Inn of Ocala speaks English and Spanish.

Who is the owner of Hawthorne Inn of Ocala?

The legal owner and operator of Hawthorne Inn of Ocala is Hawthorne Ocala Operations Llc.

Is Hawthorne Inn of Ocala in a walkable area?

Hawthorne Inn of Ocala has a walk score of 36. Somewhat walkable. A few nearby services may be reachable on foot, but most trips require transportation.

What is the license number of Hawthorne Inn of Ocala?

According to FL state health department records, Hawthorne Inn of Ocala's license number is 7129.

When does Hawthorne Inn of Ocala's license expire?

According to FL state health department records, Hawthorne Inn of Ocala's license expires on March 31, 2027.

What is the occupancy rate at Hawthorne Inn of Ocala?

Hawthorne Inn of Ocala's occupancy is 92%.

What payment types does Hawthorne Inn of Ocala accept?

Hawthorne Inn of Ocala accepts Medicaid.

Guides for Better Senior Living

Care Cost Calculator: See Prices in Your Area

Nursing Home Data Explorer

Don’t Wait Too Long: 7 Red Flag Signs Your Parent Needs Assisted Living Now

The True Cost of Assisted Living in 2025 – And How Families Are Paying For It

Understanding Senior Living Costs: Pricing Models, Discounts & Financial Assistance