Woodruff County Health Center
CMS overall rating Info CMS (the Centers for Medicare & Medicaid Services) is the federal agency that rates nursing home quality. Its Overall Rating runs from 1 to 5 stars, combining health inspections, staffing, and quality measures, with inspections weighted most heavily.

Woodruff County Health Center

CMS overall rating Info CMS (the Centers for Medicare & Medicaid Services) is the federal agency that rates nursing home quality. Its Overall Rating runs from 1 to 5 stars, combining health inspections, staffing, and quality measures, with inspections weighted most heavily.
Calculator: See prices in your area
Woodruff County Health Center accepts Medicare and private pay.

Overview of Woodruff County Health Center

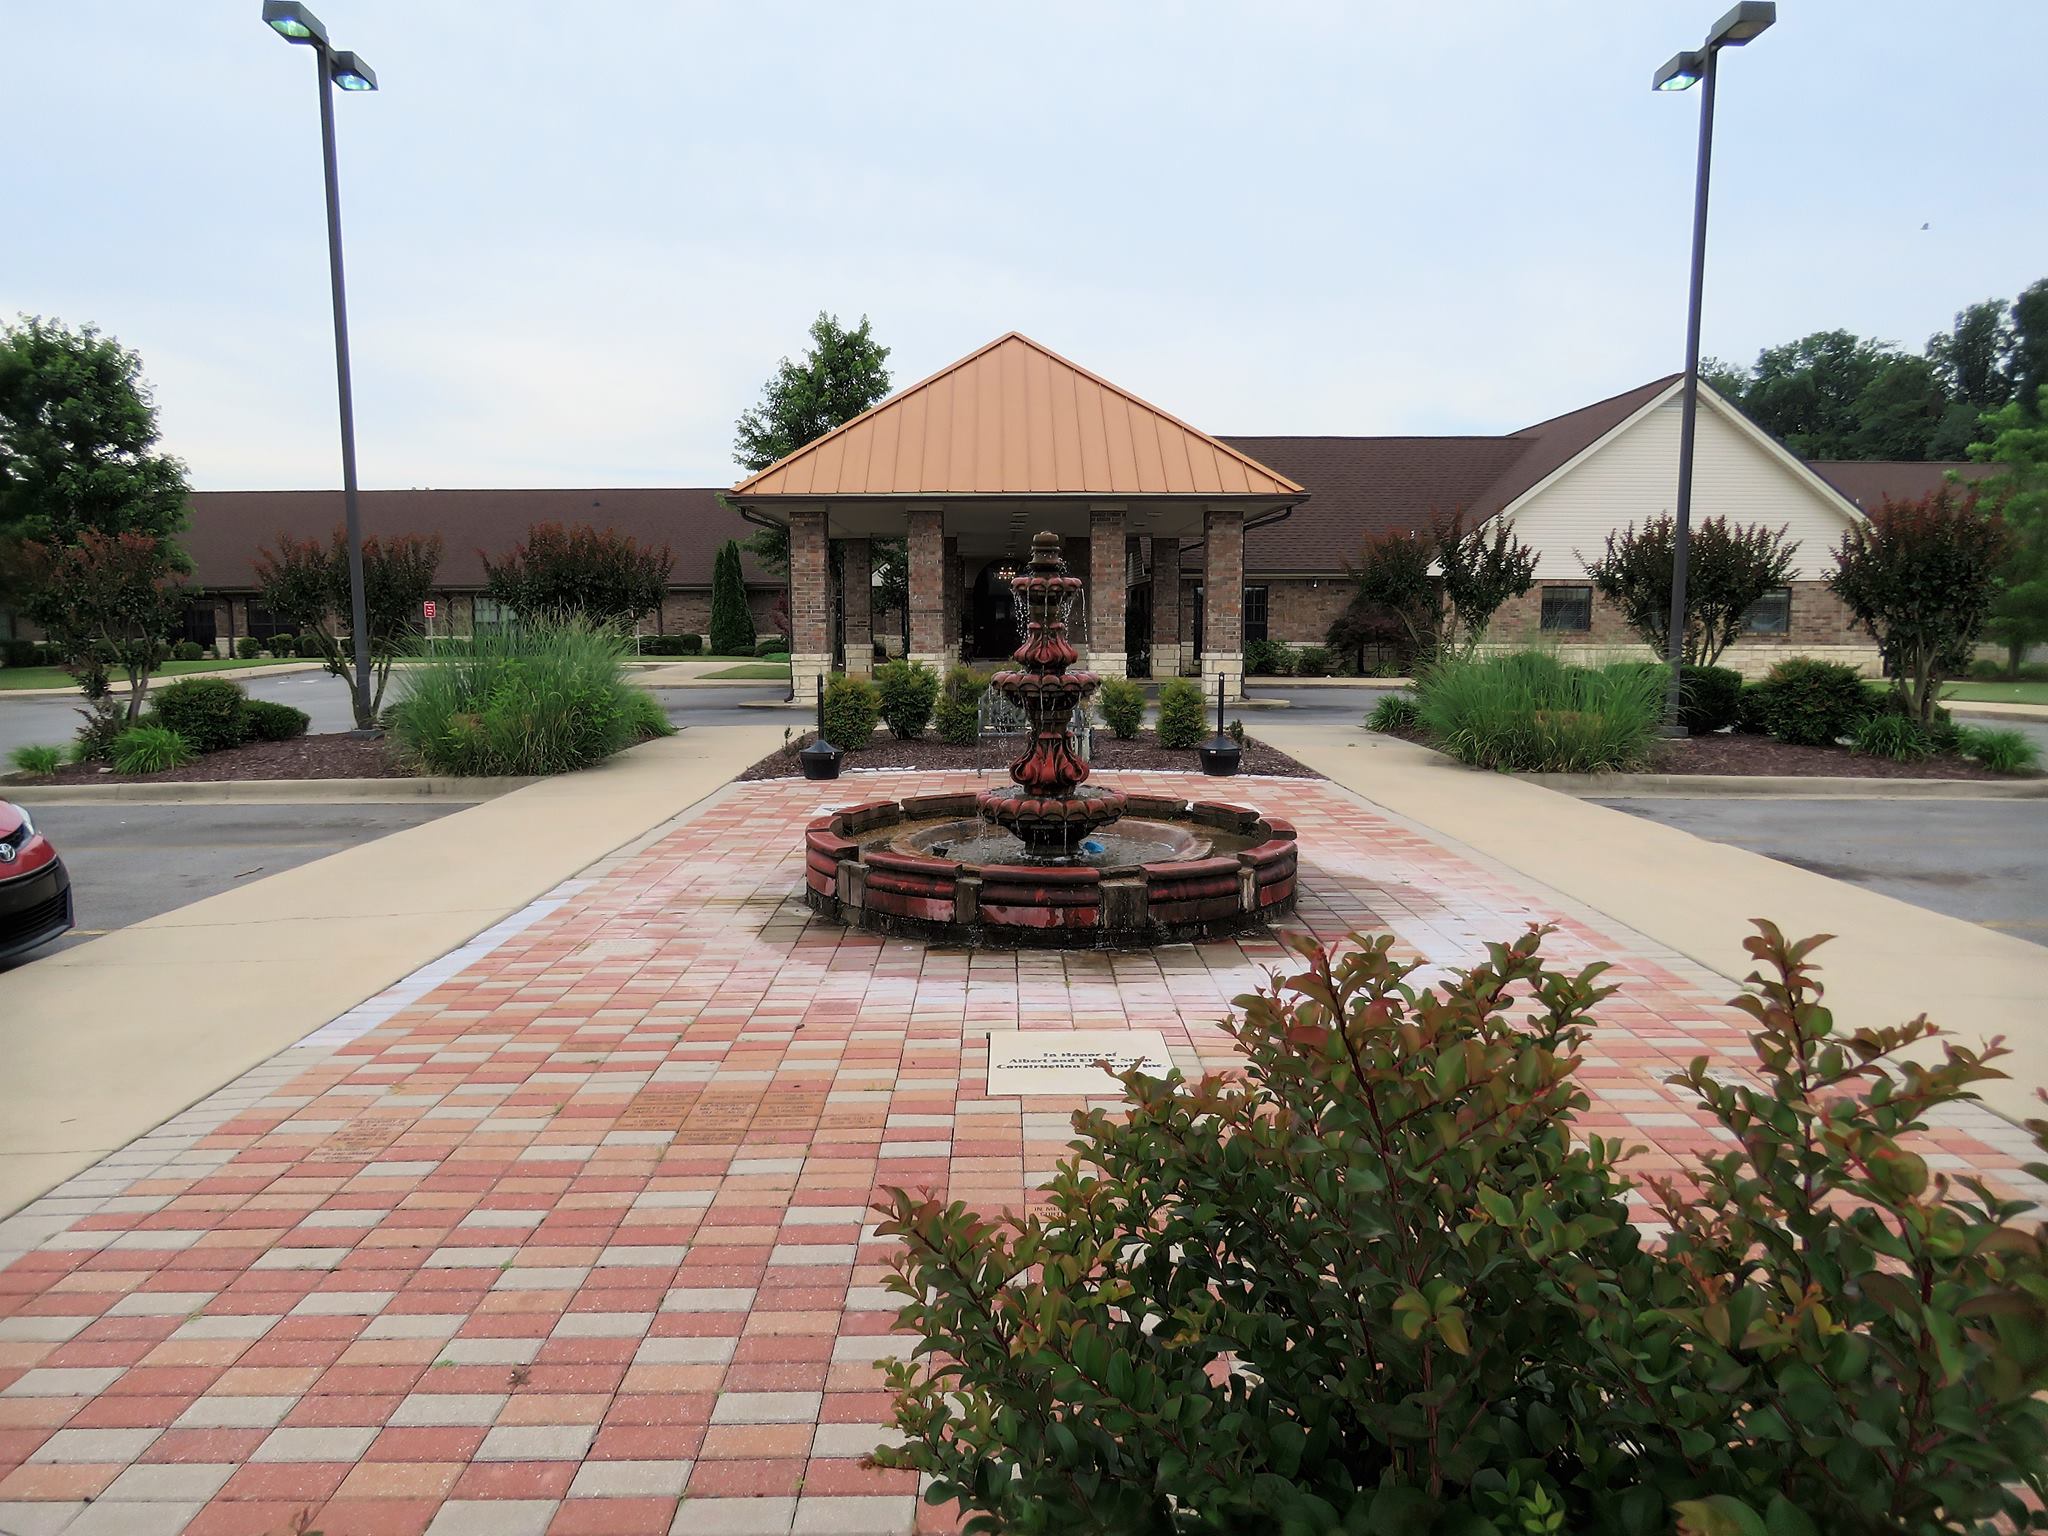
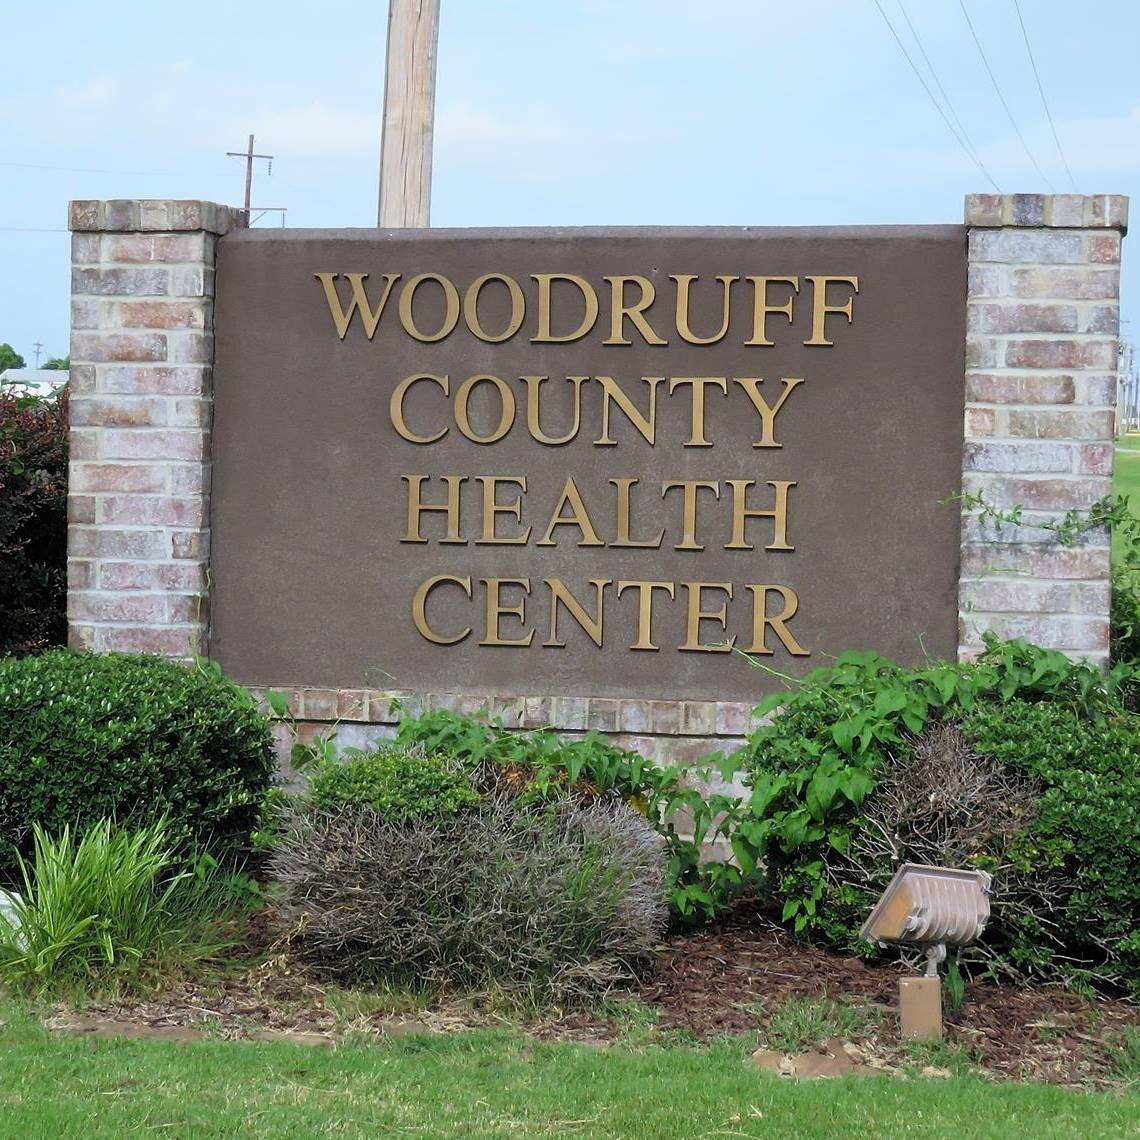
Find the care you need at Woodruff County Health Center, a distinguished community in McCrory, AR, offering long-term care and short-term rehabilitation. With a kind and highly skilled team available around the clock, residents receive high-quality care tailored to their personal needs. The community also participates in Medicare and Medicaid, striving to ease financial burdens.

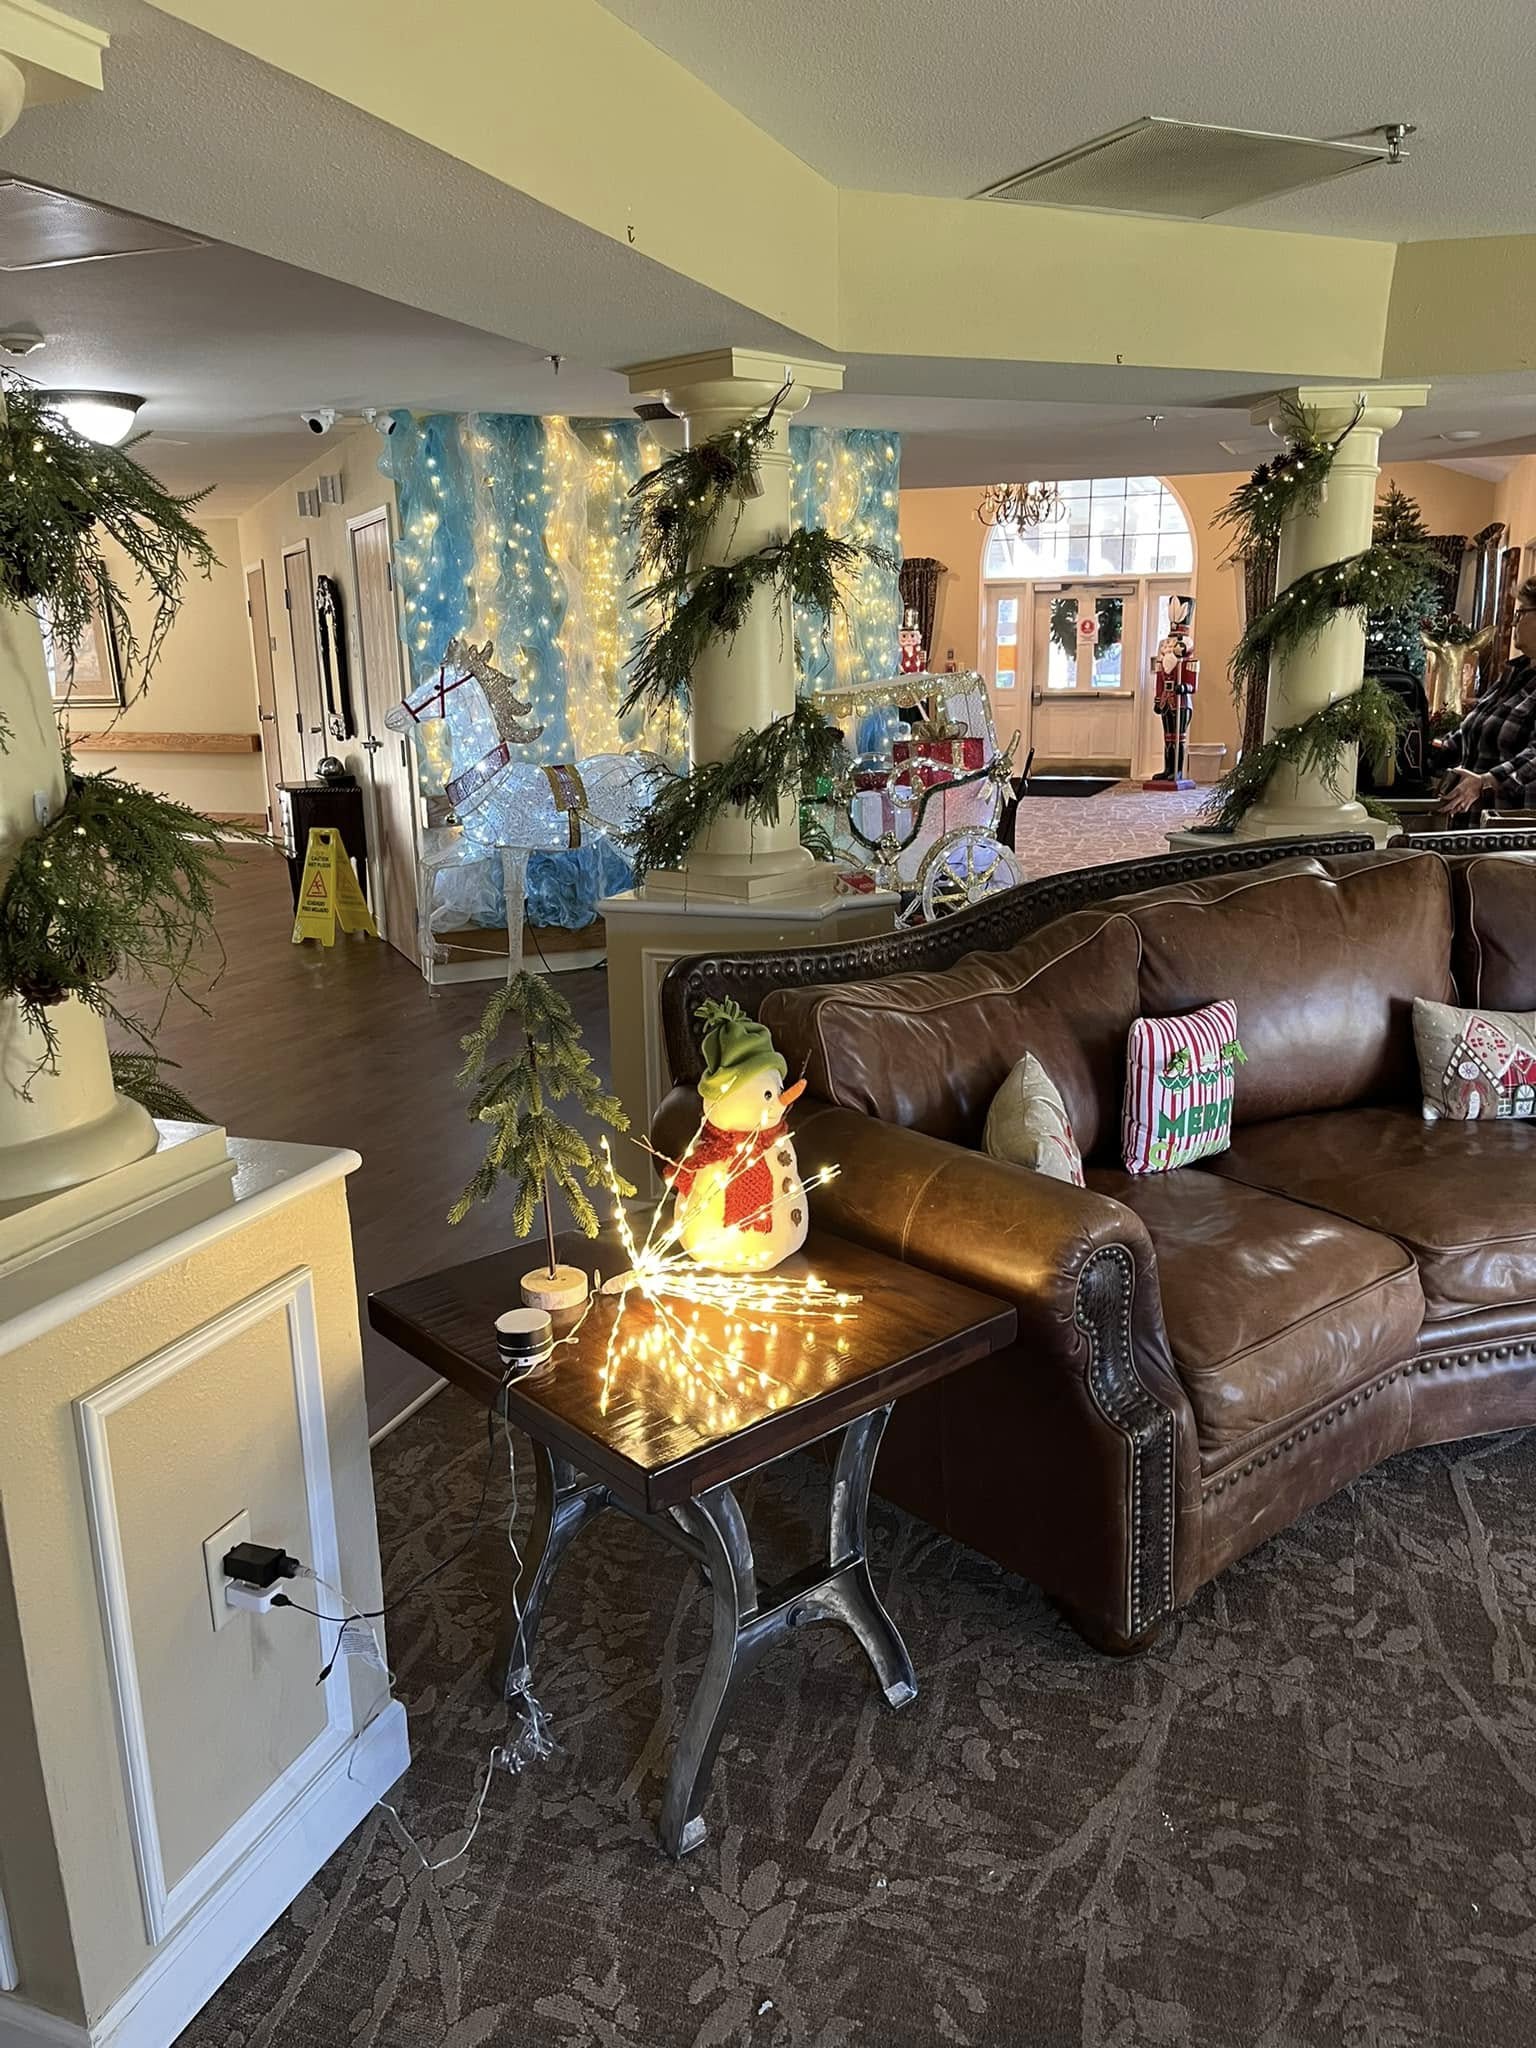
Aside from their healthcare needs, residents’ happiness and wellness are also taken care of, conducting a variety of engaging activities and enriching programs that highlight their interests and capabilities. Here, residents have a hassle-free dining experience with delicious and healthy dining options that cater to their dietary needs and preferences. With its comprehensive care and extensive amenities, residents are guaranteed the finest retirement experience.

Quality ratings

Measured by Centers for Medicare & Medicaid Services (CMS)

Overall rating Info The Overall CMS Rating combines results from health inspections, staffing levels and quality measures. Health inspections carry the most weight. Staffing and quality scores can increase or decrease the final rating based on performance compared to state and national standards.
Health Inspection Info Based on the results of the facility's three most recent standard inspections and any complaint investigations. CMS reviews the number, scope, and severity of deficiencies, with more recent findings weighted more heavily.
Staffing Info Measures average nursing staff hours per resident per day, including Registered Nurses (RNs) and total nursing staff. Ratings are adjusted based on the level of care residents require and are compared to state and national benchmarks.
Quality Measures Info Based on clinical and physical health indicators reported to CMS, such as hospital readmissions, falls, pressure ulcers, and improvements in mobility. These measures reflect how well residents' health needs are being managed.

Staffing hours breakdown

Info Daily nursing hours per resident by staff type, reported to CMS. Higher is generally better — compare this facility to state and national averages to see where staffing stands.

Hours per resident per day — compared to state averages

Total nursing care / resident Info Total adjusted nursing hours per resident per day, combining RN, LPN, and aide time. CMS adjusts this for case-mix so facilities can be fairly compared.
4h 55m per day
vs avg

2 of 6 metrics below state avg

Standout metric Weekend RN is +53% above state avg
Staff typeHours / Day / Residentvs state avg
Registered Nurse (RN) Info RNs hold the highest nursing license and can assess residents, interpret test results, and direct care plans. More RN hours per day often signals stronger clinical oversight and faster response to health changes. 30m per day ▲ 27% State avg: 24m per day · National avg: 41m per day
LPN / LVN Info Licensed Practical Nurses (LPNs) or Licensed Vocational Nurses (LVNs) deliver routine hands-on care — medication administration, wound dressing, and monitoring vital signs. They work under RN supervision and make up a large share of daily bedside care. 53m per day ▼ 8% State avg: 57m per day · National avg: 52m per day
Nurse Aide Info Certified Nurse Aides (CNAs) provide the most direct day-to-day assistance: bathing, dressing, feeding, and mobility. Nurse aide hours are typically the largest staffing category and directly affect residents' quality of life. 3h 9m per day ▲ 15% State avg: 2h 44m per day · National avg: 2h 21m per day
Weekend Total Nursing Info Combined nursing hours (RN + LPN + Nurse Aide) per resident per day on weekends. Staffing often drops on weekends — this figure reveals whether the facility maintains adequate coverage outside of weekday hours. 4h 14m per day ▲ 22% State avg: 3h 29m per day · National avg: 3h 26m per day
Physical Therapist Info Hours per resident per day provided by licensed Physical Therapists (PTs) or PT Assistants. PT services help residents recover mobility after injury or illness and are especially important for post-acute (short-stay) rehabilitation. 0m per day ▼ 100% State avg: 2m per day · National avg: 4m per day
Weekend RN Info Registered nurse hours specifically on weekends. Facilities sometimes reduce RN presence on Saturdays and Sundays — a low weekend RN figure compared to weekday hours can indicate reduced clinical oversight when most administrative staff are absent. 24m per day ▲ 53% State avg: 16m per day · National avg: 29m per day

Capacity and availability

Avg. Length of Stay Info Average number of days residents stay at this facility, based on CMS cost report data. Shorter stays often reflect post-acute or rehab care; longer stays reflect long-term care.
50 days
Bed community size
120-bed community Rank #59 / 330Bed count — State benchmarkedThis home is ranked 59th out of 330 homes in Arkansas. Shows this facility's certified or reported bed count compared to other Arkansas facilities. Larger communities may offer more amenities, programs, and on-site services for residents and families.Rankings are based only on facilities in Arkansas that report data for that category. Facilities without available data are excluded from the ranking.Click the rank badge to see the full State ranking.Click here to see the full State ranking.
A larger shared setting that may offer more common spaces and organized community services.
Walk Score
Walk Score: 22 / 100 Rank #281 / 419Walk Score — State benchmarkedThis home is ranked 281st out of 419 homes in Arkansas. Shows how walkable this facility's neighborhood is compared to the average Walk Score across Arkansas facilities. Higher scores benefit residents, families, and staff.Rankings are based only on facilities in Arkansas that report data for that category. Facilities without available data are excluded from the ranking.Click the rank badge to see the full State ranking.Click here to see the full State ranking.
Car-dependent. Most errands require a car, with limited nearby walkable options.

About this community

Occupancy

Occupancy rate
70%
Similar to the Arkansas average: 71.3%
Occupied beds
84 / 120
Average occupied beds in Arkansas homes 77 beds

License Details

Facility TypeSkilled Nursing Facility With Dual Certified Beds (medicaid / Medicare)
CountyWoodruff
Business TypeCounty Government
Certification TypeMedicaid / Medicare

Ownership & Operating Entity

Woodruff County Health Center is legally operated by County Government, and administered by Marilyn Files.

Type Of Units

Medicaid
105 units
Medicaid and Medicare
15 units
Total beds
120 units

Contact Information

Fax870-731-5027

Contact Woodruff County Health Center

Inspection History

In Arkansas, the Department of Human Services, Office of Long Term Care is authorized to conduct unannounced inspections and issue official quality of care reports for all senior living providers.

Since 2023 · 3 years of data 29 deficiencies

Inspection Scorecard Info This scorecard compares key inspection, deficiency, and complaint metrics at this facility against the Arkansas state average. Metrics rated ≥15% worse than average are highlighted in red; those ≥15% better are highlighted in green.

Since 2023 vs. Arkansas state average
Overall vs. AR average 2 Worse Metrics worse than Arkansas average:
• Total deficiencies (38% above)
• Deficiencies per year (39% above)
0 Better No metrics in this bucket.
Latest Inspection September 18, 2025 Complaint Investigation

Deficiencies Info Deficiencies are formal regulatory issues recorded during state inspections.

This FacilityAR Averagevs. AR Avg
Total deficiencies Info Formal regulatory issues recorded by inspectors across all inspection types. 2921 This facility has 38% more total deficiencies than a typical Arkansas assisted living residence (29 vs. AR avg 21).↑ 38% worse
Deficiencies per year Info Average deficiencies per year since 2023. 9.77 This facility has 39% more deficiencies per year than a typical Arkansas assisted living residence (9.7 vs. AR avg 7).↑ 39% worse

Inspection Reports Summary Info An editor-reviewed summary of the themes and findings across this facility's recent inspection reports.

  • September 18, 2025 inspection found 5 deficiencies including injury from unsafe mechanical lift transfers and repeated failure to follow Enhanced Barrier Precautions for infection control.
  • Multiple inspections in 2025 documented ongoing infection control lapses with staff not wearing proper PPE during medication administration and tracheostomy care despite training.
  • May 31, 2024 survey cited 9 deficiencies involving resident care failures such as inaccessible call lights, poor foot and nail care, unsafe chemical storage, and improper food consistency.

Health Inspection History

Inspections since 2021
Total health inspections 4

State average N/A


Last Health inspection on Sep 2025

Total health citations
23

State average N/A

Citations per inspection
5.75

State average N/A


Health citations are formal notices following inspections when they fail to comply with safety and care standards.

21 of 23 citations resulted from standard inspections; and 2 of 23 resulted from complaint investigations.

Breakdown of citation severity (last 5 years)
Critical health citations
0
In line with State average

State average: N/A


Serious health citations
1
In line with State average

State average: N/A

0 critical citations State average: N/A

1 serious citation State average: N/A

22 moderate citations State average: N/A

0 minor citations State average: N/A
Citations history (last 5 years)
Infection Control moderate citation Sep 18, 2025
Corrected

Quality of Care serious citation Sep 18, 2025
Corrected

Infection Control moderate citation May 31, 2024
Corrected

Nutrition moderate citation May 31, 2024
Corrected

Staffing Data

Reporting period: October 1 – December 31, 2025 (Q4 2025). Source: CMS Payroll-Based Journal report.

Total staff 139
Employees 139
Contractors 0
Staff to resident ratio 1.62 : 1
0% compared with State average

State average ratio: 0 : 0

Avg staff/day 49
Average shift 8.5 hours
0% compared with State average

State average: 0 hours

Total staff hours (quarter) 38,522

Nursing staff breakdown

Q4 2025 · Oct 1 – Dec 31 More info This data comes from the CMS Payroll-Based Journal report covering October 1 – December 31, 2025.
Registered Nurse

Manages medical care and health needs.

RN Staff Info All 17 RN Staff are full-time employees. No contractors work on this role. 17
Average shift length Info Average shift length. Calculated as total hours divided by days worked and average staff per day. 6.9 hours
Licensed Practical Nurse

Assists with medical care and medications.

LPN Staff Info All 22 LPN Staff are full-time employees. No contractors work on this role. 22
Average shift length Info Average shift length. Calculated as total hours divided by days worked and average staff per day. 8.6 hours
Certified Nursing Assistant

Helps with daily care and mobility.

CNA Staff Info All 75 CNA Staff are full-time employees. No contractors work on this role. 75
Average shift length Info Average shift length. Calculated as total hours divided by days worked and average staff per day. 8.9 hours

Contractor staffing

Q4 2025 · Oct 1 – Dec 31 More info This data comes from the CMS Payroll-Based Journal report covering October 1 – December 31, 2025.
Total hours from contractors 0% — all staff are direct employees this quarter

Staff by category

Q4 2025 · Oct 1 – Dec 31 More info This data comes from the CMS Payroll-Based Journal report covering October 1 – December 31, 2025.
Certified Nursing Assistant7507524,59692100%8.9
Licensed Practical Nurse220226,36392100%8.6
Registered Nurse170172,45492100%6.9
Clinical Nurse Specialist2021,0577076%8.8
Therapeutic Recreation Specialist7075966571%7.6
Occupational Therapy Aide2025696874%8.1
Dietitian2025035762%8.2
RN Director of Nursing1014815964%8.1
Other Dietary Services Staff1014716065%7.9
Mental Health Service Worker1014645661%8.3
Nurse Practitioner1014495762%7.9
Administrator1014315358%8.1
Other Physician505594650%1.1
Occupational Therapy Assistant1012444%6
Feeding Assistant101555%1
75 Certified Nursing Assistant
% of Days 100%
22 Licensed Practical Nurse
% of Days 100%
17 Registered Nurse
% of Days 100%
2 Clinical Nurse Specialist
% of Days 76%
7 Therapeutic Recreation Specialist
% of Days 71%
2 Occupational Therapy Aide
% of Days 74%
2 Dietitian
% of Days 62%
1 RN Director of Nursing
% of Days 64%
1 Other Dietary Services Staff
% of Days 65%
1 Mental Health Service Worker
% of Days 61%
1 Nurse Practitioner
% of Days 62%
1 Administrator
% of Days 58%
5 Other Physician
% of Days 50%
1 Occupational Therapy Assistant
% of Days 4%
1 Feeding Assistant
% of Days 5%

Penalties and fines

Includes penalties issued in 2025

Federal penalties imposed by CMS for regulatory violations, including civil money penalties (fines) and denials of payment for new Medicare/Medicaid admissions.

Source: CMS Penalties Database (Data as of Jan 2026)

Total fines amount $13K
50% lower than State average

State average: $26K

Number of fines 1
32% fewer fines than State average

State average: 1.5

Payment Denials Info Serious action where Medicare and/or Medicaid temporarily stops payments for new residents until issues are fixed. 0
100% fewer payment denials than State average

State average: 0.2

Fines amount comparison
This facility $13K
State average $26K
Penalty History

Penalties are imposed by CMS for violations of federal nursing home regulations.

1 penalty in the past 3 years

Sep 18, 2025 · $13K

Civil Money Penalty Info Fines imposed for noncompliance, which can be assessed per day or per instance of violation. Sep 18, 2025
$13K

Last updated: Jan 2026

Quality of care over time

These measures show how residents usually do over time at this home, based on health outcomes and preventive care.

High-risk clinical events score Info A composite score based on pressure ulcers, falls with injury, weight loss, walking ability decline, and activities of daily living decline. 13.3
73% worse than State average

State average: 7.7

Functional decline score Info A composite score based on activities of daily living decline, walking ability decline, and incontinence. 22.6
70% worse than State average

State average: 13.3

Long-stay resident measures
Significantly below average State avg: 4.2 Info CMS star rating based on long-stay quality measure performance. 5 stars = significantly above average, 1 star = significantly below average.
Need for Help with Daily Activities Increased Info Percent of long-stay residents whose need for help with daily activities has increased 23.3%
102% worse than State average

State average: 11.5%

Walking Ability Worsened Info Percent of long-stay residents whose ability to move independently worsened 21.1%
58% worse than State average

State average: 13.4%

Low Risk Residents with Bowel/Bladder Incontinence Info Percent of low risk long-stay residents who lose control of their bowels or bladder 23.5%
55% worse than State average

State average: 15.1%

Falls with Major Injury Info Percent of long-stay residents experiencing one or more falls with major injury 6.3%
59% worse than State average

State average: 3.9%

High Risk Residents with Pressure Ulcers Info Percent of long-stay high risk residents with pressure ulcers 5.9%
25% worse than State average

State average: 4.7%

Urinary Tract Infection Info Percent of long-stay residents with a urinary tract infection 4.5%
246% worse than State average

State average: 1.3%

Lost Too Much Weight Info Percent of long-stay residents who lose too much weight 10.0%
100% worse than State average

State average: 5.0%

Depressive Symptoms Info Percent of long-stay residents who have depressive symptoms 0.3%
78% better than State average

State average: 1.5%

Antipsychotic Use Info Percent of long-stay residents who received an antipsychotic medication 11.5%
10% worse than State average

State average: 10.5%

Pneumococcal Vaccine Info Percent of long-stay residents assessed and appropriately given the pneumococcal vaccine 99.7%
6% better than State average

State average: 94.4%

Influenza Vaccine Info Percent of long-stay residents assessed and appropriately given the seasonal influenza vaccine 100.0%
In line with State average

State average: 96.2%

Hospitalizations per 1,000 days Info Number of hospitalizations per 1,000 long-stay resident days. 4.73
140% worse than State average

State average: 1.97

ED visits per 1,000 days Info Number of outpatient emergency department visits per 1,000 long-stay resident days. 2.47
13% worse than State average

State average: 2.18

Short-stay resident measures
Average State avg: 2.7 Info CMS star rating based on short-stay quality measure performance. 5 stars = much above average, 1 star = much below average.
Pneumococcal Vaccine Info Percent of short-stay residents assessed and appropriately given the pneumococcal vaccine 93.1%
15% better than State average

State average: 80.9%

Antipsychotic medication increase Info Percent of short-stay residents who newly received an antipsychotic medication 1.5%
In line with State average

State average: 1.5%

Influenza Vaccine Info Percent of short-stay residents assessed and appropriately given the seasonal influenza vaccine 88.9%
14% better than State average

State average: 77.7%

Re-hospitalized after SNF stay Info Percentage of short-stay residents who were re-hospitalized after their nursing home admission. 25.7%
In line with State average

State average: 25.2%

Emergency department visits Info Percentage of short-stay residents who had an outpatient emergency department visit. 5.9%
57% better than State average

State average: 13.8%

Falls with major injury Info Percentage of SNF residents who experience falls with major injury during their stay. 0.0%
100% better than State average

State average: 0.8%

Ability to care for self at discharge Info Percentage of residents at or above expected ability to care for themselves at discharge. 40.0%
25% worse than State average

State average: 53.7%

Successful return to home or community Info Rate of successful return to home or community from a skilled nursing facility. 48.4%
In line with State average

State average: 50.6%

Breakdown by payment type

Medicare

48% of new residents, usually for short-term rehab.

Typical stay 1 - 2 months

Private pay

52% of new residents, often for short stays.

Typical stay 1 - 2 years

Facility Characteristics

Source: CMS Long-Term Care Facility Characteristics (Data as of Jan 2026)

Total residents 86
Medicare
3
3.5% of residents
Medicaid
75
87.2% of residents
Private pay or other
8
9.3% of residents
Programs & Services
Residents Group

Residents meet regularly to discuss policies, care quality, and activities

Active Resident Council

Organized group of residents that meets regularly to discuss facility policies, quality of life, and activities.

Finances and operations

Based on CMS SNF Cost Report for fiscal year ending in 06/2024.

Government
Operated by federal authorities.
Net patient revenue Info Net patient revenue — what the home actually collects for resident care, after contractual allowances, bad debt and discounts are subtracted from its gross charges (CMS cost report, Worksheet G-3). It covers resident care only; money the home earns from other sources is shown separately as "Other income."
$10.9M
Net patient income Info Net patient income: net patient revenue minus the home's total operating expenses. A positive figure means it earns more from resident care than it spends to deliver it; a negative figure means the opposite. It excludes non-operating "other income."
$1.6M
Government Operated by federal authorities.
Net patient revenue Info Net patient revenue — what the home actually collects for resident care, after contractual allowances, bad debt and discounts are subtracted from its gross charges (CMS cost report, Worksheet G-3). It covers resident care only; money the home earns from other sources is shown separately as "Other income."
$10.9M
Net patient income Info Net patient income: net patient revenue minus the home's total operating expenses. A positive figure means it earns more from resident care than it spends to deliver it; a negative figure means the opposite. It excludes non-operating "other income."
$1.6M
Other income Info Money the home earns outside of resident care — such as investments, grants, rentals and other non-operating sources (CMS cost report, Worksheet G-3). It is tracked separately from net patient revenue: it is not part of that figure, and it is not included in net patient income.
$101.5K
Payroll costs Info Staff salaries plus wage-related costs — benefits such as payroll taxes, health insurance and retirement — from the home's own accounting records (CMS cost report, Worksheet A). Contract or agency labor is counted separately, under other operating costs.
$3.6M 33.3% of net patient revenue Info Payroll as a share of revenue: staff salaries and wage-related benefits divided by net patient revenue. A higher figure means more of each revenue dollar goes to staff pay.
Other operating costs Info Everything it costs to run the home apart from payroll — food, utilities, supplies, maintenance, contract labor and administration. Calculated as total operating expense minus payroll (staff salaries and wage-related benefits).
$5.7M
Total costs Info The home's total operating expense for the year — all the costs of running it, salaries included (CMS cost report, Worksheet G-3).
$9.3M

What does this home offer?

Building type icon
Building type icon

Building Type: Single-story

Housekeeping icon
Housekeeping icon

Housekeeping Services

Social and recreational activities icon

Social and Recreational Activities

Who this home usually serves

TYPE OF STAY

Mix of rehab and long-term care

This home supports both short-term rehab and long-term care, with residents staying for a wide range of durations.

Most new residents arrive under private pay (52% of admissions), and a typical private pay stay runs around 1 - 2 years.

Admissions
96 total

Coverage residents most often arrive under.

Medicare 48%
Private pay 52%
Discharges
96 total

Coverage residents most often leave under.

Medicare 48%
Private pay 52%

Places of interest near Woodruff County Health Center

Address 1.1 miles from city center Info Estimated distance in miles from Mccrory's city center to Woodruff County Health Center's address, calculated via Google Maps.

Calculate Travel Distance to Woodruff County Health Center

Add your location

Address

Compare Nursing Homes around the area

The information below is reported by the Arkansas Department of Human Services, Office of Long Term Care.

Indian Rock Village
NH
Fairfield Bay -55 - 11 Studio / 1 Bed / 2 Bed
Legacy Heights Nursing Home
NH
RC
SNF
Russellville (West 12Th Street) -107 A+ 24 -
Arkansas State Veterans Home
NH
AL
IL
MC
North Little Rock (North Oaks) -96 - 16 -
Wood-Lawn Heights
NH
AL
IL
PC
SNF
Batesville (College Heights Addition) -159 - 34 -
Woodruff County Health Center
NH
Mccrory -120 - 22 -

Frequently Asked Questions about Woodruff County Health Center

Who is the owner of Woodruff County Health Center?

Woodruff County Health Center is legally operated by County Government, and administered by Marilyn Files.

Is Woodruff County Health Center in a walkable area?

Woodruff County Health Center has a walk score of 22. Car-dependent. Most errands require a car, with limited nearby walkable options.

What is the occupancy rate at Woodruff County Health Center?

Woodruff County Health Center's occupancy is 70%.

Is Woodruff County Health Center a government-operated facility?

Woodruff County Health Center is a government-operated nursing facility in AR.

Who is the administrator of Woodruff County Health Center?

Marilyn Files is the administrator of Woodruff County Health Center.

How many beds does Woodruff County Health Center have?

Woodruff County Health Center has 120 beds.

Are there photos of Woodruff County Health Center?

Yes — there are 4 photos of Woodruff County Health Center in the photo gallery on this page.

Guides for Better Senior Living

Care Cost Calculator: See Prices in Your Area

Nursing Home Data Explorer

Don’t Wait Too Long: 7 Red Flag Signs Your Parent Needs Assisted Living Now

The True Cost of Assisted Living in 2025 – And How Families Are Paying For It

Understanding Senior Living Costs: Pricing Models, Discounts & Financial Assistance