Lamar Estates, LLC
CMS overall rating Info CMS (the Centers for Medicare & Medicaid Services) is the federal agency that rates nursing home quality. Its Overall Rating runs from 1 to 5 stars, combining health inspections, staffing, and quality measures, with inspections weighted most heavily.

Lamar Estates, LLC

CMS overall rating Info CMS (the Centers for Medicare & Medicaid Services) is the federal agency that rates nursing home quality. Its Overall Rating runs from 1 to 5 stars, combining health inspections, staffing, and quality measures, with inspections weighted most heavily.
Calculator: See prices in your area
Lamar Estates, LLC accepts Medicare, Medicaid, and private pay.

Overview of Lamar Estates, LLC

Find the care you need at Lamar Estates LLC, an outstanding community in Lamar, CO, offering skilled nursing. With a kind and well-trained team available around the clock, residents receive the highest quality of care tailored to their unique needs. Social services are also provided for residents’ convenience, ensuring they find reliable resources and optimize them.

Aside from their healthcare needs, a variety of fun recreational activities are conducted for residents’ leisure and wellness. Healthy meals are important for residents’ well-being, so delicious and well-balanced dining options are provided to meet their dietary needs and preferences. Therapy services and rehabilitation are also provided to enhance residents’ living experiences. The community is a great option for those needing a higher level of care, especially with its top-notch services and state-of-the-art amenities.

Quality ratings

Measured by Centers for Medicare & Medicaid Services (CMS)

Overall rating Info The Overall CMS Rating combines results from health inspections, staffing levels and quality measures. Health inspections carry the most weight. Staffing and quality scores can increase or decrease the final rating based on performance compared to state and national standards.
Health Inspection Info Based on the results of the facility's three most recent standard inspections and any complaint investigations. CMS reviews the number, scope, and severity of deficiencies, with more recent findings weighted more heavily.
Staffing Info Measures average nursing staff hours per resident per day, including Registered Nurses (RNs) and total nursing staff. Ratings are adjusted based on the level of care residents require and are compared to state and national benchmarks.
Quality Measures Info Based on clinical and physical health indicators reported to CMS, such as hospital readmissions, falls, pressure ulcers, and improvements in mobility. These measures reflect how well residents' health needs are being managed.

Staffing hours breakdown

Info Daily nursing hours per resident by staff type, reported to CMS. Higher is generally better — compare this facility to state and national averages to see where staffing stands.

Hours per resident per day — compared to state averages

Total nursing care / resident Info Total adjusted nursing hours per resident per day, combining RN, LPN, and aide time. CMS adjusts this for case-mix so facilities can be fairly compared.
4h 17m per day
Rank #45 / 215Nurse hours — State benchmarkedThis home is ranked 45th out of 215 homes in Colorado. Shows adjusted nurse hours per resident per day benchmarked to the Colorado average, with a ranking across 215 Colorado facilities. More hours mean more direct care. The national average is about 3.5 hrs; below 3.0 is a red flag.Rankings are based only on facilities in Colorado that report data for that category. Facilities without available data are excluded from the ranking.Click the rank badge to see the full State ranking.Click here to see the full State ranking.
vs avg

4 of 6 metrics below state avg

Staff typeHours / Day / Residentvs state avg
Registered Nurse (RN) Info RNs hold the highest nursing license and can assess residents, interpret test results, and direct care plans. More RN hours per day often signals stronger clinical oversight and faster response to health changes. 35m per day ▼ 30% State avg: 50m per day · National avg: 41m per day
LPN / LVN Info Licensed Practical Nurses (LPNs) or Licensed Vocational Nurses (LVNs) deliver routine hands-on care — medication administration, wound dressing, and monitoring vital signs. They work under RN supervision and make up a large share of daily bedside care. 17m per day ▼ 59% State avg: 41m per day · National avg: 52m per day
Nurse Aide Info Certified Nurse Aides (CNAs) provide the most direct day-to-day assistance: bathing, dressing, feeding, and mobility. Nurse aide hours are typically the largest staffing category and directly affect residents' quality of life. 2h 10m per day ■ Avg State avg: 2h 13m per day · National avg: 2h 21m per day
Weekend Total Nursing Info Combined nursing hours (RN + LPN + Nurse Aide) per resident per day on weekends. Staffing often drops on weekends — this figure reveals whether the facility maintains adequate coverage outside of weekday hours. 3h 19m per day ■ Avg State avg: 3h 17m per day · National avg: 3h 26m per day
Physical Therapist Info Hours per resident per day provided by licensed Physical Therapists (PTs) or PT Assistants. PT services help residents recover mobility after injury or illness and are especially important for post-acute (short-stay) rehabilitation. 2m per day ▼ 60% State avg: 5m per day · National avg: 4m per day
Weekend RN Info Registered nurse hours specifically on weekends. Facilities sometimes reduce RN presence on Saturdays and Sundays — a low weekend RN figure compared to weekday hours can indicate reduced clinical oversight when most administrative staff are absent. 28m per day ▼ 22% State avg: 36m per day · National avg: 29m per day

Capacity and availability

This home usually has availability

Lower occupancy than the state average
Occupancy rate
32.4% Rank #204 / 221Occupancy rate — State benchmarkedThis home is ranked 204th out of 221 homes in Colorado. Shows this facility's occupancy rate versus the Colorado average, with its Statewide rank out of 221. Higher occupancy signals strong local demand and financial stability.Rankings are based only on facilities in Colorado that report data for that category. Facilities without available data are excluded from the ranking.Click the rank badge to see the full State ranking.Click here to see the full State ranking.
Avg. Length of Stay
322 days
Bed community size
60-bed community Rank #303 / 533Bed count — State benchmarkedThis home is ranked 303rd out of 533 homes in Colorado. Shows this facility's certified or reported bed count compared to other Colorado facilities. Larger communities may offer more amenities, programs, and on-site services for residents and families.Rankings are based only on facilities in Colorado that report data for that category. Facilities without available data are excluded from the ranking.Click the rank badge to see the full State ranking.Click here to see the full State ranking.
A moderately sized community that may balance personal attention with shared amenities and social activities.
Years in operation
11 years in operation
A community with a solid operating history and experience delivering ongoing care.
Walk Score
Walk Score: 55 / 100 Rank #419 / 872Walk Score — State benchmarkedThis home is ranked 419th out of 872 homes in Colorado. Shows how walkable this facility's neighborhood is compared to the average Walk Score across Colorado facilities. Higher scores benefit residents, families, and staff.Rankings are based only on facilities in Colorado that report data for that category. Facilities without available data are excluded from the ranking.Click the rank badge to see the full State ranking.Click here to see the full State ranking.
Moderately walkable. Some errands can be accomplished on foot, with a mix of nearby amenities.
BBB Rating
BBB Rating: A+ (Not Accredited)
An independent rating from the Better Business Bureau based on factors such as complaint history, transparency, and business practices.
How BBB ratings work

About this community

License Details

CMS Certification Number65294

Staffing

Key information about the people who lead and staff this community.

Leadership

ContactMr. Manager

Contact Lamar Estates, LLC

Inspection History

In Colorado, the Department of Public Health and Environment, Health Facilities Division is the regulatory body that performs unannounced surveys and publishes facility inspection findings.

Since 2021 · 5 years of data 30 deficiencies

Inspection Scorecard Info This scorecard compares key inspection, deficiency, and complaint metrics at this facility against the Colorado state average. Metrics rated ≥15% worse than average are highlighted in red; those ≥15% better are highlighted in green.

Since 2021 vs. Colorado state average
Overall vs. CO average 0 Worse No metrics in this bucket. 2 At Avg Metrics at Colorado average:
• Total deficiencies (at CO avg)
• Deficiencies per year (at CO avg)
0 Better No metrics in this bucket.
Latest Inspection September 27, 2023 Annual Inspection

Deficiencies Info Deficiencies are formal regulatory issues recorded during state inspections.

This FacilityCO Averagevs. CO Avg
Total deficiencies Info Formal regulatory issues recorded by inspectors across all inspection types. 3030 This facility has total deficiencies in line with the Colorado average (30 vs. CO avg 30).— At avg
Deficiencies per year Info Average deficiencies per year since 2021. 66 This facility has deficiencies per year in line with the Colorado average (6 vs. CO avg 6).— At avg

Inspection Reports Summary Info An editor-reviewed summary of the themes and findings across this facility's recent inspection reports.

  • June 29, 2022 complaint investigation found 7 deficiencies including failure to prevent resident-to-resident physical abuse and inadequate dementia and respiratory care.
  • April 20, 2021 inspection cited 6 deficiencies covering oxygen therapy errors, lack of full-time director of nursing, and poor dementia and medication management.
  • September 27, 2023 annual inspection identified 2 deficiencies related to incomplete care plans and unclear physician orders, with no complaints or immediate jeopardy.

Health Inspection History

Inspections since 2021
Total health inspections 3

State average N/A


Last Health inspection on Sep 2023

Total health citations
15 Rank #49 / 221Health citations — State benchmarkedThis home is ranked 49th out of 221 homes in Colorado. Shows this facility's total health deficiency citations benchmarked to the Colorado State average, with a ranking across all 221 CO facilities. Lower citation counts earn a better rank.Rankings are based only on facilities in Colorado that report data for that category. Facilities without available data are excluded from the ranking.Click the rank badge to see the full State ranking.Click here to see the full State ranking.

State average N/A

Citations per inspection
5 Rank #108 / 221Citations per inspection — State benchmarkedThis home is ranked 108th out of 221 homes in Colorado. Shows average deficiency citations per CMS inspection for this facility versus the Colorado mean across 221 facilities with citation data. Lower is better.Rankings are based only on facilities in Colorado that report data for that category. Facilities without available data are excluded from the ranking.Click the rank badge to see the full State ranking.Click here to see the full State ranking.

State average N/A


Health citations are formal notices following inspections when they fail to comply with safety and care standards.

All 15 citations resulted from standard inspections.

Breakdown of citation severity (last 5 years)
Critical health citations
0
In line with State average

State average: N/A


Serious health citations
0
In line with State average

State average: N/A

0 critical citations State average: N/A

0 serious citations State average: N/A

15 moderate citations State average: N/A

0 minor citations State average: N/A
Citations history (last 5 years)
Care Planning moderate citation Sep 27, 2023
Corrected

Care Planning moderate citation Sep 27, 2023
Corrected

Abuse/Neglect moderate citation Jun 29, 2022
Corrected

Infection Control moderate citation Jun 29, 2022
Corrected

Staffing Data

Reporting period: July 1 – September 30, 2025 (Q3 2025). Source: CMS Payroll-Based Journal report.

Total staff 28
Employees 28
Contractors 0
Staff to resident ratio 1.40 : 1
0% compared with State average

State average ratio: 0 : 0

Avg staff/day 12
Average shift 6.7 hours
0% compared with State average

State average: 0 hours

Total staff hours (quarter) 7,408

Nursing staff breakdown

Q3 2025 · Jul 1 – Sep 30 More info This data comes from the CMS Payroll-Based Journal report covering July 1 – September 30, 2025.
Registered Nurse

Manages medical care and health needs.

RN Staff Info All 5 RN Staff are full-time employees. No contractors work on this role. 5
Average shift length Info Average shift length. Calculated as total hours divided by days worked and average staff per day. 7.3 hours
Licensed Practical Nurse

Assists with medical care and medications.

LPN Staff Info All 2 LPN Staff are full-time employees. No contractors work on this role. 2
Average shift length Info Average shift length. Calculated as total hours divided by days worked and average staff per day. 8.8 hours
Certified Nursing Assistant

Helps with daily care and mobility.

CNA Staff Info All 14 CNA Staff are full-time employees. No contractors work on this role. 14
Average shift length Info Average shift length. Calculated as total hours divided by days worked and average staff per day. 7.5 hours

Contractor staffing

Q3 2025 · Jul 1 – Sep 30 More info This data comes from the CMS Payroll-Based Journal report covering July 1 – September 30, 2025.
Total hours from contractors 0% — all staff are direct employees this quarter

Staff by category

Q3 2025 · Jul 1 – Sep 30 More info This data comes from the CMS Payroll-Based Journal report covering July 1 – September 30, 2025.
Certified Nursing Assistant140144,76592100%7.5
Registered Nurse5051,1018997%7.3
Licensed Practical Nurse2026326368%8.8
Other Dietary Services Staff1014165560%7.6
Clinical Nurse Specialist1011692628%6.5
Physical Therapy Aide101814650%1.8
Speech Language Pathologist101792830%2.8
Respiratory Therapy Technician101673235%2.1
Physical Therapy Assistant101562325%2.4
Qualified Social Worker101432224%2
14 Certified Nursing Assistant
% of Days 100%
5 Registered Nurse
% of Days 97%
2 Licensed Practical Nurse
% of Days 68%
1 Other Dietary Services Staff
% of Days 60%
1 Clinical Nurse Specialist
% of Days 28%
1 Physical Therapy Aide
% of Days 50%
1 Speech Language Pathologist
% of Days 30%
1 Respiratory Therapy Technician
% of Days 35%
1 Physical Therapy Assistant
% of Days 25%
1 Qualified Social Worker
% of Days 24%

Penalties and fines

Federal penalties imposed by CMS for regulatory violations, including civil money penalties (fines) and denials of payment for new Medicare/Medicaid admissions.

Source: CMS Penalties Database

No penalties in the past 3 years

No civil money penalties or payment denials were reported in the last 3 years.

Quality of care over time

These measures show how residents usually do over time at this home, based on health outcomes and preventive care.

High-risk clinical events score Info A composite score based on pressure ulcers, falls with injury, weight loss, walking ability decline, and activities of daily living decline. 8.9
In line with State average

State average: 9.0

Functional decline score Info A composite score based on activities of daily living decline, walking ability decline, and incontinence. 17.4
7% better than State average

State average: 18.8

Long-stay resident measures
Significantly below average State avg: 3.9 Info CMS star rating based on long-stay quality measure performance. 5 stars = significantly above average, 1 star = significantly below average.
Need for Help with Daily Activities Increased Info Percent of long-stay residents whose need for help with daily activities has increased 14.5%
9% better than State average

State average: 16.0%

Walking Ability Worsened Info Percent of long-stay residents whose ability to move independently worsened 18.7%
10% worse than State average

State average: 17.0%

Low Risk Residents with Bowel/Bladder Incontinence Info Percent of low risk long-stay residents who lose control of their bowels or bladder 19.1%
18% better than State average

State average: 23.2%

Falls with Major Injury Info Percent of long-stay residents experiencing one or more falls with major injury 1.3%
62% better than State average

State average: 3.3%

High Risk Residents with Pressure Ulcers Info Percent of long-stay high risk residents with pressure ulcers 8.3%
114% worse than State average

State average: 3.9%

Urinary Tract Infection Info Percent of long-stay residents with a urinary tract infection 4.3%
199% worse than State average

State average: 1.4%

Lost Too Much Weight Info Percent of long-stay residents who lose too much weight 1.6%
68% better than State average

State average: 5.2%

Depressive Symptoms Info Percent of long-stay residents who have depressive symptoms 2.9%
60% better than State average

State average: 7.2%

Antipsychotic Use Info Percent of long-stay residents who received an antipsychotic medication 12.8%
32% better than State average

State average: 18.8%

Pneumococcal Vaccine Info Percent of long-stay residents assessed and appropriately given the pneumococcal vaccine 92.4%
In line with State average

State average: 93.3%

Influenza Vaccine Info Percent of long-stay residents assessed and appropriately given the seasonal influenza vaccine 87.5%
8% worse than State average

State average: 94.7%

Hospitalizations per 1,000 days Info Number of hospitalizations per 1,000 long-stay resident days. 3.75
188% worse than State average

State average: 1.30

ED visits per 1,000 days Info Number of outpatient emergency department visits per 1,000 long-stay resident days. 5.37
222% worse than State average

State average: 1.67

Short-stay resident measures
Pneumococcal Vaccine Info Percent of short-stay residents assessed and appropriately given the pneumococcal vaccine 49.1%
36% worse than State average

State average: 76.6%

Antipsychotic medication increase Info Percent of short-stay residents who newly received an antipsychotic medication 0.0%
100% better than State average

State average: 1.4%

Falls with major injury Info Percentage of SNF residents who experience falls with major injury during their stay. 0.0%
100% better than State average

State average: 0.8%

Breakdown by payment type

Medicare

26% of new residents, usually for short-term rehab.

Typical stay 4 - 5 months

Private pay

42% of new residents, often for short stays.

Typical stay 7 - 8 months

Medicaid

32% of new residents, often for long-term daily care.

Typical stay 2 years

Facility Characteristics

Source: CMS Long-Term Care Facility Characteristics (Data as of Jan 2026)

Total residents 20
Medicare
1
5% of residents
Medicaid
14
70% of residents
Private pay or other
5
25% of residents
Programs & Services
Residents Group

Residents meet regularly to discuss policies, care quality, and activities

Active Resident Council

Organized group of residents that meets regularly to discuss facility policies, quality of life, and activities.

Finances and operations

Based on CMS SNF Cost Report for fiscal year ending in 12/2023.

For-profit
Operated by a single business entity.
Net patient revenue Info Net patient revenue — what the home actually collects for resident care, after contractual allowances, bad debt and discounts are subtracted from its gross charges (CMS cost report, Worksheet G-3). It covers resident care only; money the home earns from other sources is shown separately as "Other income."
$2.4M
Net patient income Info Net patient income: net patient revenue minus the home's total operating expenses. A positive figure means it earns more from resident care than it spends to deliver it; a negative figure means the opposite. It excludes non-operating "other income."
-$707.7K
For-profit Operated by a single business entity.
Net patient revenue Info Net patient revenue — what the home actually collects for resident care, after contractual allowances, bad debt and discounts are subtracted from its gross charges (CMS cost report, Worksheet G-3). It covers resident care only; money the home earns from other sources is shown separately as "Other income."
$2.4M Rank #219 / 221Revenue — State benchmarkedThis home is ranked 219th out of 221 homes in Colorado. Shows this facility's annual revenue compared to the Colorado average. Higher revenue generally means more resources for staffing and capital — read alongside Payroll %.Rankings are based only on facilities in Colorado that report data for that category. Facilities without available data are excluded from the ranking.Click the rank badge to see the full State ranking.Click here to see the full State ranking.
Net patient income Info Net patient income: net patient revenue minus the home's total operating expenses. A positive figure means it earns more from resident care than it spends to deliver it; a negative figure means the opposite. It excludes non-operating "other income."
-$707.7K
Other income Info Money the home earns outside of resident care — such as investments, grants, rentals and other non-operating sources (CMS cost report, Worksheet G-3). It is tracked separately from net patient revenue: it is not part of that figure, and it is not included in net patient income.
$121.5K
Payroll costs Info Staff salaries plus wage-related costs — benefits such as payroll taxes, health insurance and retirement — from the home's own accounting records (CMS cost report, Worksheet A). Contract or agency labor is counted separately, under other operating costs. Rank #220 / 221Payroll — State benchmarkedThis home is ranked 220th out of 221 homes in Colorado. Shows total annual staff payroll benchmarked to the Colorado average. Higher payroll investment relative to peers often signals better staffing and less reliance on cheaper contract labor.Rankings are based only on facilities in Colorado that report data for that category. Facilities without available data are excluded from the ranking.Click the rank badge to see the full State ranking.Click here to see the full State ranking.
$1.4M 59.1% of net patient revenue Info Payroll as a share of revenue: staff salaries and wage-related benefits divided by net patient revenue. A higher figure means more of each revenue dollar goes to staff pay. Rank #94 / 221Payroll % — State benchmarkedThis home is ranked 94th out of 221 homes in Colorado. Shows payroll as a percentage of revenue versus the Colorado average. Well-run Colorado facilities typically land around 59–66% — the top third Statewide. Below 25% may signal understaffing or heavy agency use — read with Staffing ratings.Rankings are based only on facilities in Colorado that report data for that category. Facilities without available data are excluded from the ranking.Click the rank badge to see the full State ranking.Click here to see the full State ranking.
Other operating costs Info Everything it costs to run the home apart from payroll — food, utilities, supplies, maintenance, contract labor and administration. Calculated as total operating expense minus payroll (staff salaries and wage-related benefits).
$1.7M
Total costs Info The home's total operating expense for the year — all the costs of running it, salaries included (CMS cost report, Worksheet G-3).
$3.1M

What does this home offer?

Building type icon
Building type icon

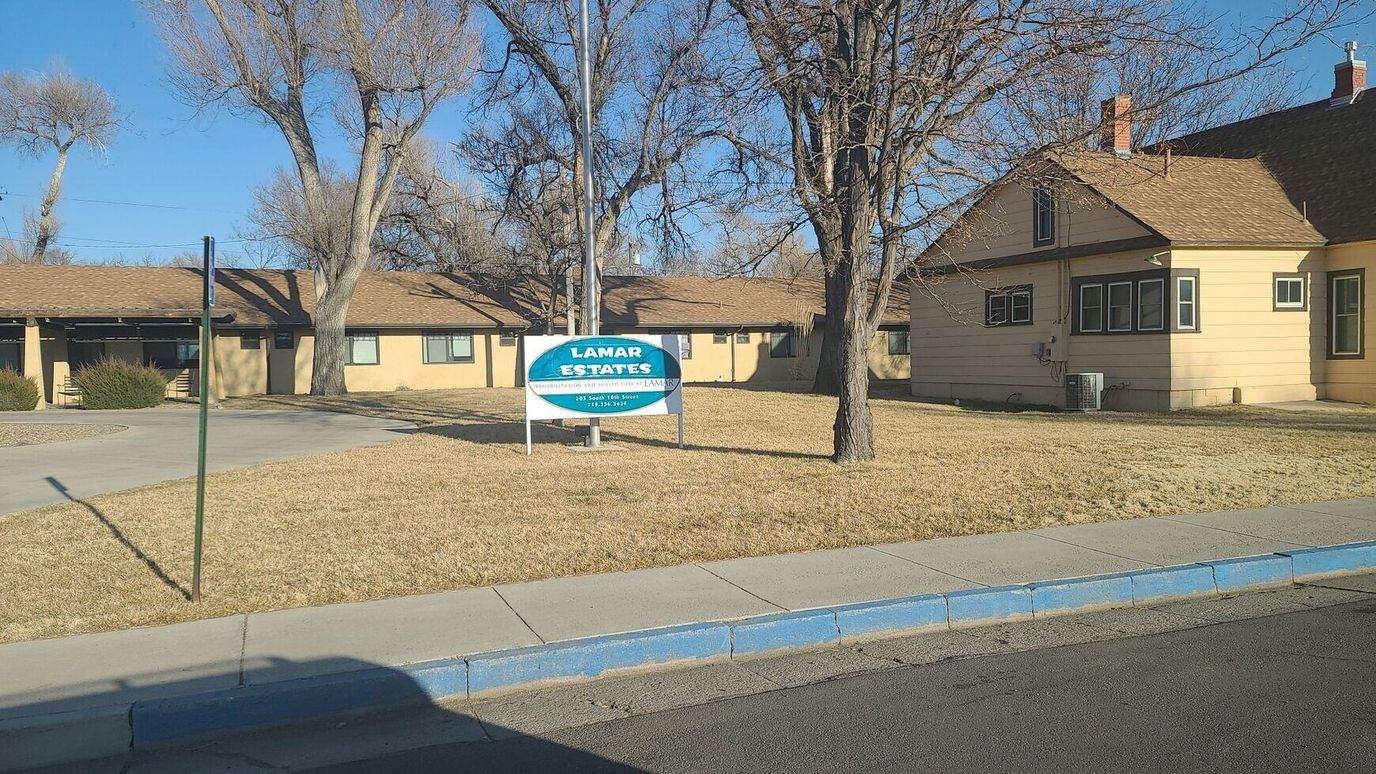
Building Type: Single-story

On-site medical care and health services icon

On-site Medical Care and Health Services

Who this home usually serves

TYPE OF STAY

Mostly long-term care residents

Most residents stay for extended periods and receive ongoing daily care.

New residents most often arrive under private pay (42% of admissions), and a typical private pay stay runs around 7 - 8 months.

Admissions
19 total

Coverage residents most often arrive under.

Medicare 26%
Private pay 42%
Medicaid 32%
Discharges
22 total

Coverage residents most often leave under.

Medicare 32%
Private pay 32%
Medicaid 36%

Places of interest near Lamar Estates, LLC

Address 0.5 miles from city center Info Estimated distance in miles from Lamar's city center to Lamar Estates, LLC's address, calculated via Google Maps.

Calculate Travel Distance to Lamar Estates, LLC

Add your location

Address

Compare Nursing Homes around the area

The information below is reported by the Colorado Department of Public Health and Environment, Health Facilities Division.

Lamar Estates, LLC
NH
Lamar -60 A+ 55 -
Brookdale Greenwood Village
NH
AL
IL
MC
Greenwood Village -90 B- 71 Studio / 1 Bed / Semi-Private / Private
Life Care Center of Westminster
NH
Westminster (South Westminster) -120 A+ 73 1 Bed / 2 Bed
Life Care Center of Colorado Springs
NH
Colorado Springs (Southeast Colorado Springs) -121 A+ 63 -
Peaks Care Center
NH
AL
IL
Longmont (Coffman Street) -92 A+ 80 -

Frequently Asked Questions about Lamar Estates, LLC

What neighborhood is Lamar Estates, LLC in?

Lamar Estates, LLC is in the Lamar neighborhood of Lamar.

Is Lamar Estates, LLC in a walkable area?

Lamar Estates, LLC has a walk score of 55. Moderately walkable. Some errands can be accomplished on foot, with a mix of nearby amenities.

What is the occupancy rate at Lamar Estates, LLC?

Lamar Estates, LLC's occupancy is 32.4%.

Does Lamar Estates, LLC operate as a for-profit or non-profit?

Lamar Estates, LLC is registered as a for-profit in CO.

Are there photos of Lamar Estates, LLC?

Yes — there is 1 photo of Lamar Estates, LLC in the photo gallery on this page.

What is the address of Lamar Estates, LLC?

Lamar Estates, LLC is located at 205 S 10Th St, Lamar, CO 81052.

What is the phone number of Lamar Estates, LLC?

(719) 336-3434 will put you in contact with the team at Lamar Estates, LLC.

Guides for Better Senior Living

Care Cost Calculator: See Prices in Your Area

Nursing Home Data Explorer

Don’t Wait Too Long: 7 Red Flag Signs Your Parent Needs Assisted Living Now

The True Cost of Assisted Living in 2025 – And How Families Are Paying For It

Understanding Senior Living Costs: Pricing Models, Discounts & Financial Assistance