


Trinity Care of Love
Trinity Care of Love
Peacefully nestled in the tree-lined neighborhood of Randallstown, MD, Trinity Care of Love is an outstanding haven that offers assisted living. With a compassionate and highly qualified team available 24/7, residents receive top-notch assistance for their daily living activities, including grooming and dressing. The maintenance of beautifully furnished and cozy accommodations is also taken care of, ensuring residents can feel at ease during their stay.
Fun exercises and engaging events are conducted for residents’ holistic wellness. Mealtimes are also thoughtfully planned to meet residents’ dietary needs and preferences, ensuring the finest dining experience. With medication management, residents do not have to worry about their prescriptions. Promoting a nurturing and supportive environment, the community ensures residents make every moment of their golden years count.
Walk Score: 18 / 100 Rank #756 / 985Walk Score — State benchmarkedThis home is ranked 756th out of 985 homes in Maryland. Shows how walkable this facility's neighborhood is compared to the average Walk Score across Maryland facilities. Higher scores benefit residents, families, and staff.Click the rank badge to see the full State ranking.Click here to see the full State ranking.
Car-dependent. Most errands require a car, with limited nearby walkable options.
What does this home offer?
Housing Options: Private / Shared Rooms
Building Type: Single-story
Housekeeping Services
Social and Recreational Activities
Places of interest near Trinity Care of Love
![]() 1.2 miles from city center
1.2 miles from city center
![]() Estimated distance in miles from Randallstown's city center to Trinity Care of Love's address, calculated via Google Maps.
Estimated distance in miles from Randallstown's city center to Trinity Care of Love's address, calculated via Google Maps.
Calculate Travel Distance to Trinity Care of Love
Add your location
Financial Assistance for
Assisted Living in Maryland
Trinity Care of Love is located in Randallstown, Maryland.
Here are the financial assistance programs available to residents in Maryland.
Compare Assisted Living around Maryland
The information below is reported by the Maryland Department of Health, Office of Health Care Quality.
| Bay Village of Annapolis |
AL Assisted Living A licensed, long-term care setting for seniors or individuals with disabilities who need help with daily activities — like bathing, dressing, and medication management — but not 24-hour skilled nursing. Offers housing, meals, and around-the-clock support while aiming to maximize resident independence.
NH Nursing Home Licensed facility providing 24/7 skilled nursing care for residents with complex, ongoing medical needs. Staffed by RNs, LPNs, and CNAs. Inspected and star-rated annually by CMS. Accepts Medicare (short-term rehab) and Medicaid (long-term care). | Annapolis | 88
Facility
88
MD AVG
43
Rank
#162 / 697 | Yes |
75
Facility
75
MD AVG
43
Rank
#131 / 985 | Private / Shared Rooms | 5
Facility
5
MD AVG
21
Rank
#182 / 208 |
32% Male Residents — State Benchmarked 32% of residents are male, compared to the Maryland average of 31%. This facility caters to a majority female resident pool (68% female), consistent with the broader assisted living trend where women significantly outnumber men. |
68% Female Residents — State Benchmarked 68% of residents are female, compared to the Maryland average of 69%. Women comprise the large majority, consistent with national assisted living demographics where women live longer and enter care facilities at higher rates. |
99% White Residents — State Benchmarked 99% of residents are reported as White, compared to the Maryland average of 81%. A higher White share than is typical for assisted living in Maryland in this dataset — compare with peer facilities for local context. |
0% African American Residents — State Benchmarked 0% of residents are reported as African American or Black, compared to the Maryland average of 13%. A lower African American share than is typical in Maryland; local markets still vary widely. |
1% Other Ethnicity Residents — State Benchmarked 1% of residents fall into categories other than White or African American (combined), compared to the Maryland average of 6%. This column aggregates Hispanic, Asian, multiracial, and any other labeled groups that are not classified as White or African American. Reported subgroups in this total: Hispanic (1%). |
14% Residents Age 65–74 — State Benchmarked 14% of residents are 65–74, compared to the Maryland average of 13%. In line with the statewide profile for this youngest senior bracket in assisted living. |
28% Residents Age 75–84 — State Benchmarked 28% of residents are 75–84, compared to the Maryland average of 31%. This is the second most common age bracket in assisted living, representing residents with moderate care needs. |
50% Residents Age 85–94 — State Benchmarked 50% of residents are 85–94, compared to the Maryland average of 44%. A high concentration of very elderly residents signals a higher-acuity facility with experience caring for advanced age-related needs. |
8% Residents Age 95+ — State Benchmarked 8% of residents are 95 or older, compared to the Maryland average of 16%. Most residents here have not yet reached the oldest-old bracket, suggesting a younger overall community. |
| Brightview Annapolis |
AL Assisted Living A licensed, long-term care setting for seniors or individuals with disabilities who need help with daily activities — like bathing, dressing, and medication management — but not 24-hour skilled nursing. Offers housing, meals, and around-the-clock support while aiming to maximize resident independence.
IL Independent Living Lifestyle-focused communities for older adults offering dining, activities, and transportation with minimal personal care. Best for active, independent seniors who want community without medical support.
MC Memory Care Secured, specialized care for people living with Alzheimer's or dementia. Staff trained in cognitive impairment, with higher staff-to-resident ratios and an environment designed to reduce confusion and wandering risk. | Annapolis | 85
Facility
85
MD AVG
43
Rank
#168 / 697 | Yes |
34
Facility
34
MD AVG
43
Rank
#590 / 985 | Private / Shared Rooms | 8
Facility
8
MD AVG
21
Rank
#162 / 208 |
27% Male Residents — State Benchmarked 27% of residents are male, compared to the Maryland average of 31%. This facility caters to a majority female resident pool (73% female), consistent with the broader assisted living trend where women significantly outnumber men. |
73% Female Residents — State Benchmarked 73% of residents are female, compared to the Maryland average of 69%. Women comprise the large majority, consistent with national assisted living demographics where women live longer and enter care facilities at higher rates. |
97% White Residents — State Benchmarked 97% of residents are reported as White, compared to the Maryland average of 81%. A higher White share than is typical for assisted living in Maryland in this dataset — compare with peer facilities for local context. |
0% African American Residents — State Benchmarked 0% of residents are reported as African American or Black, compared to the Maryland average of 13%. A lower African American share than is typical in Maryland; local markets still vary widely. |
3% Other Ethnicity Residents — State Benchmarked 3% of residents fall into categories other than White or African American (combined), compared to the Maryland average of 6%. This column aggregates Hispanic, Asian, multiracial, and any other labeled groups that are not classified as White or African American. Reported subgroups in this total: Hispanic (3%). |
3% Residents Age 65–74 — State Benchmarked 3% of residents are 65–74, compared to the Maryland average of 13%. Fewer younger seniors suggests the resident population skews older, likely requiring higher acuity care and more hands-on support. |
27% Residents Age 75–84 — State Benchmarked 27% of residents are 75–84, compared to the Maryland average of 31%. This is the second most common age bracket in assisted living, representing residents with moderate care needs. |
59% Residents Age 85–94 — State Benchmarked 59% of residents are 85–94, compared to the Maryland average of 44%. A high concentration of very elderly residents signals a higher-acuity facility with experience caring for advanced age-related needs. |
9% Residents Age 95+ — State Benchmarked 9% of residents are 95 or older, compared to the Maryland average of 16%. Most residents here have not yet reached the oldest-old bracket, suggesting a younger overall community. |
| Sunrise of Silver Spring |
AL Assisted Living A licensed, long-term care setting for seniors or individuals with disabilities who need help with daily activities — like bathing, dressing, and medication management — but not 24-hour skilled nursing. Offers housing, meals, and around-the-clock support while aiming to maximize resident independence.
HC Home Care Professional care delivered in the person's own home — from companionship and errands to skilled nursing and therapy. Allows seniors to age in place. Medicare covers skilled home health when medically necessary.
MC Memory Care Secured, specialized care for people living with Alzheimer's or dementia. Staff trained in cognitive impairment, with higher staff-to-resident ratios and an environment designed to reduce confusion and wandering risk.
RC Respite Care Short-term temporary care — days to weeks — to give family caregivers a break. Full care provided during the stay. Often used after hospitalization or to trial a facility before a permanent placement decision. | Silver Spring (New Hampshire Avenue) | 84
Facility
84
MD AVG
43
Rank
#170 / 697 | Yes |
40
Facility
40
MD AVG
43
Rank
#523 / 985 | Private / Shared Rooms | 24
Facility
24
MD AVG
21
Rank
#92 / 208 |
31% Male Residents — State Benchmarked 31% of residents are male, compared to the Maryland average of 31%. This facility caters to a majority female resident pool (69% female), consistent with the broader assisted living trend where women significantly outnumber men. |
69% Female Residents — State Benchmarked 69% of residents are female, compared to the Maryland average of 69%. Women comprise the large majority, consistent with national assisted living demographics where women live longer and enter care facilities at higher rates. |
53% White Residents — State Benchmarked 53% of residents are reported as White, compared to the Maryland average of 81%. A lower White share than the Maryland average — the community may draw a more diverse resident mix relative to other facilities in Maryland. |
39% African American Residents — State Benchmarked 39% of residents are reported as African American or Black, compared to the Maryland average of 13%. A higher African American share than the typical Maryland average — useful context when comparing cultural fit and community composition. |
9% Other Ethnicity Residents — State Benchmarked 9% of residents fall into categories other than White or African American (combined), compared to the Maryland average of 6%. This column aggregates Hispanic, Asian, multiracial, and any other labeled groups that are not classified as White or African American. Reported subgroups in this total: Asian (4%), Hawaiian/Pacific Islander (3%), Hispanic (1%). |
4% Residents Age 65–74 — State Benchmarked 4% of residents are 65–74, compared to the Maryland average of 13%. Fewer younger seniors suggests the resident population skews older, likely requiring higher acuity care and more hands-on support. |
43% Residents Age 75–84 — State Benchmarked 43% of residents are 75–84, compared to the Maryland average of 31%. A high concentration in this mid-range bracket, where residents typically need moderate support with daily activities. |
37% Residents Age 85–94 — State Benchmarked 37% of residents are 85–94, compared to the Maryland average of 44%. The population here skews younger than the statewide norm, which may indicate a more active, lower-acuity community. |
14% Residents Age 95+ — State Benchmarked 14% of residents are 95 or older, compared to the Maryland average of 16%. In line with the statewide profile for the oldest resident bracket. |
| Modena Reserve at Kensington |
AL Assisted Living A licensed, long-term care setting for seniors or individuals with disabilities who need help with daily activities — like bathing, dressing, and medication management — but not 24-hour skilled nursing. Offers housing, meals, and around-the-clock support while aiming to maximize resident independence.
IL Independent Living Lifestyle-focused communities for older adults offering dining, activities, and transportation with minimal personal care. Best for active, independent seniors who want community without medical support.
MC Memory Care Secured, specialized care for people living with Alzheimer's or dementia. Staff trained in cognitive impairment, with higher staff-to-resident ratios and an environment designed to reduce confusion and wandering risk. | Kensington (Metropolitan Avenue) | 80
Facility
80
MD AVG
43
Rank
#176 / 697 | No |
85
Facility
85
MD AVG
43
Rank
#54 / 985 | Private / Shared Rooms | 4
Facility
4
MD AVG
21
Rank
#191 / 208 | - | - | - | - | - | - | - | - | - |
| Trinity Care of Love |
AL Assisted Living A licensed, long-term care setting for seniors or individuals with disabilities who need help with daily activities — like bathing, dressing, and medication management — but not 24-hour skilled nursing. Offers housing, meals, and around-the-clock support while aiming to maximize resident independence. | Randallstown (Randall Ridge) | 3
Facility
3
MD AVG
43
Rank
#672 / 697 | No |
18
Facility
18
MD AVG
43
Rank
#756 / 985 | Private / Shared Rooms | - | - | - | - | - | - | - | - | - | - |
Frequently Asked Questions about Trinity Care of Love
What neighborhood is Trinity Care of Love in?
Trinity Care of Love is in the Randall Ridge neighborhood.
Is Trinity Care of Love in a walkable area?
Trinity Care of Love has a walk score of 18. Car-dependent. Most errands require a car, with limited nearby walkable options.
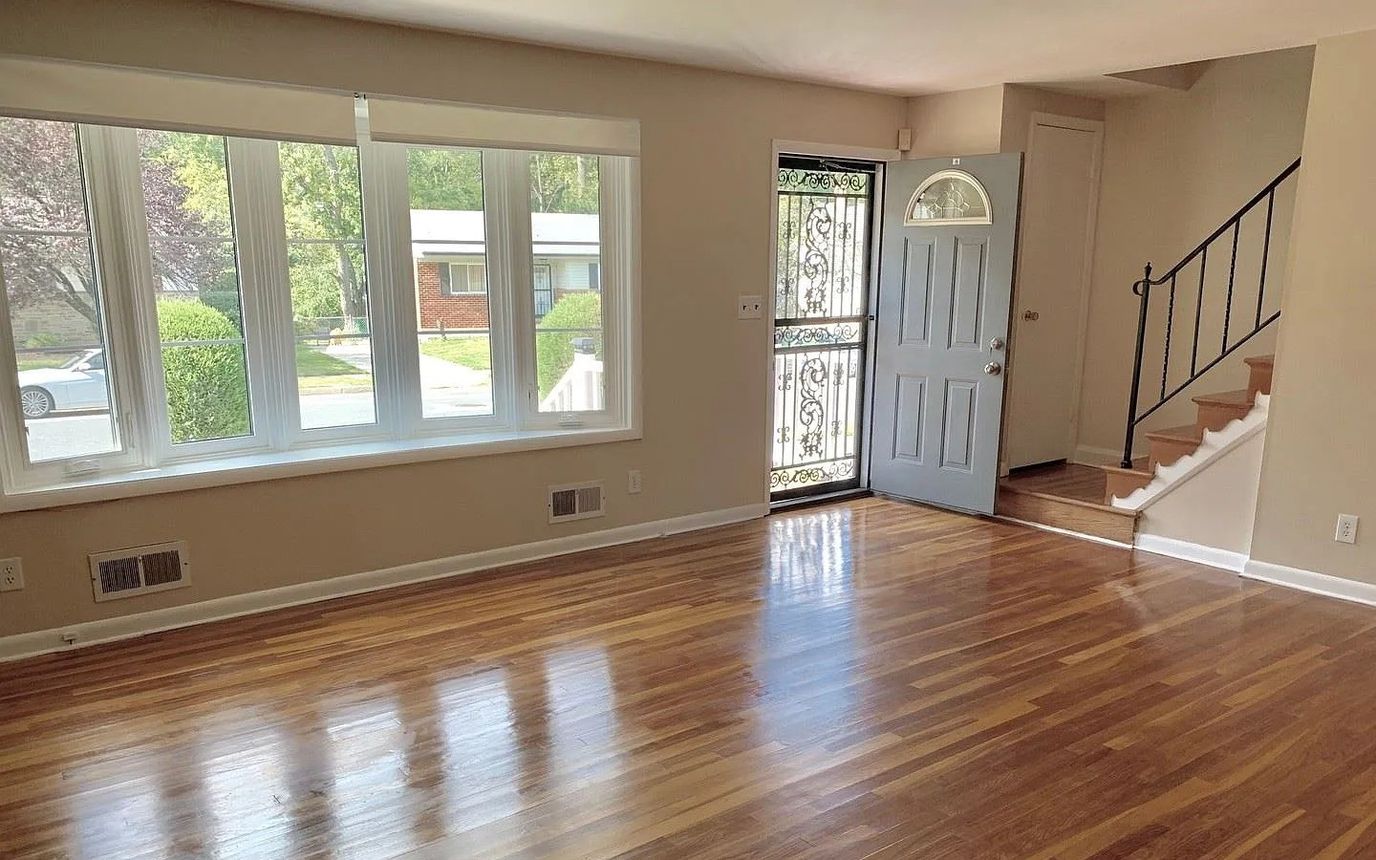
Are there photos of Trinity Care of Love?
Yes — there is 1 photo of Trinity Care of Love in the photo gallery on this page.
What is the address of Trinity Care of Love?
Trinity Care of Love is located at 3819 Collier Road, Randallstown, MD 21133.
What is the phone number of Trinity Care of Love?
(443) 744-1141 will put you in contact with the team at Trinity Care of Love.
Is Trinity Care of Love Medicare or Medicaid certified?
Trinity Care of Love is not currently listed as a CMS-certified provider of Medicare or Medicaid.
Guides for Better Senior Living
Care Cost Calculator: See Prices in Your Area
Nursing Home Data Explorer
Don’t Wait Too Long: 7 Red Flag Signs Your Parent Needs Assisted Living Now
The True Cost of Assisted Living in 2025 – And How Families Are Paying For It
Understanding Senior Living Costs: Pricing Models, Discounts & Financial Assistance
Contact Us

Updated on
Feedback
Write a review for Trinity Care of Love
Rate your overall experience with this community
Explore Open Rooms
1
Contact details
2
What type of senior care service are you looking for?
3
What budget do you have in mind for senior care?
4
How soon do you need to find care?
5
Additional details
Thank you for your interest!
Our team will be in touch shortly to help with next steps.
Need Help?
Let us help you or a loved one find the perfect senior home.
