


Where in Maryland are you looking?
Browse communities by city.
Aberdeen
Accokeek
Adelphi
Annapolis
Anne Arundel County
Baltimore
Beltsville
Bethesda
Bowie
Cambridge
Catonsville
Chevy Chase
Clinton
Columbia
Coral Hills
Easton
Elkton
Ellicott City
Forest Hill
Fort Washington
Frederick
Gaithersburg
Germantown
Glen Burnie
Hagerstown
Harford County
Howard County
Hyattsville
Marlboro
Montgomery County
Odenton
Pikesville
Potomac
Prince George's County
Queenstown
Rockville
Salisbury
Sandy Spring
Severna Park
Silver Spring
Temple Hills
Towson
Waldorf
Washington County
Compare Assisted Living around Maryland
The information below is reported by the Maryland Department of Health, Office of Health Care Quality.
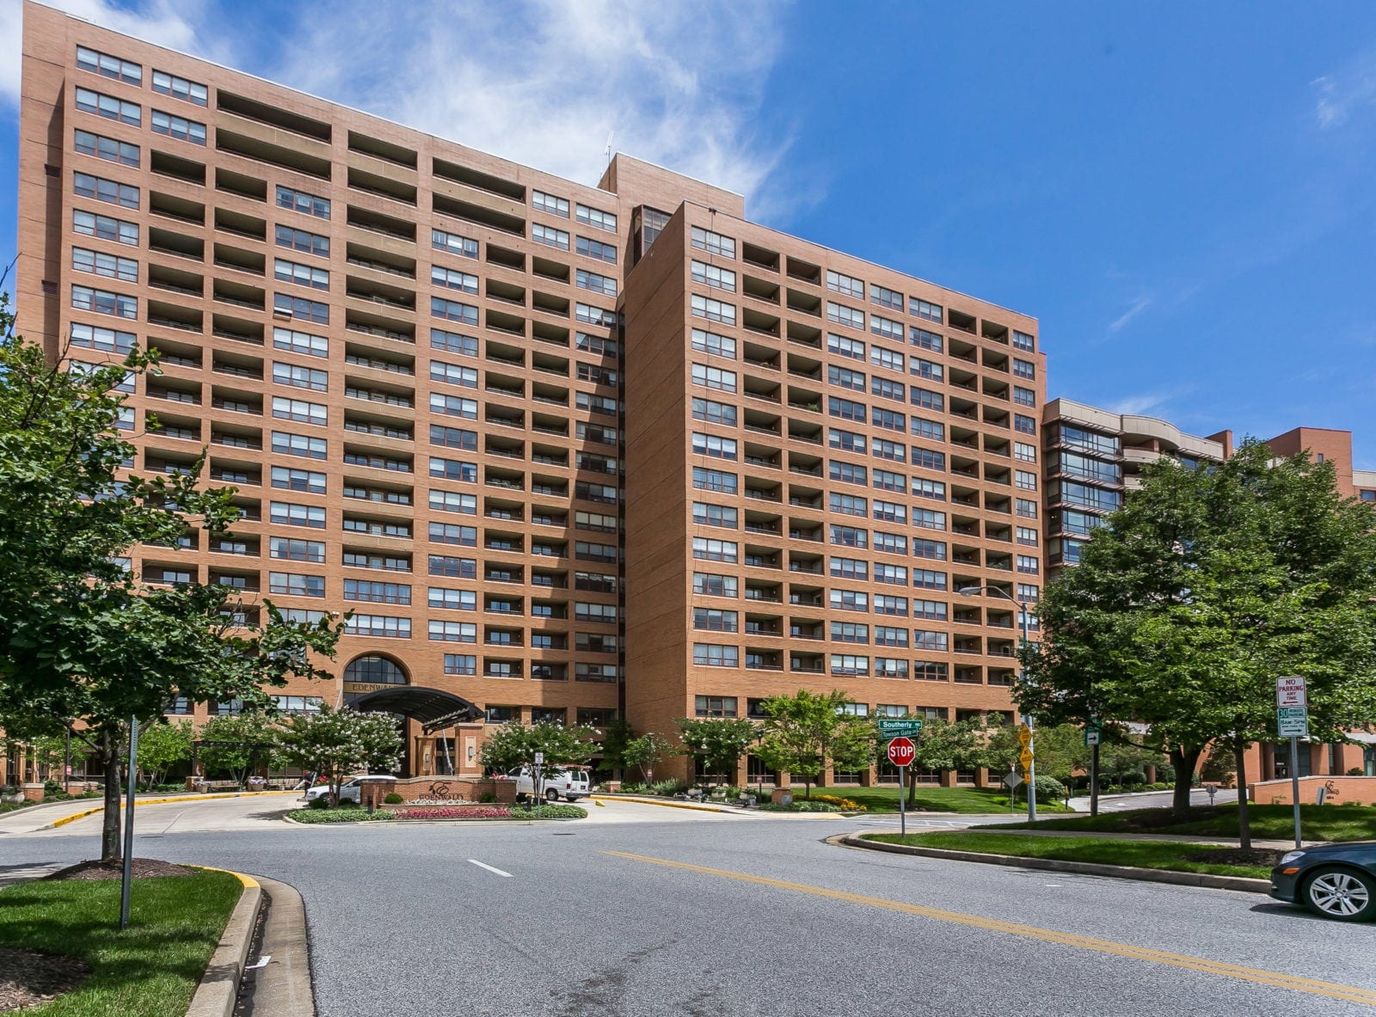
| Edenwald Senior Living | AL IL MC NH SNF | Towson (Southerly Road) | 94
Facility
94
MD AVG
43
Rank
#144 / 690 | No |
83
Facility
83
MD AVG
43
Rank
#70 / 985 | 1 Bed / 2 Bed | - |
18% Male Residents — State Benchmarked 18% of residents are male, compared to the Maryland average of 31%. This facility caters to a majority female resident pool (82% female), consistent with the broader assisted living trend where women significantly outnumber men. |
82% Female Residents — State Benchmarked 82% of residents are female, compared to the Maryland average of 69%. Women comprise the large majority, consistent with national assisted living demographics where women live longer and enter care facilities at higher rates. |
100% White Residents — State Benchmarked 100% of residents are reported as White, compared to the Maryland average of 81%. A higher White share than is typical for assisted living in Maryland in this dataset — compare with peer facilities for local context. |
0% African American Residents — State Benchmarked 0% of residents are reported as African American or Black, compared to the Maryland average of 13%. A lower African American share than is typical in Maryland; local markets still vary widely. |
0% Other Ethnicity Residents — State Benchmarked 0% of residents fall into categories other than White or African American (combined), compared to the Maryland average of 6%. This column aggregates Hispanic, Asian, multiracial, and any other labeled groups that are not classified as White or African American. | - |
13% Residents Age 75–84 — State Benchmarked 13% of residents are 75–84, compared to the Maryland average of 31%. Below the state norm — the resident mix may skew either younger or older than this typical middle bracket. |
53% Residents Age 85–94 — State Benchmarked 53% of residents are 85–94, compared to the Maryland average of 44%. A high concentration of very elderly residents signals a higher-acuity facility with experience caring for advanced age-related needs. |
35% Residents Age 95+ — State Benchmarked 35% of residents are 95 or older, compared to the Maryland average of 16%. A high proportion of the oldest-old suggests strong end-of-life care experience and very-high-acuity capabilities. |
| Homewood Living Frederick | AL IL MC NH SNF | Frederick | 120
Facility
120
MD AVG
43
Rank
#76 / 690 | Yes |
14
Facility
14
MD AVG
43
Rank
#788 / 985 | 1 Bed / 2 Bed | - | - | - | - | - | - | - | - | - | - |
| Ingleside at King Farm | AL IL MC NH SNF | Rockville (King Farm) | 45
Facility
45
MD AVG
43
Rank
#226 / 690 | Yes |
73
Facility
73
MD AVG
43
Rank
#152 / 985 | 1 Bed / 2 Bed | - | - | - | - | - | - | - | - | - | - |
| Bedford Court, a CCRC | AL HOS IL MC NH RC SNF | Silver Spring (International Drive) | 76
Facility
76
MD AVG
43
Rank
#179 / 690 | Yes |
64
Facility
64
MD AVG
43
Rank
#261 / 985 | Studio / 1 Bed | 34
Facility
34
MD AVG
21
Rank
#22 / 210 |
15% Male Residents — State Benchmarked 15% of residents are male, compared to the Maryland average of 31%. This facility caters to a majority female resident pool (85% female), consistent with the broader assisted living trend where women significantly outnumber men. |
85% Female Residents — State Benchmarked 85% of residents are female, compared to the Maryland average of 69%. Women comprise the large majority, consistent with national assisted living demographics where women live longer and enter care facilities at higher rates. |
95% White Residents — State Benchmarked 95% of residents are reported as White, compared to the Maryland average of 81%. A higher White share than is typical for assisted living in Maryland in this dataset — compare with peer facilities for local context. |
3% African American Residents — State Benchmarked 3% of residents are reported as African American or Black, compared to the Maryland average of 13%. A lower African American share than is typical in Maryland; local markets still vary widely. |
2% Other Ethnicity Residents — State Benchmarked 2% of residents fall into categories other than White or African American (combined), compared to the Maryland average of 6%. This column aggregates Hispanic, Asian, multiracial, and any other labeled groups that are not classified as White or African American. Reported subgroups in this total: Asian (2%). |
2% Residents Age 65–74 — State Benchmarked 2% of residents are 65–74, compared to the Maryland average of 13%. Fewer younger seniors suggests the resident population skews older, likely requiring higher acuity care and more hands-on support. |
8% Residents Age 75–84 — State Benchmarked 8% of residents are 75–84, compared to the Maryland average of 31%. Below the state norm — the resident mix may skew either younger or older than this typical middle bracket. |
65% Residents Age 85–94 — State Benchmarked 65% of residents are 85–94, compared to the Maryland average of 44%. A high concentration of very elderly residents signals a higher-acuity facility with experience caring for advanced age-related needs. |
26% Residents Age 95+ — State Benchmarked 26% of residents are 95 or older, compared to the Maryland average of 16%. A high proportion of the oldest-old suggests strong end-of-life care experience and very-high-acuity capabilities. |
| Sterling Care Hillhaven Assisted Living and Memory Care | AL HOS MC NH SNF | Adelphi (Knollwood) | 66
Facility
66
MD AVG
43
Rank
#195 / 690 | No |
25
Facility
25
MD AVG
43
Rank
#684 / 985 | Studio / 1 Bed | - | - | - | - | - | - | - | - | - | - |
| Buckingham‘s Choice | AL MC NH RC SNF | Adamstown (Baker Circle) | 42
Facility
42
MD AVG
43
Rank
#230 / 690 | No |
3
Facility
3
MD AVG
43
Rank
#930 / 985 | Private Rooms | 31
Facility
31
MD AVG
21
Rank
#39 / 210 | - | - | - | - | - | - | - | - | - |
| Lutheran Village at Miller’s Grant | AL IL NH SNF | Ellicott City (Lutheran Village At Miller’s Grant) | 36
Facility
36
MD AVG
43
Rank
#237 / 690 | Yes |
19
Facility
19
MD AVG
43
Rank
#746 / 985 | 1 Bed / 2 Bed | 21
Facility
21
MD AVG
21
Rank
#108 / 210 |
17% Male Residents — State Benchmarked 17% of residents are male, compared to the Maryland average of 31%. This facility caters to a majority female resident pool (83% female), consistent with the broader assisted living trend where women significantly outnumber men. |
83% Female Residents — State Benchmarked 83% of residents are female, compared to the Maryland average of 69%. Women comprise the large majority, consistent with national assisted living demographics where women live longer and enter care facilities at higher rates. |
83% White Residents — State Benchmarked 83% of residents are reported as White, compared to the Maryland average of 81%. Close to the average for this category among assisted living facilities in Maryland with reported race/ethnicity data. |
11% African American Residents — State Benchmarked 11% of residents are reported as African American or Black, compared to the Maryland average of 13%. In line with the Maryland average for African American residents among facilities reporting this breakdown. |
6% Other Ethnicity Residents — State Benchmarked 6% of residents fall into categories other than White or African American (combined), compared to the Maryland average of 6%. This column aggregates Hispanic, Asian, multiracial, and any other labeled groups that are not classified as White or African American. Reported subgroups in this total: Asian (6%). | - |
33% Residents Age 75–84 — State Benchmarked 33% of residents are 75–84, compared to the Maryland average of 31%. This is the second most common age bracket in assisted living, representing residents with moderate care needs. |
44% Residents Age 85–94 — State Benchmarked 44% of residents are 85–94, compared to the Maryland average of 44%. This is typically the most common age bracket in assisted living — this facility is in line with the statewide norm. |
22% Residents Age 95+ — State Benchmarked 22% of residents are 95 or older, compared to the Maryland average of 16%. A high proportion of the oldest-old suggests strong end-of-life care experience and very-high-acuity capabilities. |
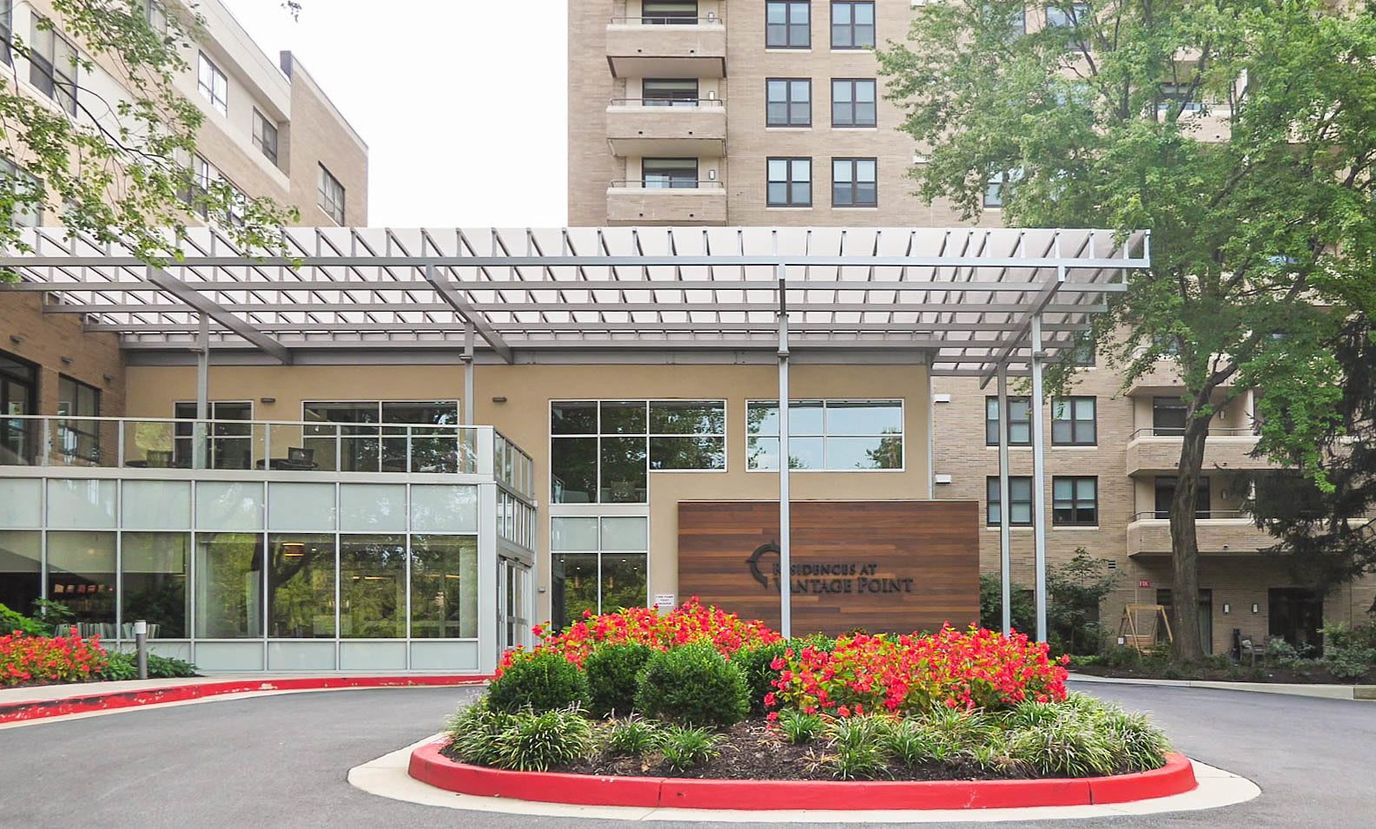
| Residences at Vantage Point | AL HC IL MC NH SNF | Columbia (Town Center) | 44
Facility
44
MD AVG
43
Rank
#229 / 690 | Yes |
52
Facility
52
MD AVG
43
Rank
#402 / 985 | Studio / 1 Bed / 2 Bed | 36
Facility
36
MD AVG
21
Rank
#16 / 210 | - | - | - | - | - | - | - | - | - |
| Maplewood Park Place | AL IL MC NH SNF | Bethesda (Pooks Hill) | 29
Facility
29
MD AVG
43
Rank
#247 / 690 | Yes |
38
Facility
38
MD AVG
43
Rank
#542 / 985 | 1 Bed / 2 Bed | 30
Facility
30
MD AVG
21
Rank
#44 / 210 |
18% Male Residents — State Benchmarked 18% of residents are male, compared to the Maryland average of 31%. This facility caters to a majority female resident pool (82% female), consistent with the broader assisted living trend where women significantly outnumber men. |
82% Female Residents — State Benchmarked 82% of residents are female, compared to the Maryland average of 69%. Women comprise the large majority, consistent with national assisted living demographics where women live longer and enter care facilities at higher rates. |
100% White Residents — State Benchmarked 100% of residents are reported as White, compared to the Maryland average of 81%. A higher White share than is typical for assisted living in Maryland in this dataset — compare with peer facilities for local context. |
0% African American Residents — State Benchmarked 0% of residents are reported as African American or Black, compared to the Maryland average of 13%. A lower African American share than is typical in Maryland; local markets still vary widely. |
0% Other Ethnicity Residents — State Benchmarked 0% of residents fall into categories other than White or African American (combined), compared to the Maryland average of 6%. This column aggregates Hispanic, Asian, multiracial, and any other labeled groups that are not classified as White or African American. | - |
6% Residents Age 75–84 — State Benchmarked 6% of residents are 75–84, compared to the Maryland average of 31%. Below the state norm — the resident mix may skew either younger or older than this typical middle bracket. |
24% Residents Age 85–94 — State Benchmarked 24% of residents are 85–94, compared to the Maryland average of 44%. The population here skews younger than the statewide norm, which may indicate a more active, lower-acuity community. |
71% Residents Age 95+ — State Benchmarked 71% of residents are 95 or older, compared to the Maryland average of 16%. A high proportion of the oldest-old suggests strong end-of-life care experience and very-high-acuity capabilities. |
| Friends House Retirement Community | AL IL NH SNF | Sandy Spring | 24
Facility
24
MD AVG
43
Rank
#249 / 690 | No |
6
Facility
6
MD AVG
43
Rank
#891 / 985 | - | 20
Facility
20
MD AVG
21
Rank
#112 / 210 |
6% Male Residents — State Benchmarked 6% of residents are male, compared to the Maryland average of 31%. This facility caters to a majority female resident pool (94% female), consistent with the broader assisted living trend where women significantly outnumber men. |
94% Female Residents — State Benchmarked 94% of residents are female, compared to the Maryland average of 69%. Women comprise the large majority, consistent with national assisted living demographics where women live longer and enter care facilities at higher rates. |
94% White Residents — State Benchmarked 94% of residents are reported as White, compared to the Maryland average of 81%. A higher White share than is typical for assisted living in Maryland in this dataset — compare with peer facilities for local context. |
0% African American Residents — State Benchmarked 0% of residents are reported as African American or Black, compared to the Maryland average of 13%. A lower African American share than is typical in Maryland; local markets still vary widely. |
6% Other Ethnicity Residents — State Benchmarked 6% of residents fall into categories other than White or African American (combined), compared to the Maryland average of 6%. This column aggregates Hispanic, Asian, multiracial, and any other labeled groups that are not classified as White or African American. Reported subgroups in this total: Asian (6%). |
6% Residents Age 65–74 — State Benchmarked 6% of residents are 65–74, compared to the Maryland average of 13%. Fewer younger seniors suggests the resident population skews older, likely requiring higher acuity care and more hands-on support. |
18% Residents Age 75–84 — State Benchmarked 18% of residents are 75–84, compared to the Maryland average of 31%. Below the state norm — the resident mix may skew either younger or older than this typical middle bracket. |
53% Residents Age 85–94 — State Benchmarked 53% of residents are 85–94, compared to the Maryland average of 44%. A high concentration of very elderly residents signals a higher-acuity facility with experience caring for advanced age-related needs. |
24% Residents Age 95+ — State Benchmarked 24% of residents are 95 or older, compared to the Maryland average of 16%. A high proportion of the oldest-old suggests strong end-of-life care experience and very-high-acuity capabilities. |
| Revitz House | AL HC IL MC NH SNF | Rockville | 558
Facility
558
MD AVG
43
Rank
#1 / 690 | Yes |
81
Facility
81
MD AVG
43
Rank
#86 / 985 | 1 Bed | - | - | - | - | - | - | - | - | - | - |
| Autumn Lake Healthcare at Braddock Heights | AL NH | Frederick (Braddock Estates) | 65
Facility
65
MD AVG
43
Rank
#197 / 690 | No |
0
Facility
0
MD AVG
43
Rank
#959 / 985 | - | - | - | - | - | - | - | - | - | - | - |
| Broadmead | AL IL MC NH RC SNF | Cockeysville | 40
Facility
40
MD AVG
43
Rank
#233 / 690 | No |
0
Facility
0
MD AVG
43
Rank
#959 / 985 | - | 47
Facility
47
MD AVG
21
Rank
#3 / 210 | - | - | - | - | - | - | - | - | - |
| Blakehurst (Chestnut Green) | AL IL MC NH SNF | Towson | 35
Facility
35
MD AVG
43
Rank
#239 / 690 | No |
10
Facility
10
MD AVG
43
Rank
#837 / 985 | - | 33
Facility
33
MD AVG
21
Rank
#25 / 210 | - | - | - | - | - | - | - | - | - |
| Asbury Methodist Village | AL IL MC NH SNF | Gaithersburg (Russell Avenue) | 164
Facility
164
MD AVG
43
Rank
#26 / 690 | Yes |
41
Facility
41
MD AVG
43
Rank
#508 / 985 | - | 27
Facility
27
MD AVG
21
Rank
#62 / 210 |
21% Male Residents — State Benchmarked 21% of residents are male, compared to the Maryland average of 31%. This facility caters to a majority female resident pool (79% female), consistent with the broader assisted living trend where women significantly outnumber men. |
79% Female Residents — State Benchmarked 79% of residents are female, compared to the Maryland average of 69%. Women comprise the large majority, consistent with national assisted living demographics where women live longer and enter care facilities at higher rates. |
92% White Residents — State Benchmarked 92% of residents are reported as White, compared to the Maryland average of 81%. A higher White share than is typical for assisted living in Maryland in this dataset — compare with peer facilities for local context. |
1% African American Residents — State Benchmarked 1% of residents are reported as African American or Black, compared to the Maryland average of 13%. A lower African American share than is typical in Maryland; local markets still vary widely. |
7% Other Ethnicity Residents — State Benchmarked 7% of residents fall into categories other than White or African American (combined), compared to the Maryland average of 6%. This column aggregates Hispanic, Asian, multiracial, and any other labeled groups that are not classified as White or African American. Reported subgroups in this total: Asian (7%). |
1% Residents Age 65–74 — State Benchmarked 1% of residents are 65–74, compared to the Maryland average of 13%. Fewer younger seniors suggests the resident population skews older, likely requiring higher acuity care and more hands-on support. |
21% Residents Age 75–84 — State Benchmarked 21% of residents are 75–84, compared to the Maryland average of 31%. Below the state norm — the resident mix may skew either younger or older than this typical middle bracket. |
48% Residents Age 85–94 — State Benchmarked 48% of residents are 85–94, compared to the Maryland average of 44%. This is typically the most common age bracket in assisted living — this facility is in line with the statewide norm. |
30% Residents Age 95+ — State Benchmarked 30% of residents are 95 or older, compared to the Maryland average of 16%. A high proportion of the oldest-old suggests strong end-of-life care experience and very-high-acuity capabilities. |
Rows per page:

View all Nearby Homes
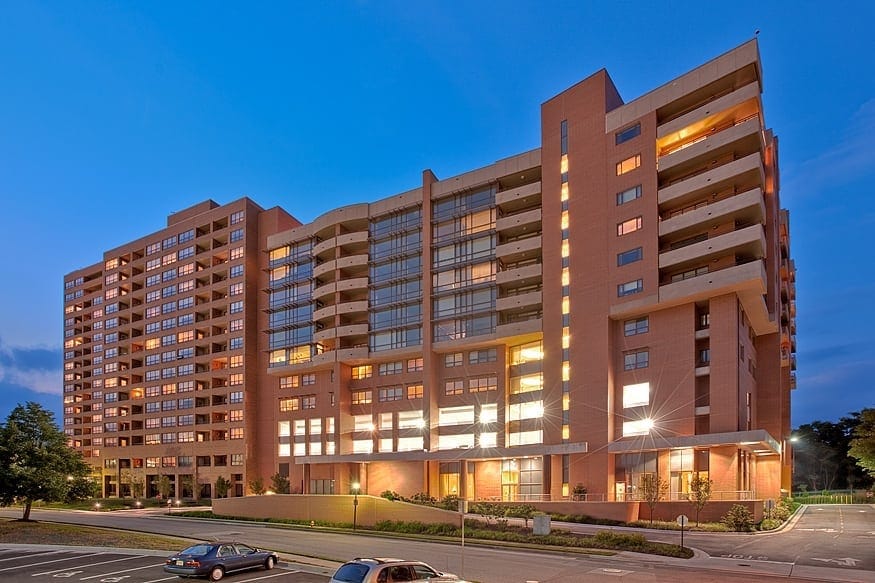
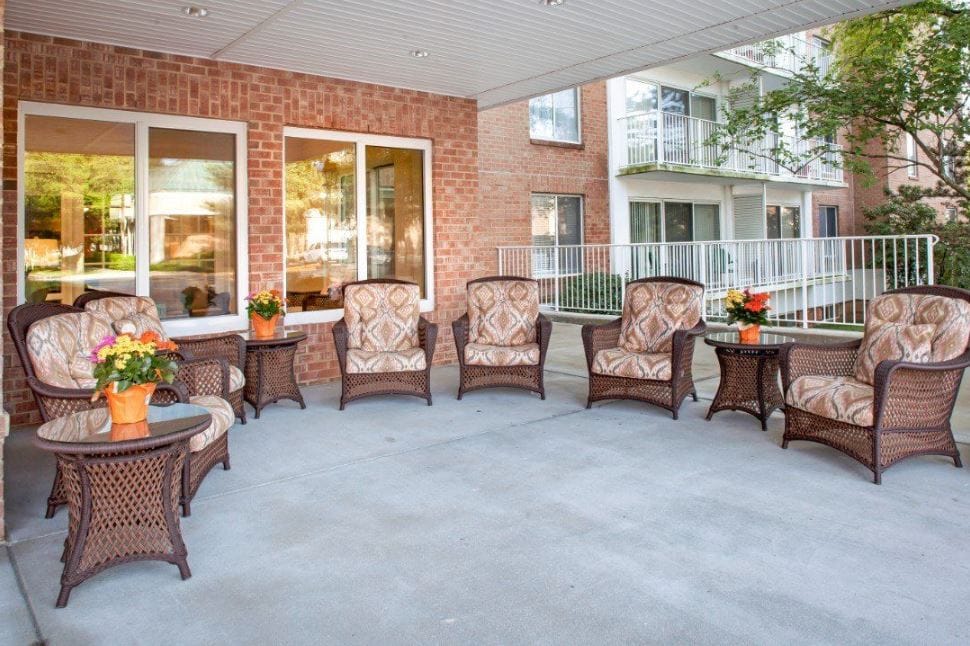
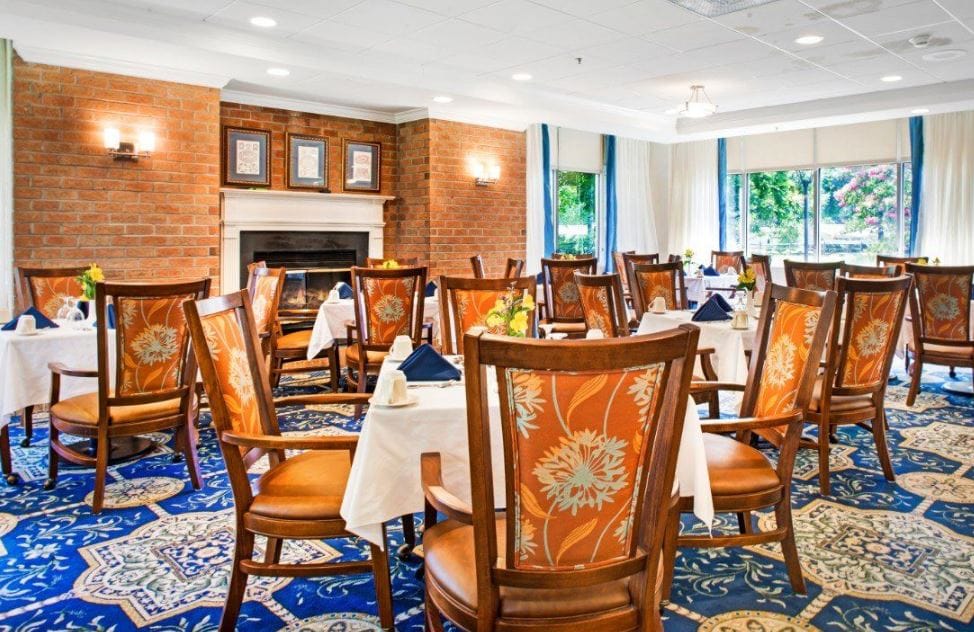
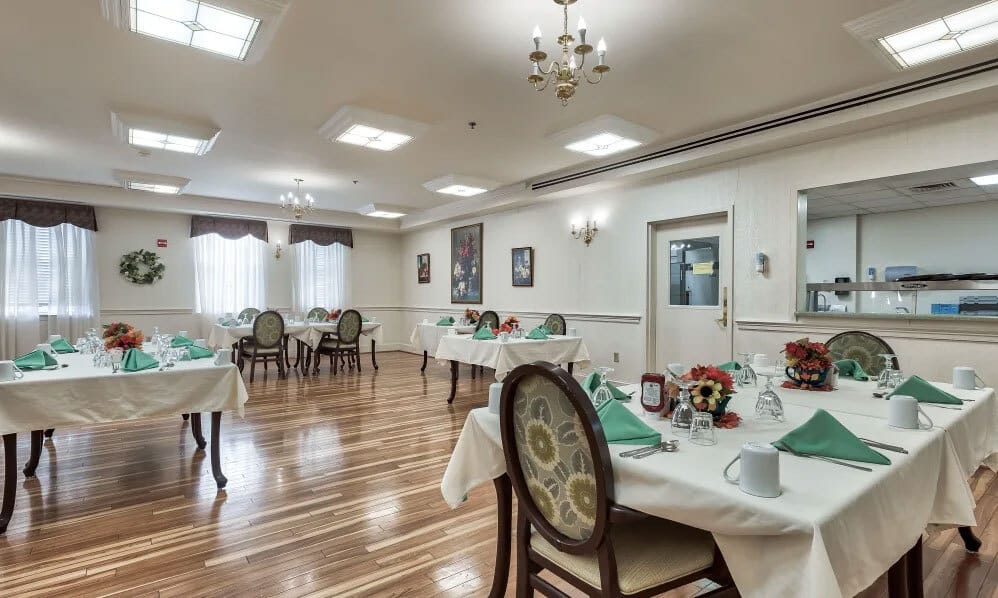
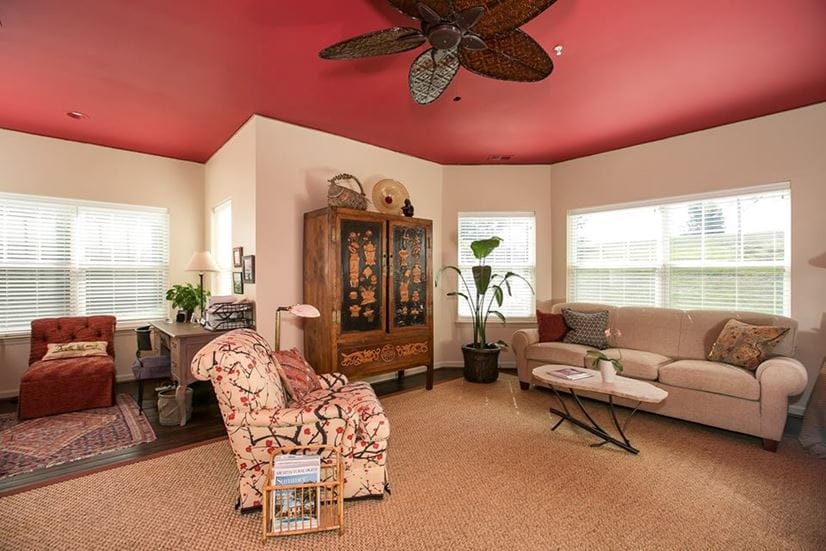
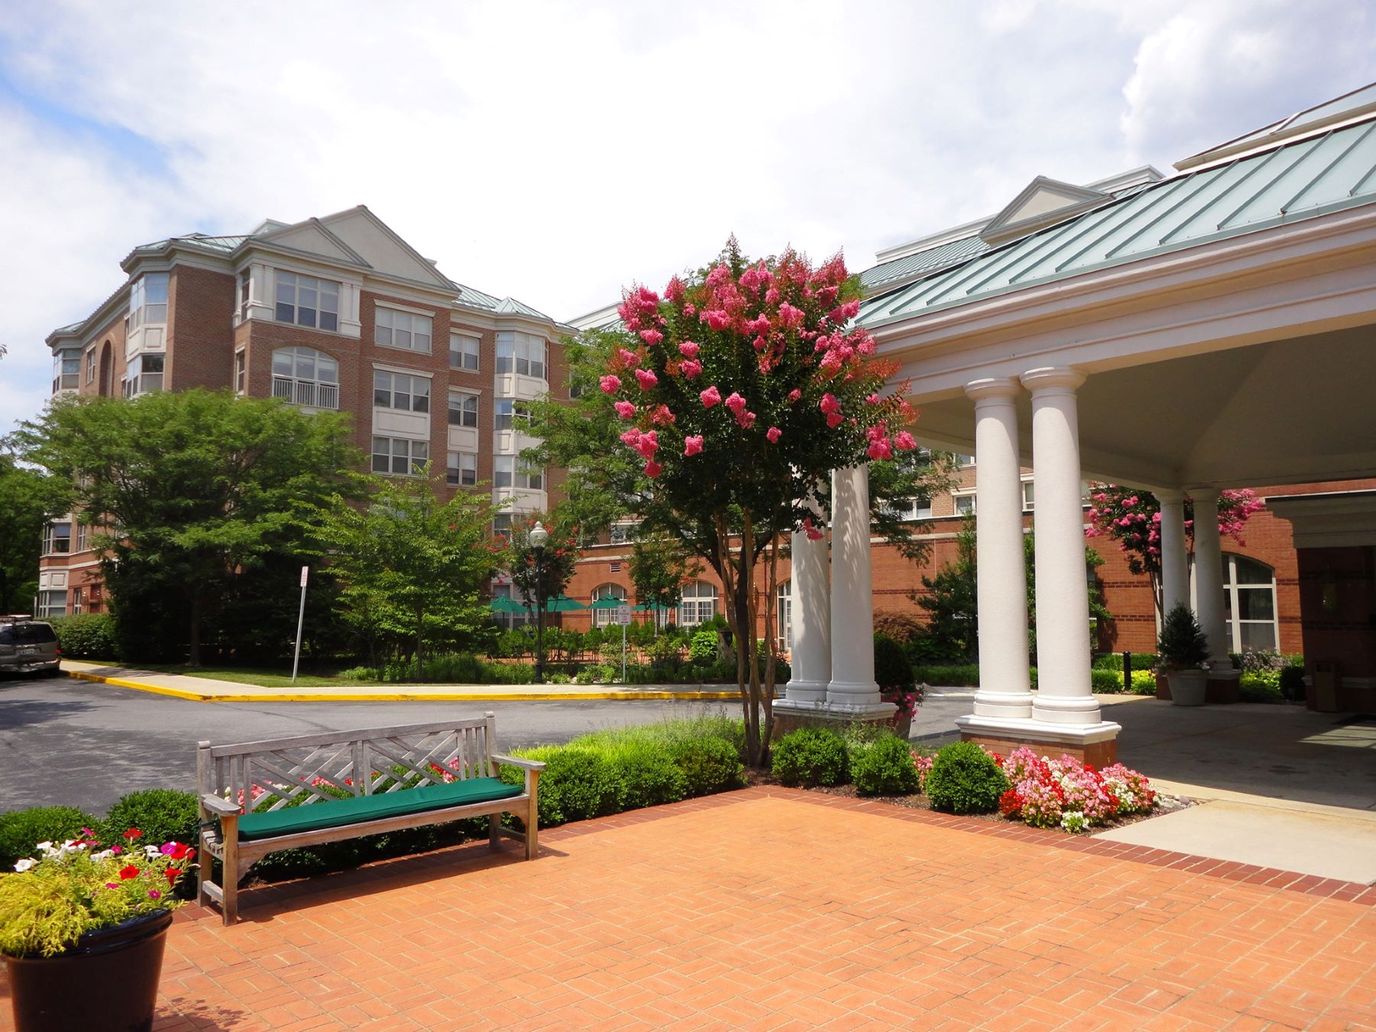
Live your best years at Edenwald Senior Living, an esteemed community in Towson, MD, offering independent living. The community also provides assisted living, memory care, and nursing care, ensuring residents can easily access healthcare when needs arise. Residents also enjoy hassle-free living with maintenance services and plenty of convenient apartment features.
A well-thought-out calendar of engaging activities and enriching programs is conducted, encouraging residents to live actively and make new friends. Residents have the finest dining experience with multiple dining venues that cater to their dietary needs and preferences. The community is ideal for those seeking independence in retirement, especially with its vibrant and welcoming environment.
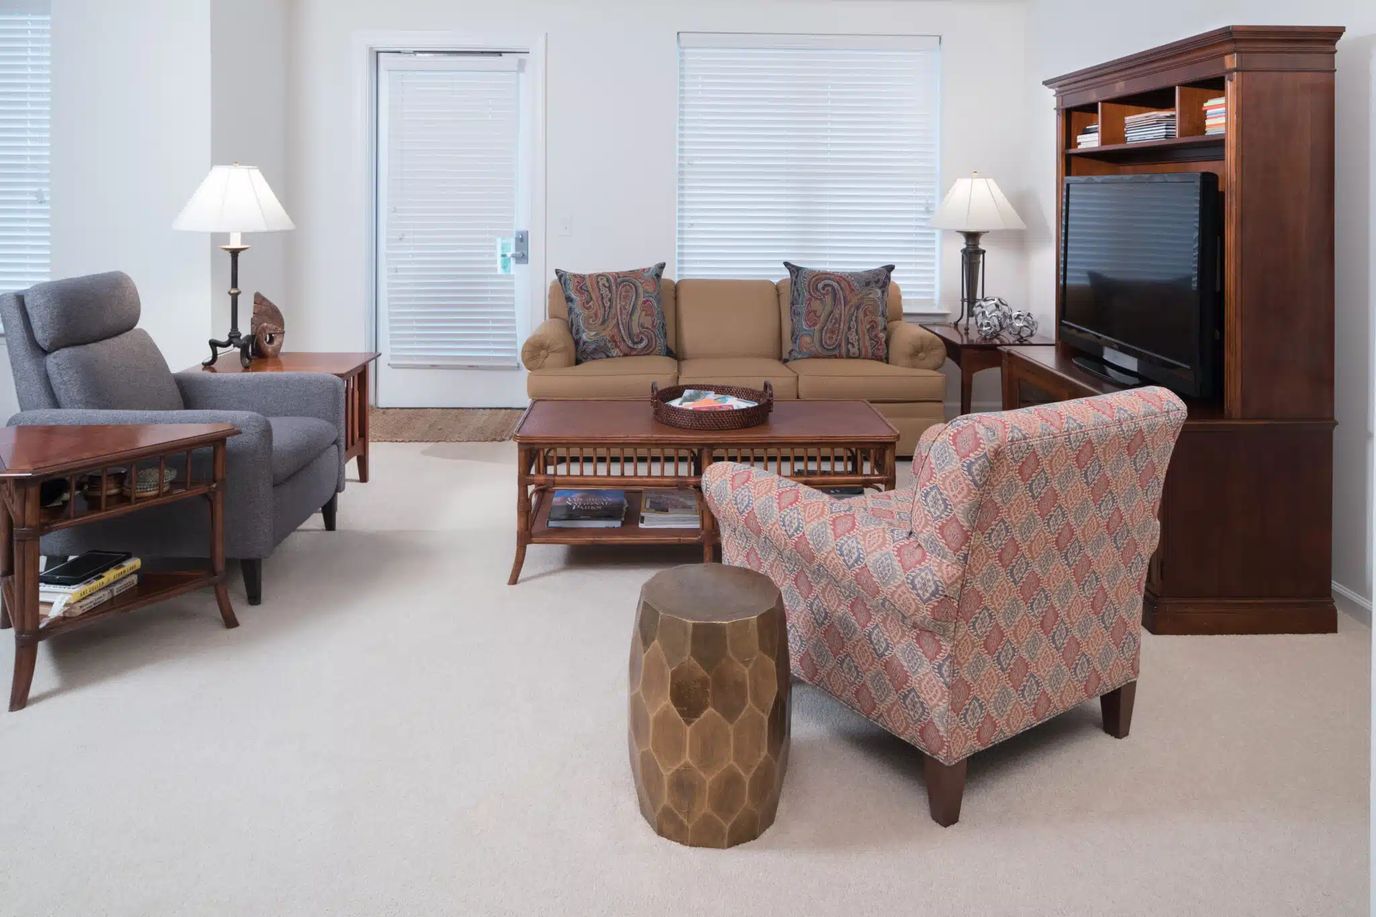
Enjoy your golden years at Homewood Living Frederick, a blissful retreat set in the vibrant neighborhood of Frederick, MD, offering independent living. With a variety of beautifully furnished and cozy accommodations, residents can rest assured of living comfortably in retirement. The community also promotes a hassle-free lifestyle, helping with chores and maintenance.
Residents will not run out of things to do, with plenty of recreation sites and unique local shops in the area. Delightful restaurants provide residents with a variety of dining options that satisfy their dietary needs and preferences. With its vibrant and welcoming environment, residents are guaranteed to flourish in retirement.
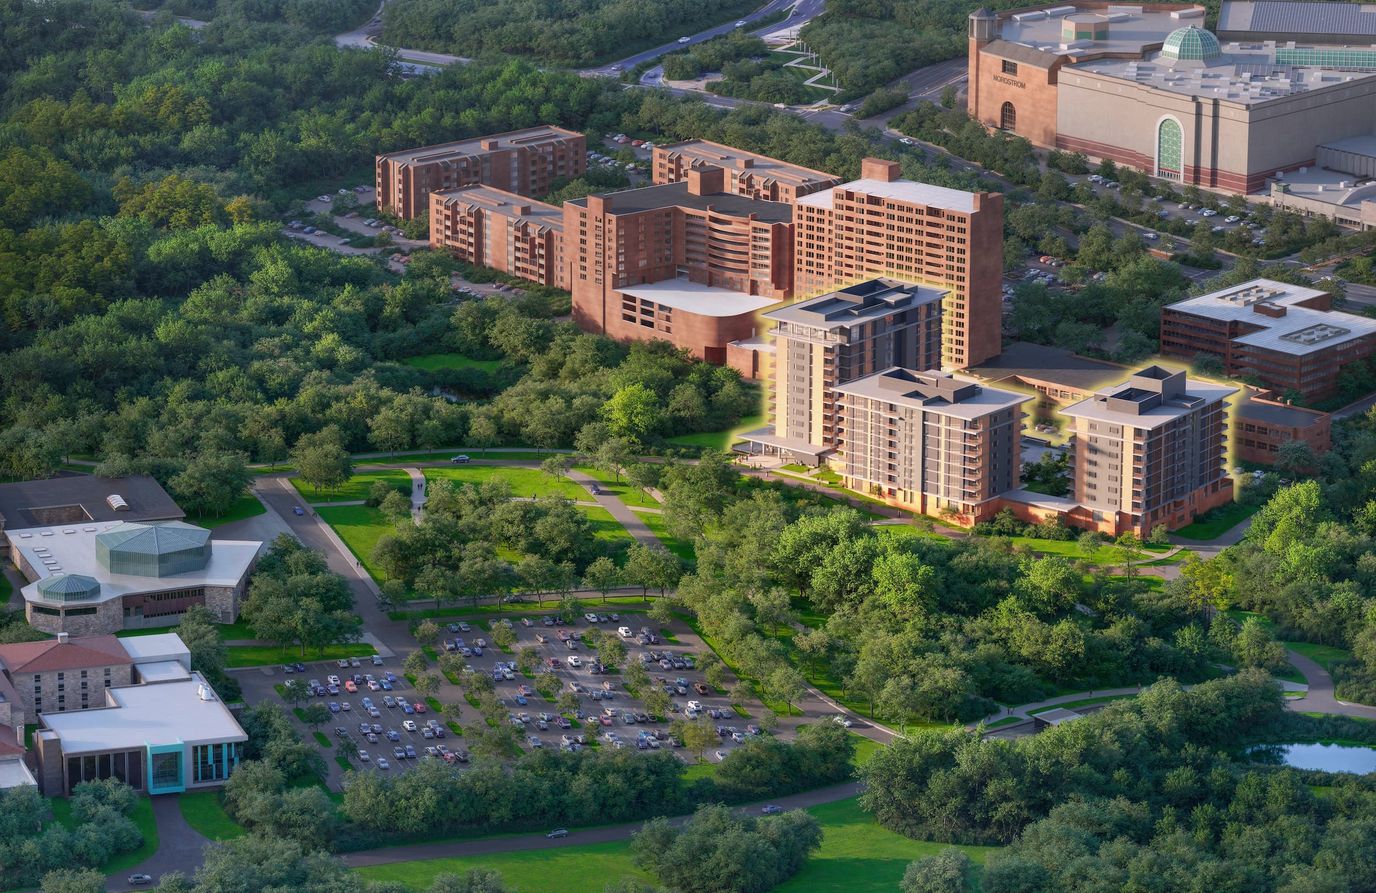
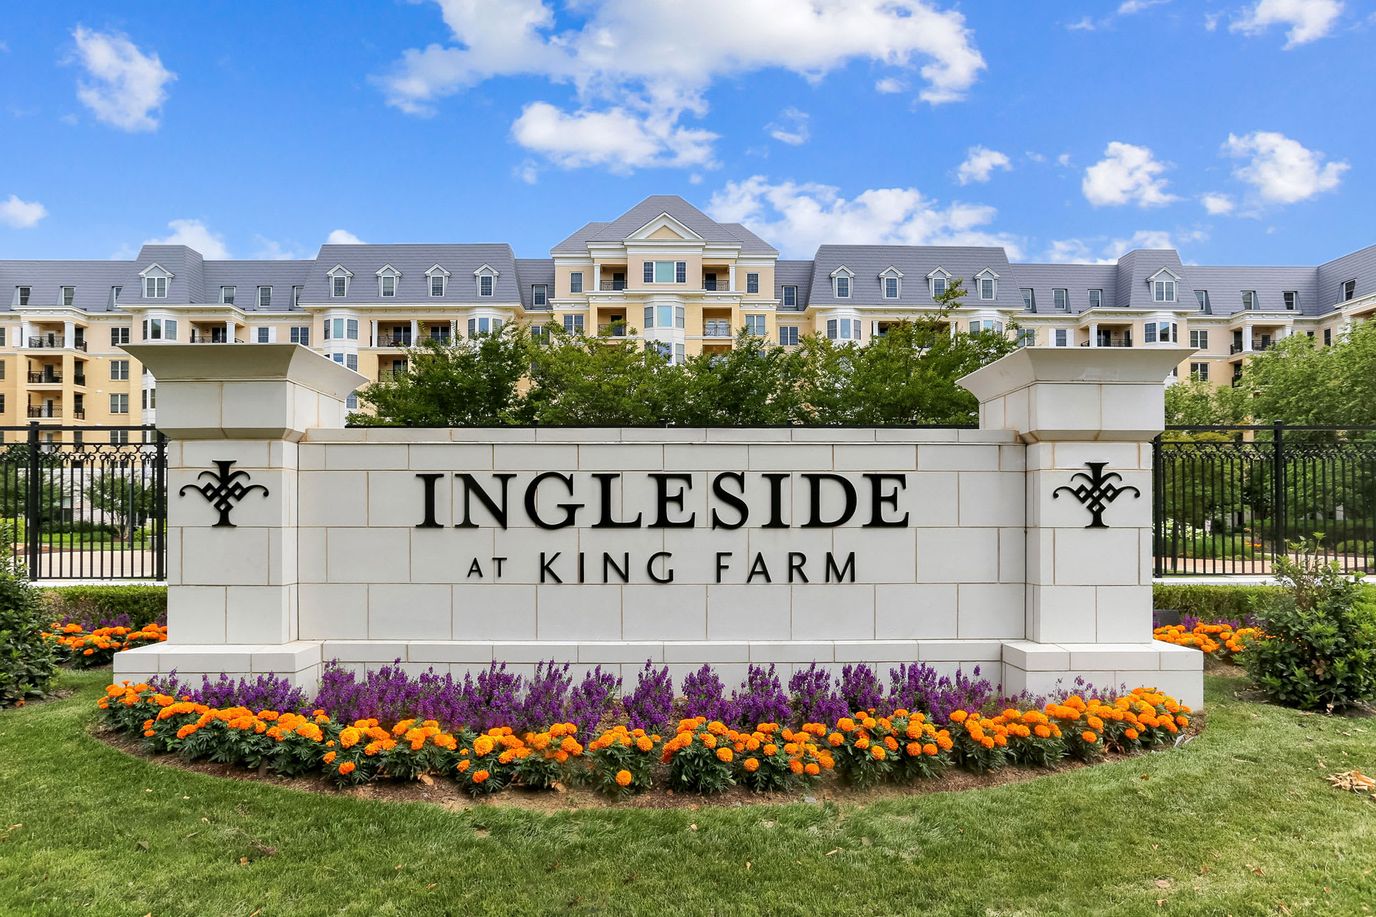
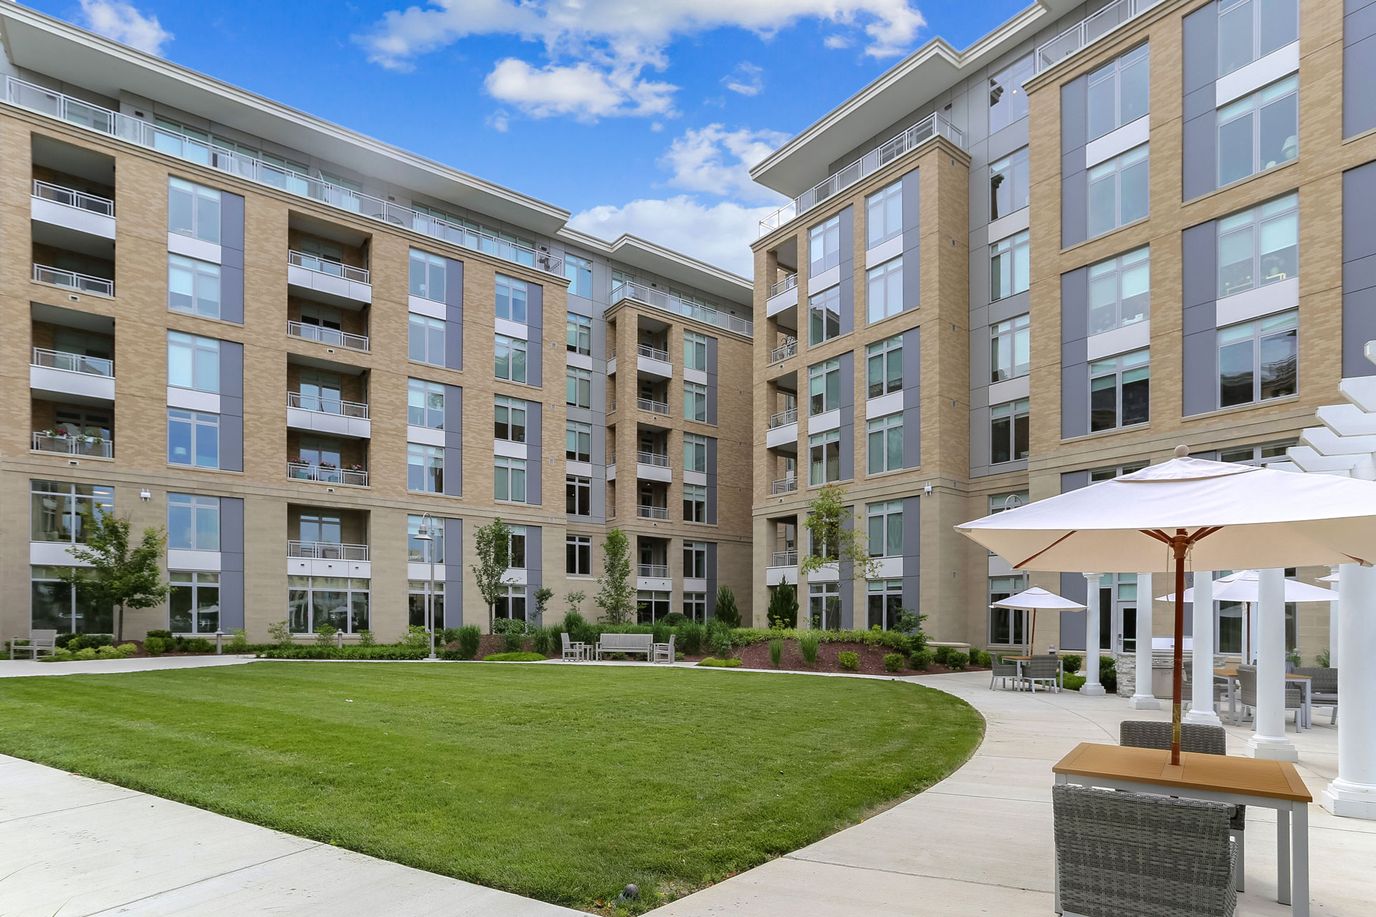
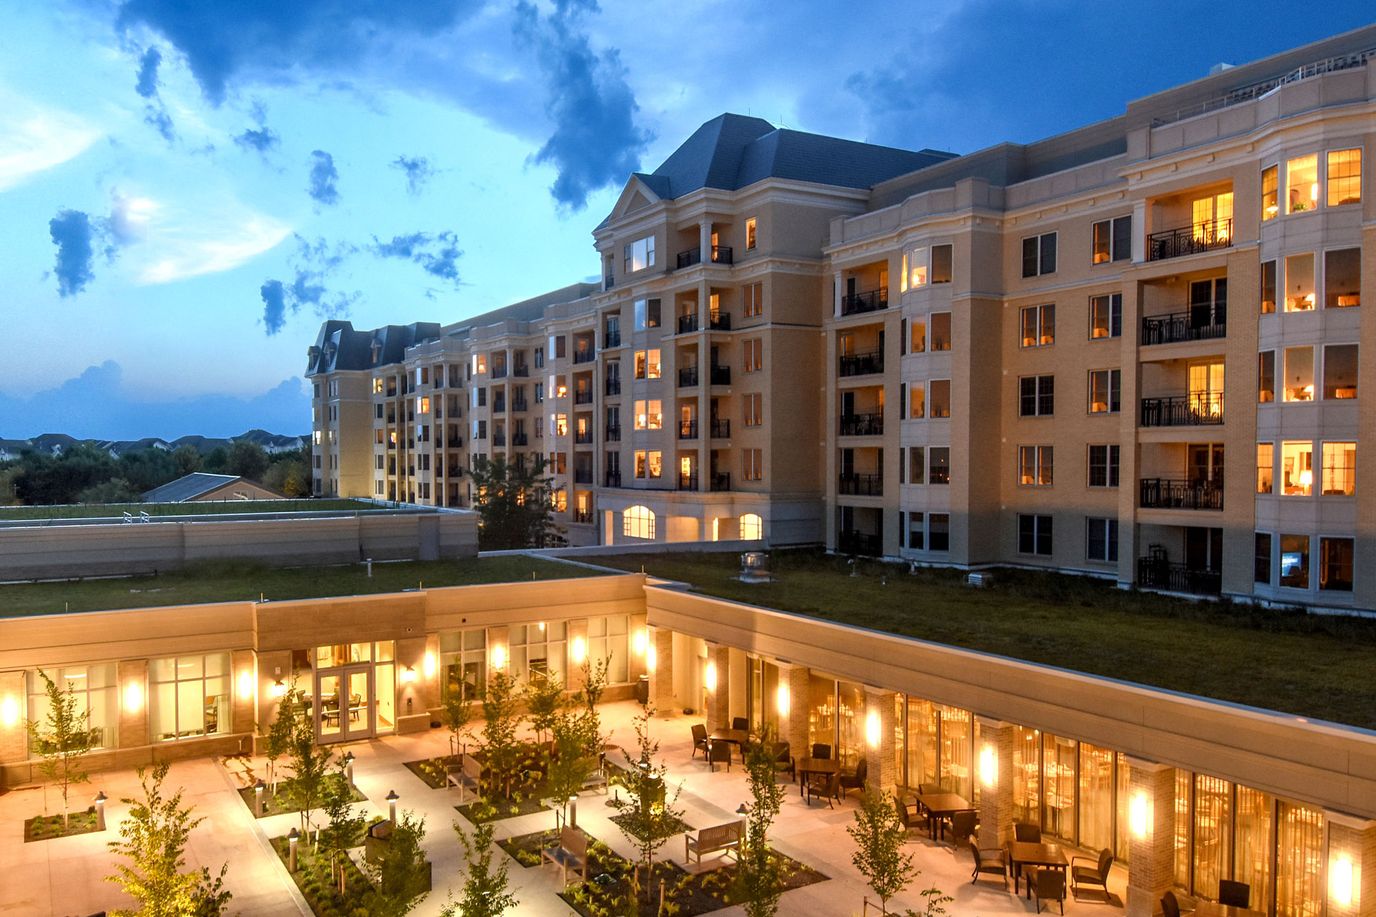
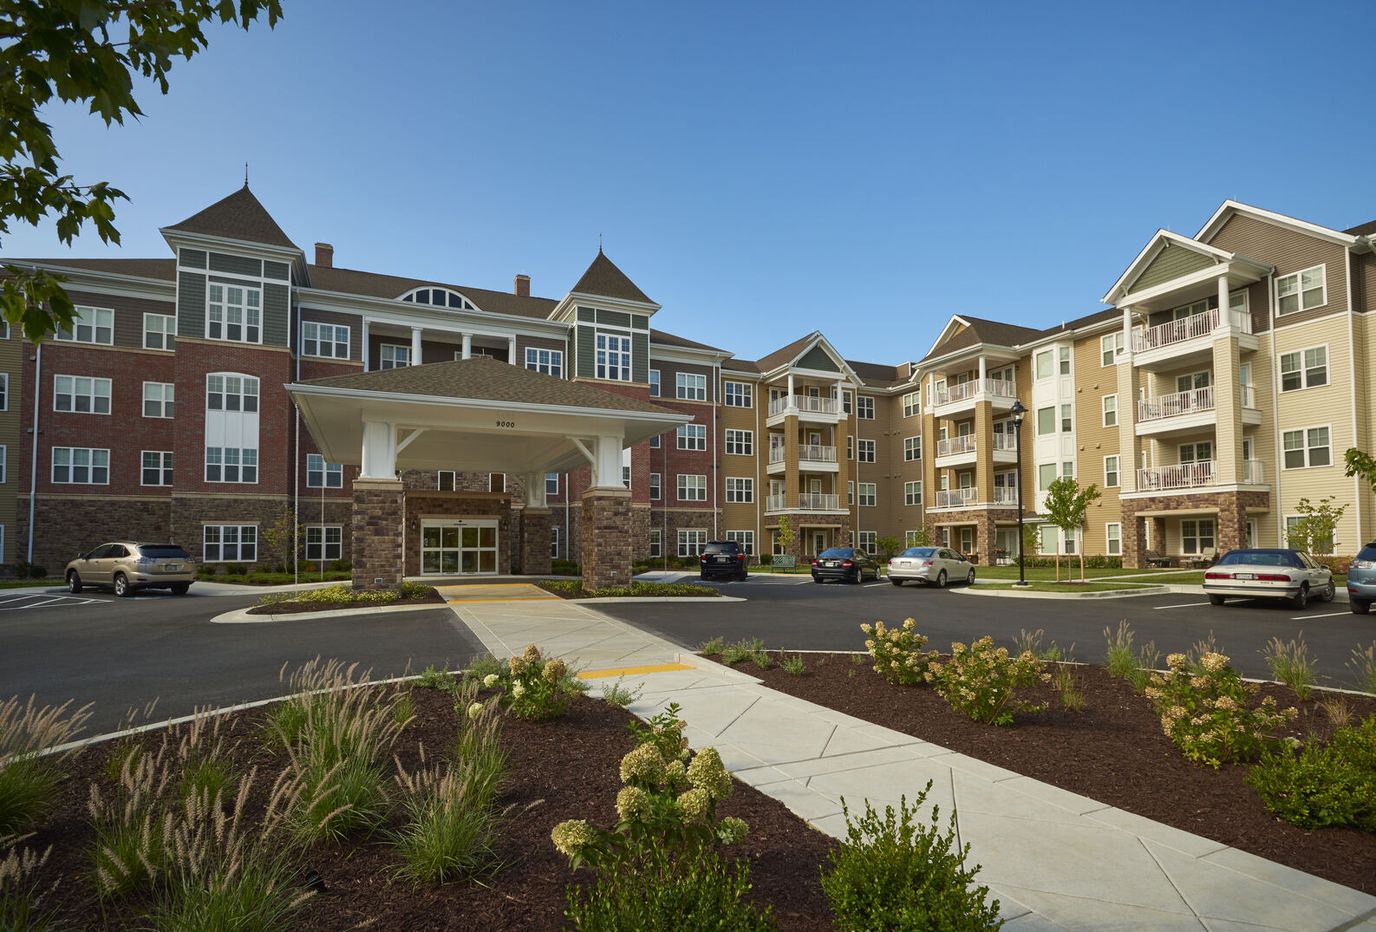
If you’re looking at Ingleside at King Farm in Rockville, you’re looking at a pretty well-organized facility. It’s located right in the King Farm neighborhood, and with a Walk Score of 73, it’s actually walkable; a rare and appreciated feature for a facility like this. Plus, it’s less than a mile and a half from Adventist HealthCare Shady Grove Medical Center, which is a major comfort factor if health needs shift suddenly.
The facility itself is a 45-bed building managed by the Westminster Ingleside King Farm team. They handle everything from nursing and assisted living to memory care and independent living, which is helpful because you don’t have to move if your care needs change. Their occupancy is at 92.2%, and the average stay is 139 days, suggesting they balance short-term rehab with long-term residents.
Most telling are the care hours: they provide 6 hours and 21 minutes of nursing care per resident every day. That’s a significant amount of attention for a facility this size. Kenya Bryant, the Executive Director, is currently working toward her license as a nursing home administrator, which adds another layer of professional oversight.
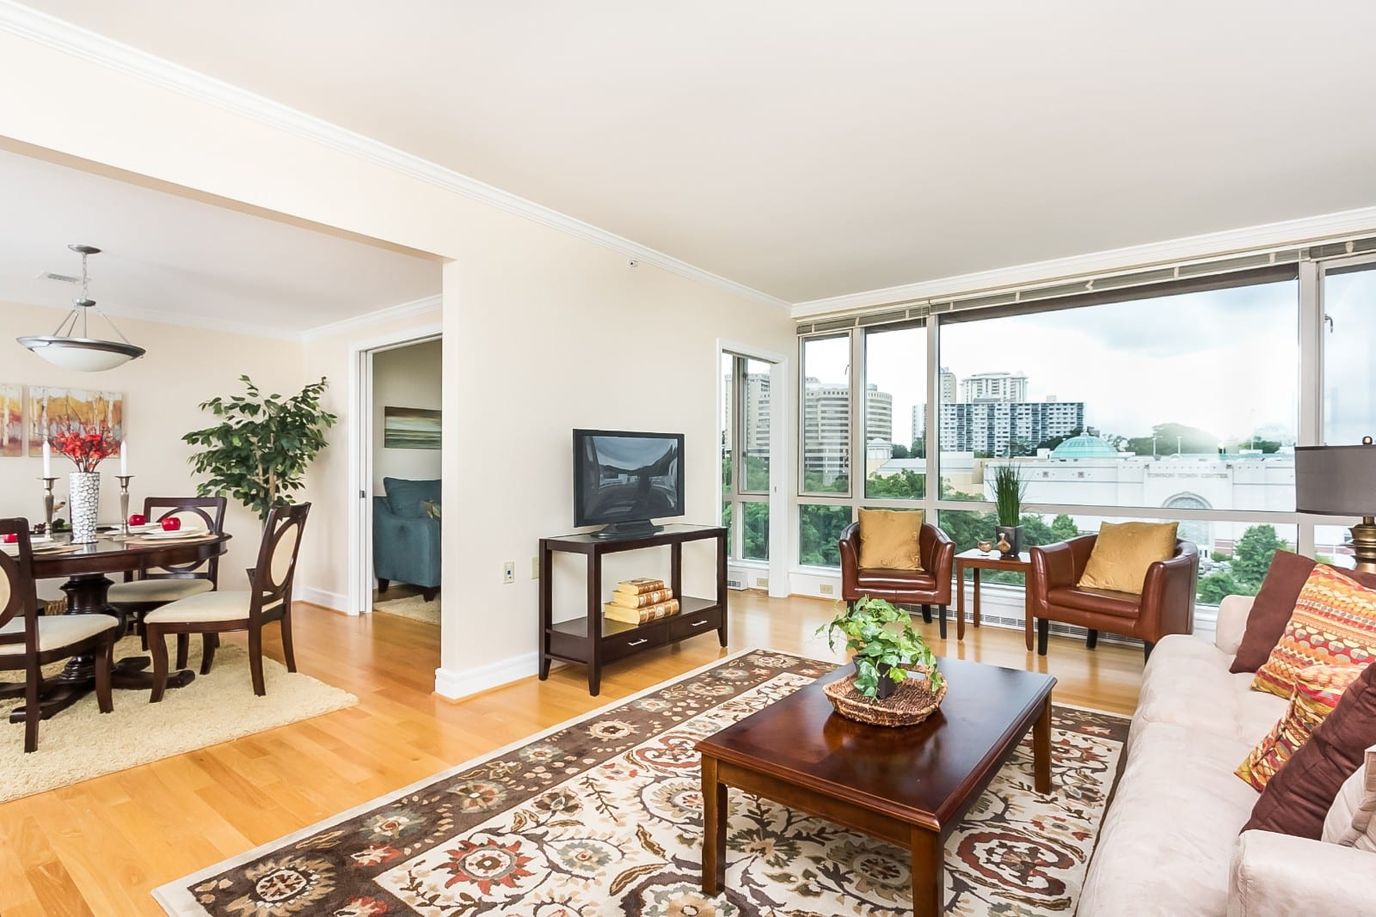
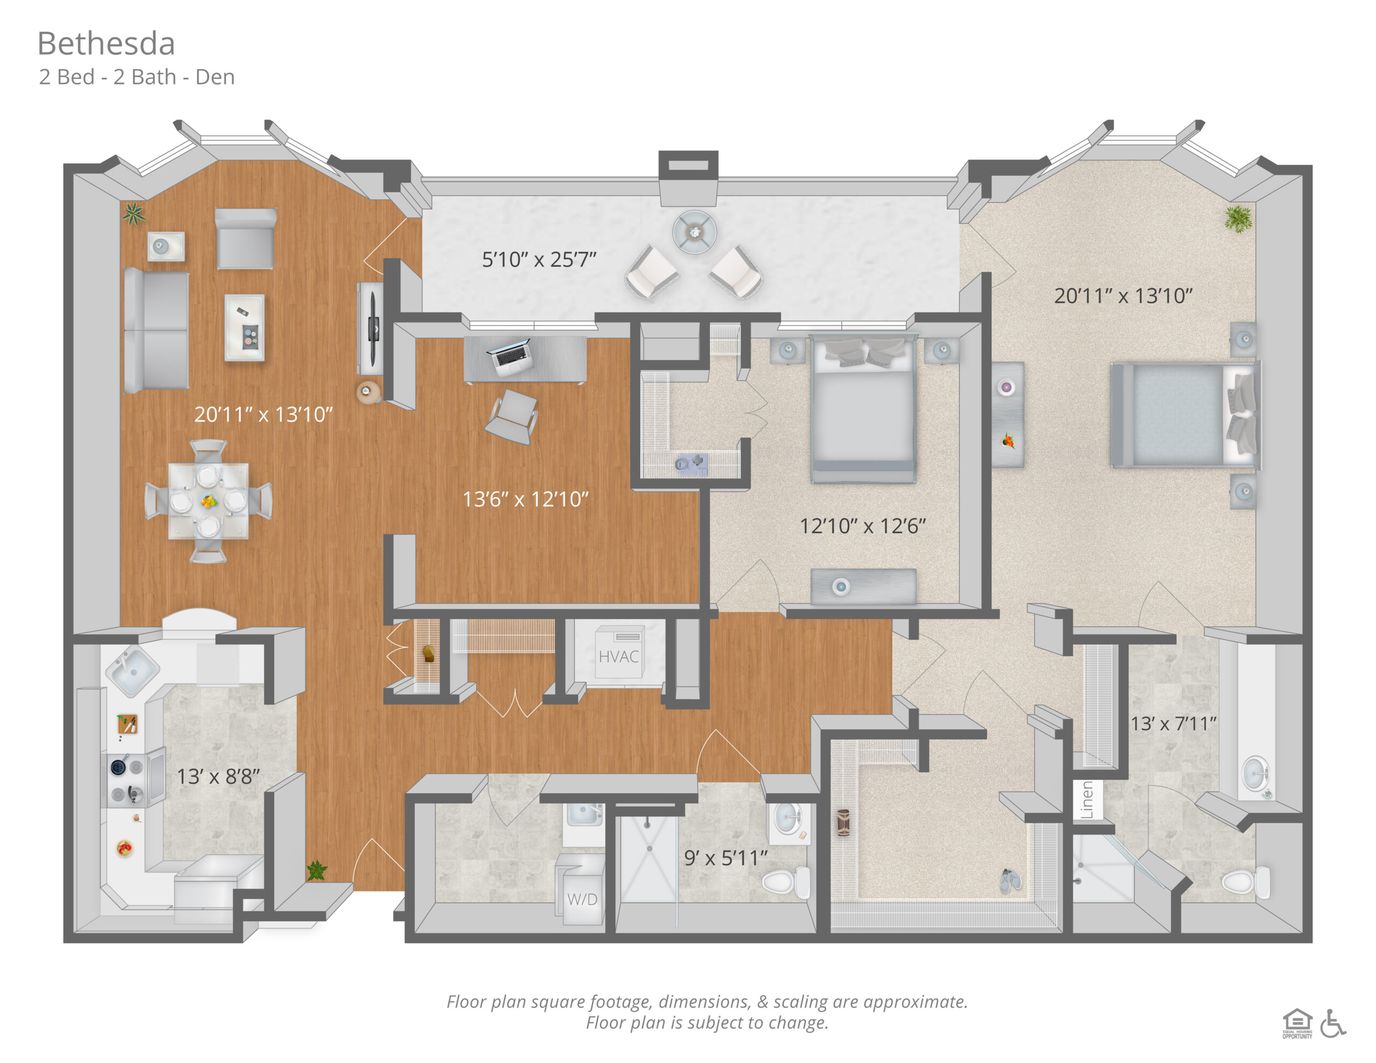
Financially, studios start at $3,638 per month, and you can scale up to $5,812 for a two-bedroom unit. They offer one-bedroom and one-bedroom-plus-den options in between, with units reaching up to 1,799 square feet. They accept both Medicare and private pay.
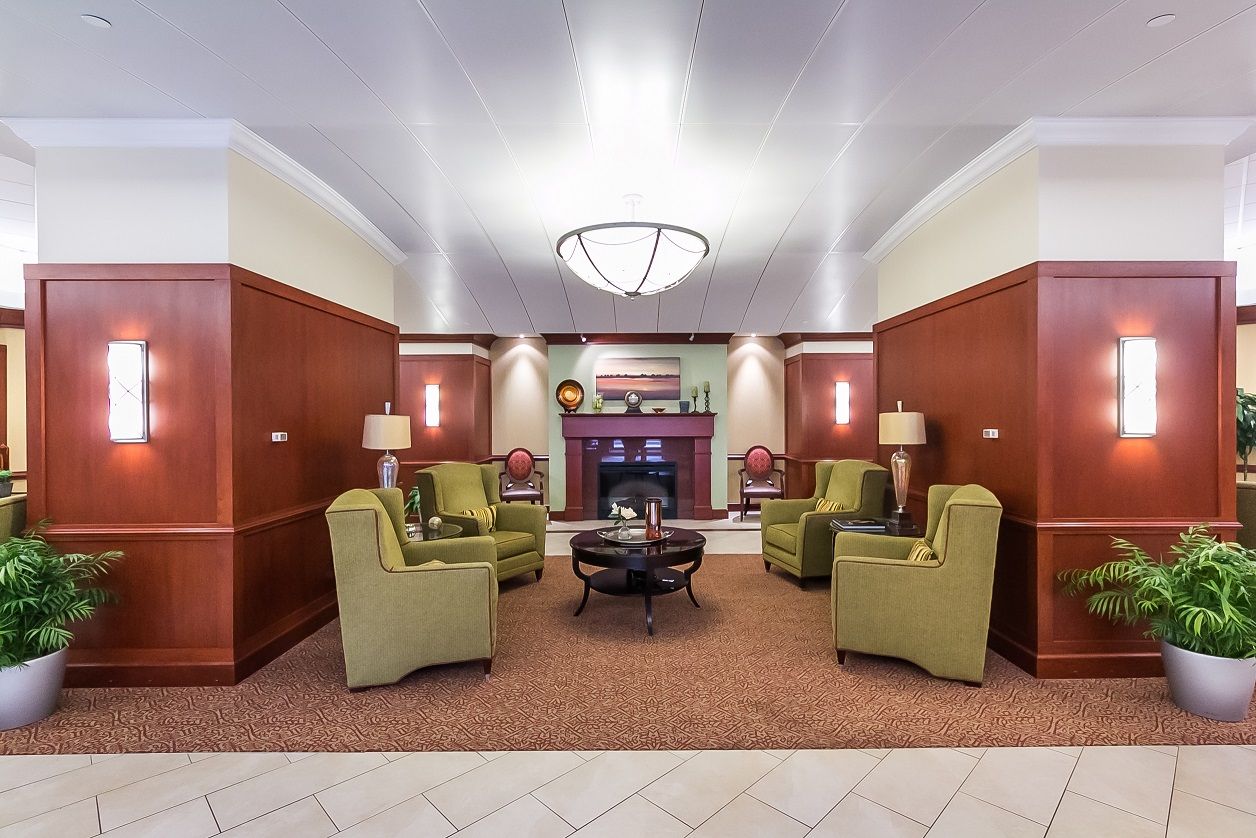
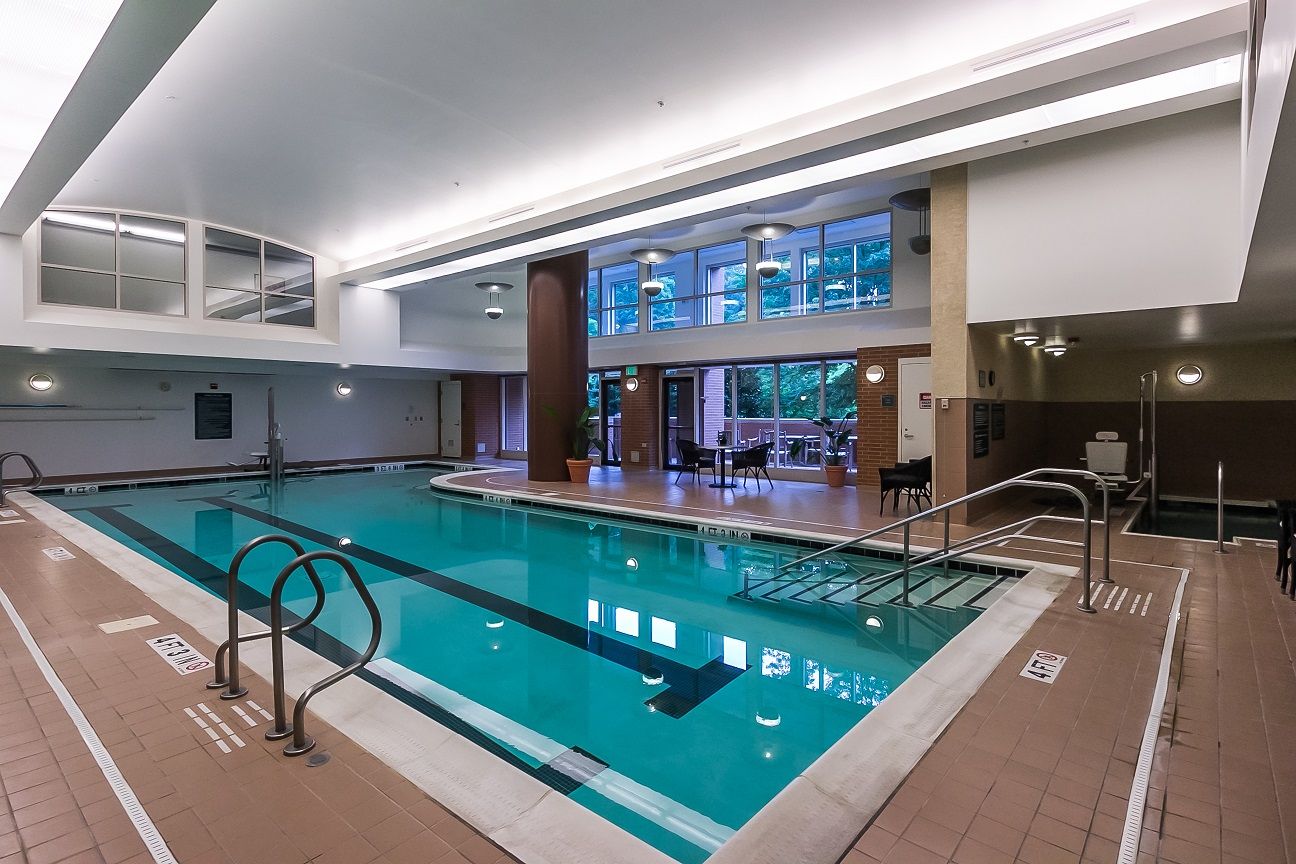
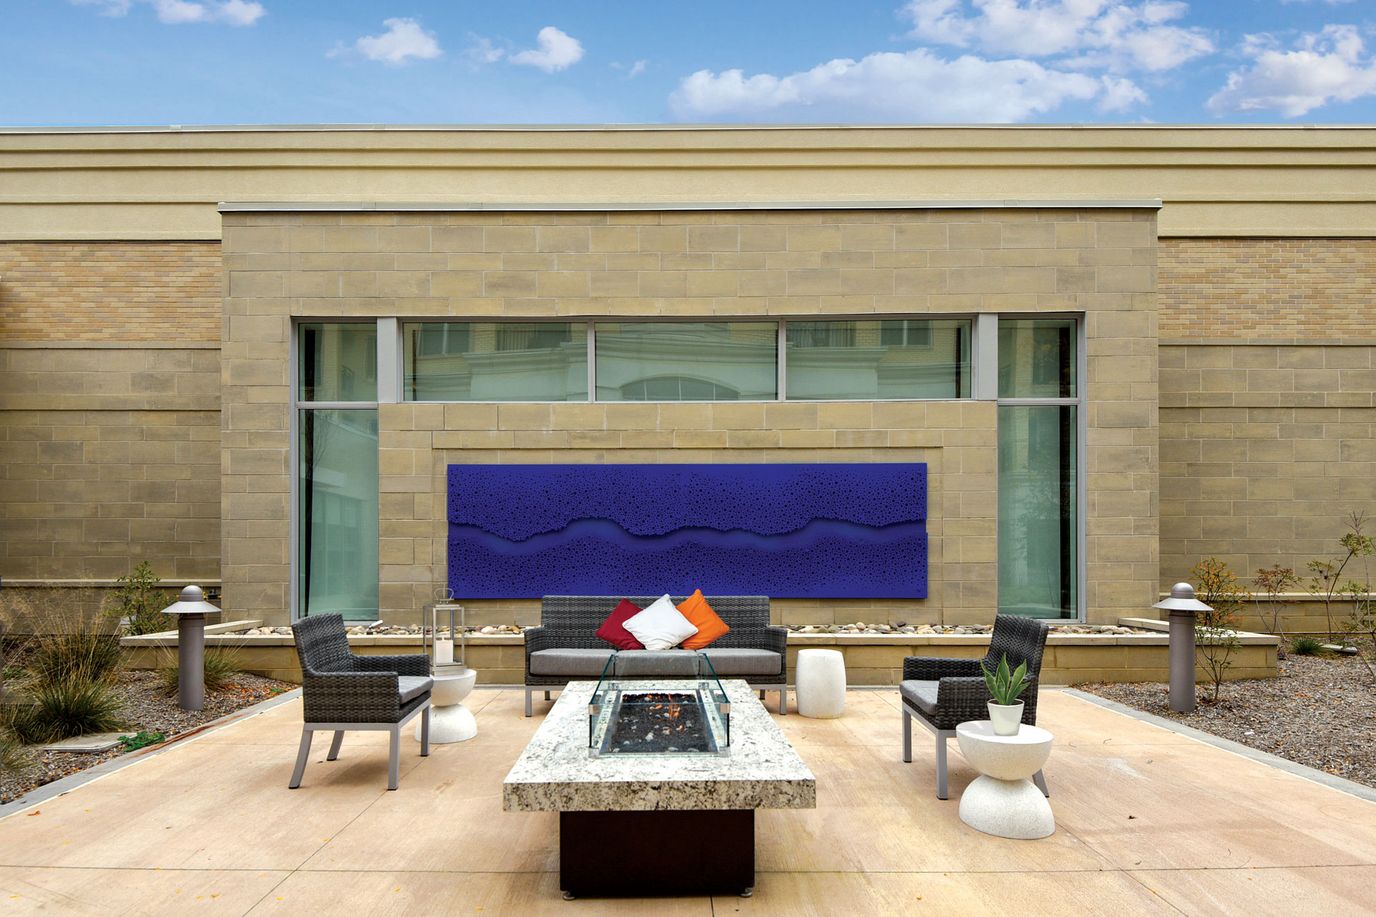
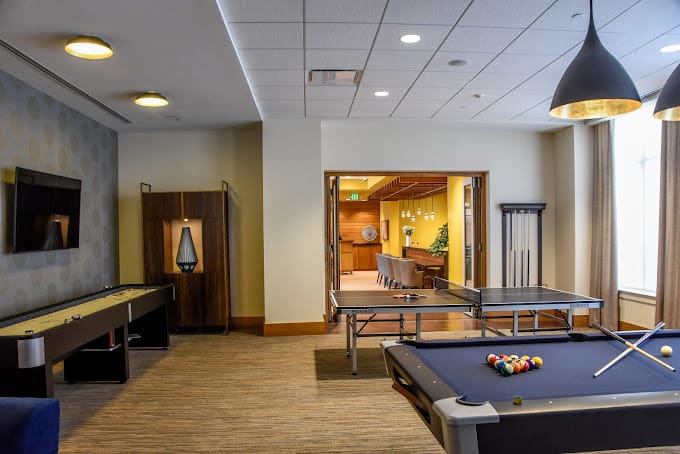
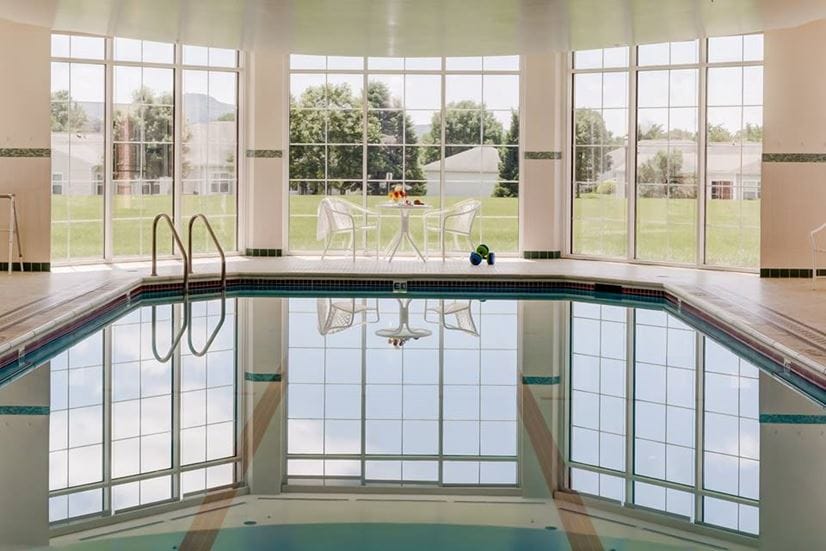
They have a heated indoor pool, a fitness center, and a cultural arts center. There’s an art studio, a library, and a dedicated meditation space. You’ll also find a coffee shop, a wellness center with an on-site doctor, and a courtyard with water features and a fire pit. It’s a pet-friendly community, and they even provide transportation and have a Social Day Program, which makes the whole living experience feel much more connected.
What really stands out, though, are the certifications. They have CARF accreditation, SageCare Platinum, and specific LGBTQ+ Long-Term Care Equality recognition. They’ve also landed on the “Great Place to Work” and “Fortune’s Best Workplaces in Aging Services” lists. If you’re prioritizing a place that has a full care continuum, keeps a dense amenity schedule, and has verified, institutional commitments to inclusive care, Ingleside is one of the more credible options in the Rockville area.
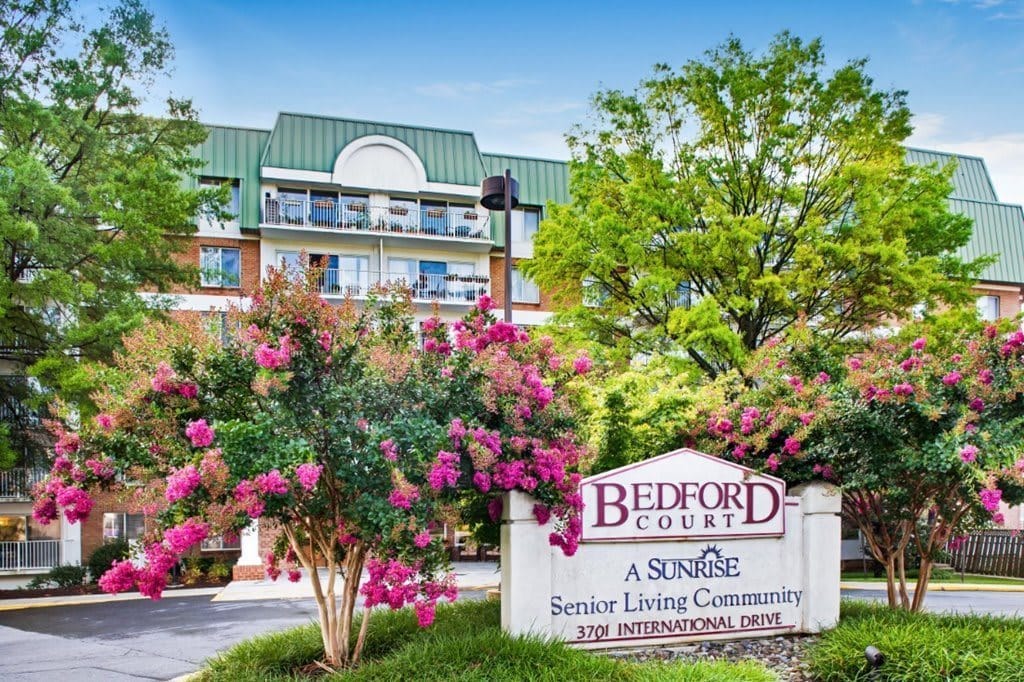
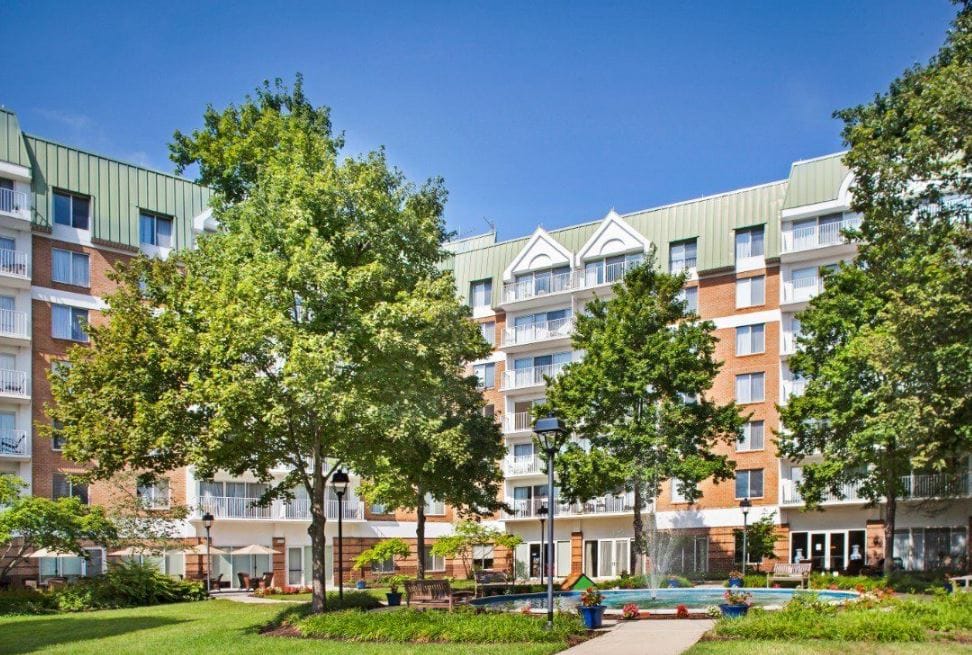
Bedford Court has been running in Silver Spring, Maryland for 34 years now, and it’s built around a simple idea: one community, several kinds of care. Independent living, assisted living, memory care, hospice, skilled nursing, rehab, it’s all under the same roof at 3701 International Dr.
The place itself has 76 beds spread across studios, one-bedrooms, and two-bedrooms in a mid-rise building, and right now it’s sitting at 77% occupancy, 58 beds filled. The average stay runs about 64 days, and the starting price is $3,893 a month.
Most people land here through Medicare, 90% of new admissions, usually for short-term rehab after something like a surgery or a fall. The typical Medicare stay is 27 days, so this is a community that does a lot of short, focused recovery work, not just long-term placement.
On staffing: residents get 32 minutes of RN time a day, 1 hour and 24 minutes from LPNs, and almost 3 hours from nurse aides, adding up to 4 hours and 48 minutes of total nursing care per resident, per day. That’s on top of rehab services, respite care, and round-the-clock staffing.
Day to day, there’s a spa, a dining room, a restaurant, a courtyard, a garden, a patio, billiards, transportation, and housekeeping. People do fitness classes, social events, resident groups. Walk Score is 66, moderately walkable, so a short list of errands can happen on foot without much fuss.
Put together, the numbers describe a community built for quick turnaround rehab care backed by a fuller continuum underneath it, the kind of place where a short stay and a long-term move both fit the same address.
Overview of Sterling Care Hillhaven Assisted Living and Memory Care


Situated in the heart of Adelphi, MD, the Sterling Care Hillhaven Assisted Living and Memory Care is an esteemed senior living community offering assisted living, independent living, memory care, long-term skilled nursing care, short-term rehabilitation, and dialysis services. Beautifully appointed and spacious accommodations with several floor plans are available for its residents. In terms of memory care, those with cognitive conditions undergo their Life Engagement Programming which aims to foster meaningful conversations and promote a fulfilling lifestyle.
With its top-of-the-line amenities and services, residents can enjoy the following: family lounge, beauty salon, expansive wellness/rehabilitation gym, specialized diets, cable television/telephone, free wi-fi, and smoke-free community. Moreover, the community offers medical services such as diabetes management, orthopedic therapy, and medication administration. Engage in planned daily activities including outings religious services, music concerts, table games, and exercise. Meet new companions and create unforgettable memories within the amazing shared spaces of this community. Equipped with the right tools and people, seniors are guaranteed an all-encompassing living experience with Sterling Care Hillhaven Assisted Living and Memory Care.
Buckingham’s Choice provides exceptional service for seniors of independent living, assisted, and memory care living. The nurturing environment empowers and enhances the quality of life for residents by tailored care to each unique individual. Personalized care caters to each individual’s needs while maintaining independence and individuality. Buckingham’s Choice offers a vibrant lifestyle for a graceful senior living experience.
They pride themselves on their unmatched level of care thanks to their remarkable staff who offer compassionate service. Community features include 24-hour care, delicious meals served three times daily, social activities, engaging events, housekeeping and laundry services, and optimum security provided.
Enjoy your best years at Lutheran Village at Miller’s Grant, an idyllic retreat in Ellicott City, MD, offering independent living, assisted living, short- and long-term care. The community strives to provide the utmost comfort and safety with beautifully furnished and cozy accommodations. Here, residents have a worry-free lifestyle with plenty of maintenance services and convenient apartment features.
Residents can spend their days as they please with a thoughtfully curated calendar of engaging activities and enriching programs. With multiple dining venues, residents enjoy delectable and healthy meals that cater to their dietary needs and preferences. Scheduled transportation is also provided for residents’ convenience. This pet-friendly community is a great option for those seeking independence in retirement, especially with its warm and inviting environment.
Recognized as the Best Senior Living Community by Bethesda Magazine readers for an impressive eleven consecutive years, Maplewood Park Place is the epitome of an exceptional living experience. Established in 1996 in Bethesda, Maryland, Maplewood stands as a resident-owned cooperative community exclusively designed for individuals aged 60 and above. With a wide array of spacious one-level floor plans, residents can choose their ideal living space tailored to their preferences. Nestled within a secure, wooded suburban neighborhood inside the Beltway, Maplewood offers an independent living experience characterized by a vibrant community atmosphere.
Maplewood Park Place prides itself on its rich activities, amenities, and superb dining options. With 24/7 security and concierge services, residents can enjoy peace of mind and feel fully attended to. The dedicated and engaging staff members are committed to ensuring a high level of care and attention. In addition to independent living, Maplewood also offers assisted living, skilled nursing care, personalized memory care, support, and on-site rehabilitation services to cater to the evolving needs of its resident owners. Qualified residents can benefit from the unique Lifecare Plan, which provides access to top-quality long-term health care and/or assisted living with manageable costs. At Maplewood Park Place, residents can embrace a fulfilling and enriching lifestyle surrounded by a welcoming community of peers.
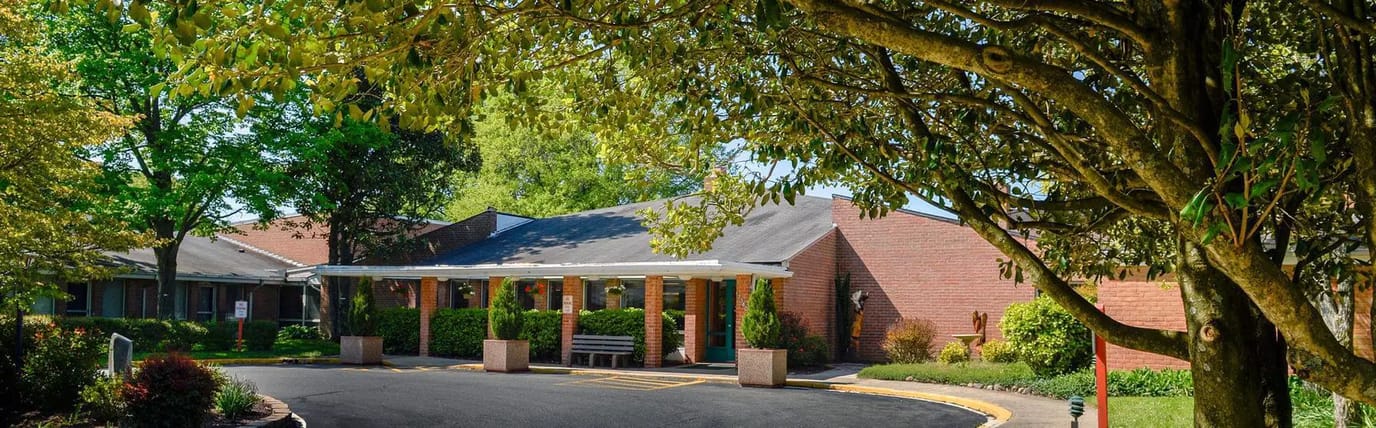
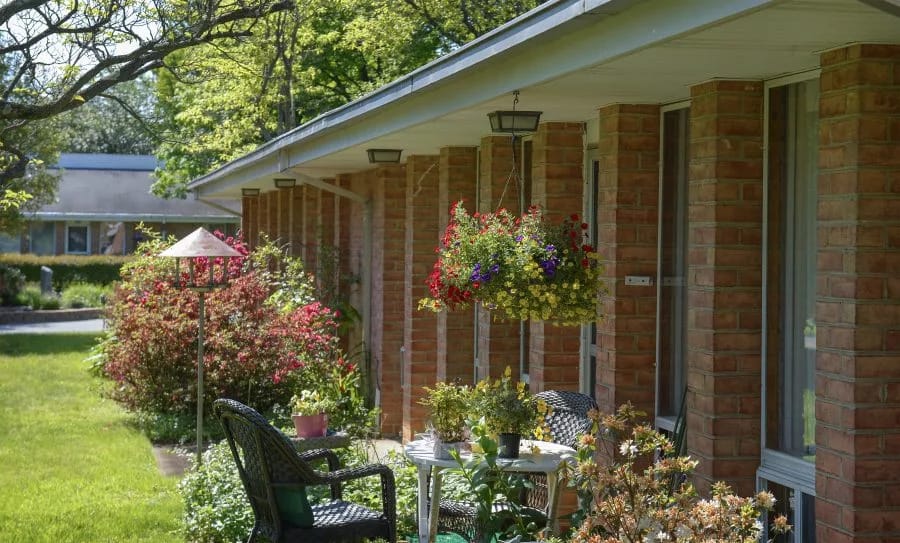
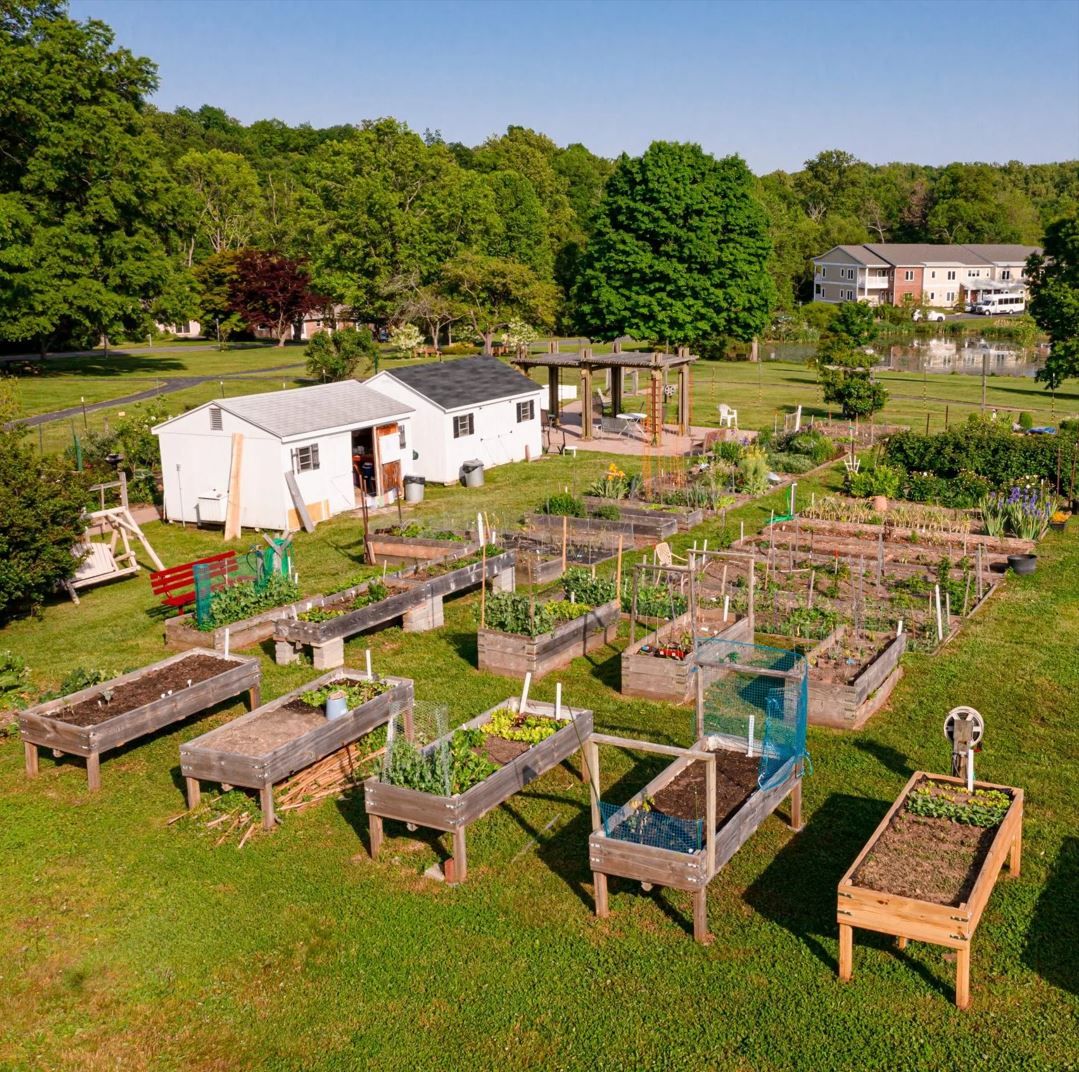
Nestled in Sandy Spring, Maryland, Friends House Retirement Community stands as a welcoming Life Plan Community, offering a relaxed and laid-back living experience in an exceptional location. This warm-hearted community takes pride in the positive emotional impact it brings to the lives of seniors and their families, cherishing the interactions and contributions they share with residents, teammates, local partners, and the broader community each day. At Friends House, diversity thrives, and long-term care options cater to varied needs, ensuring residents receive the care they require while relishing the vibrant community they call home.
For over half a century, Friends House has been a cherished home for older adults from diverse backgrounds, cultures, skills, and stories, regardless of income level. As a nonprofit entity rooted in community and equality, Friends House is steadfastly committed to serving all senior adults, fostering an inclusive environment that values every individual. Devoted to providing a fulfilling lifestyle within a safe and caring atmosphere, Friends House embraces a campus adorned with abundant gardens, diverse committees, services, and amenities that cater to all residents. The picturesque grounds feature fruit orchards and offer excellent apartment living options for those seeking independent living.
Ranking Methodology
How we rank these assisted living communities
Every community above is evaluated across six weighted categories using public data including state inspection records, review platforms, BBB profiles, and operator-published materials.
Weighting overview
- 35%Resident Experience
- 25%Regulatory
- 15%Visual Media
- 10%Website
- 10%Stability
- 5%Environment
01
Resident & Family Experience 35%
The single largest share of every ranking. Aggregated review sentiment and volume from major platforms — the closest signal to real resident experience.
- Includes
- Review Sentiment
- Review Volume
02
Regulatory & Safety Record 25%
State inspection records, citations, and complaint visits. We weight per-inspection rates more heavily than raw counts.
- Includes
- State Inspections
- Citations/Inspection
- % Inspections w/ Citations
- Complaint Visits
- Accreditations
- BBB Rating
03
Visual Media & Transparency 15%
Communities that publish high-quality visuals give families a real preview. No photos or tours = a negative transparency signal.
- Includes
- Video Tours
- Virtual Walkthroughs
- Photo Quantity
- Photo Quality
04
Website & Operator Transparency 10%
Site quality and whether the operator publishes basic accountability information — staff names, contact details, ownership.
- Includes
- Website Content
- Mobile Usability
- Staff Info Available
- Owner Info Available
05
Community Stability 10%
Operational signals indicating whether a community is well-run and meeting demand.
- Includes
- Occupancy Rate
- Bed Options
06
Environment & Pricing 5%
Walkability and pricing transparency. Walk Score is weighted higher for Independent Living than for Memory Care, where most residents do not leave unaccompanied.
- Includes
- Walk Score
- Pricing Transparency
Who we are
Your Senior Care Partner, Every Step of the Way
We help families find affordable senior communities and unlock same day discounts, Medicaid, and Medicare options tailored to your needs.
Contact us Today
Frequently Asked Questions about Assisted Living in Maryland
What's the difference between assisted living and memory care in Maryland?
Assisted living in Maryland supports residents with daily activities (bathing, dressing, medication management) while preserving independence. Memory care is a specialized form of assisted living for residents living with Alzheimer's or dementia, and adds 24/7 secured environments, dementia-trained staff, and structured routines designed to reduce confusion and wandering.
What's the difference between assisted living and a nursing home in Maryland?
Assisted living in Maryland is a residential model focused on housing, hospitality, and help with daily activities. Nursing homes (skilled nursing facilities) provide 24/7 medical care from licensed nurses for residents with significant health needs, and are regulated more strictly under both state and federal CMS rules.
Does Maryland Medicaid cover assisted living?
Maryland Medicaid does not directly pay room-and-board for assisted living, but most states (including Maryland) offer Home and Community-Based Services (HCBS) waivers that can offset the cost of care services delivered inside a licensed community. Eligibility, waitlists, and covered services vary — check directly with the state Medicaid agency.
What is assisted living?
Assisted living combines private or semi-private apartments with help on activities of daily living (meals, bathing, dressing, medication management) and a social calendar — for residents who need some support but do not need 24/7 medical care.
How many assisted living facilities are listed on this page?
This page features 818 assisted living facilities in Maryland. Use the filters and comparison tools above to compare ratings, amenities, and pricing.
How do I choose the right assisted living facility in Maryland?
Start by matching the level of care offered to the resident's current and anticipated needs, then compare licensing status, staff-to-resident ratios, recent inspection results, and pricing. Tour at least two or three communities in Maryland, talk to current residents and families, and confirm what is included in the base rate versus billed as add-on services.
What should I look for when visiting assisted living facilities in Maryland?
Pay attention to staff interactions with residents, cleanliness and odor, food quality at meal times, the activity calendar, and how questions about pricing and care plans are answered. Ask to see the most recent state inspection report, the move-out / level-of-care-change policy, and a sample monthly bill that lists every fee.
Updated on
