Villa Springfield Rehabilitation and Healthcare Center
Nursing Home, Memory Care & Respite Care · Springfield, OH
CMS overall rating Info CMS (the Centers for Medicare & Medicaid Services) is the federal agency that rates nursing home quality. Its Overall Rating runs from 1 to 5 stars, combining health inspections, staffing, and quality measures, with inspections weighted most heavily.

Villa Springfield Rehabilitation and Healthcare Center

Nursing Home, Memory Care & Respite Care · Springfield, OH
CMS overall rating Info CMS (the Centers for Medicare & Medicaid Services) is the federal agency that rates nursing home quality. Its Overall Rating runs from 1 to 5 stars, combining health inspections, staffing, and quality measures, with inspections weighted most heavily.
Calculator: See prices in your area
Villa Springfield Rehabilitation and Healthcare Center accepts Medicare, Medicaid, and private pay.

Overview of Villa Springfield Rehabilitation and Healthcare Center

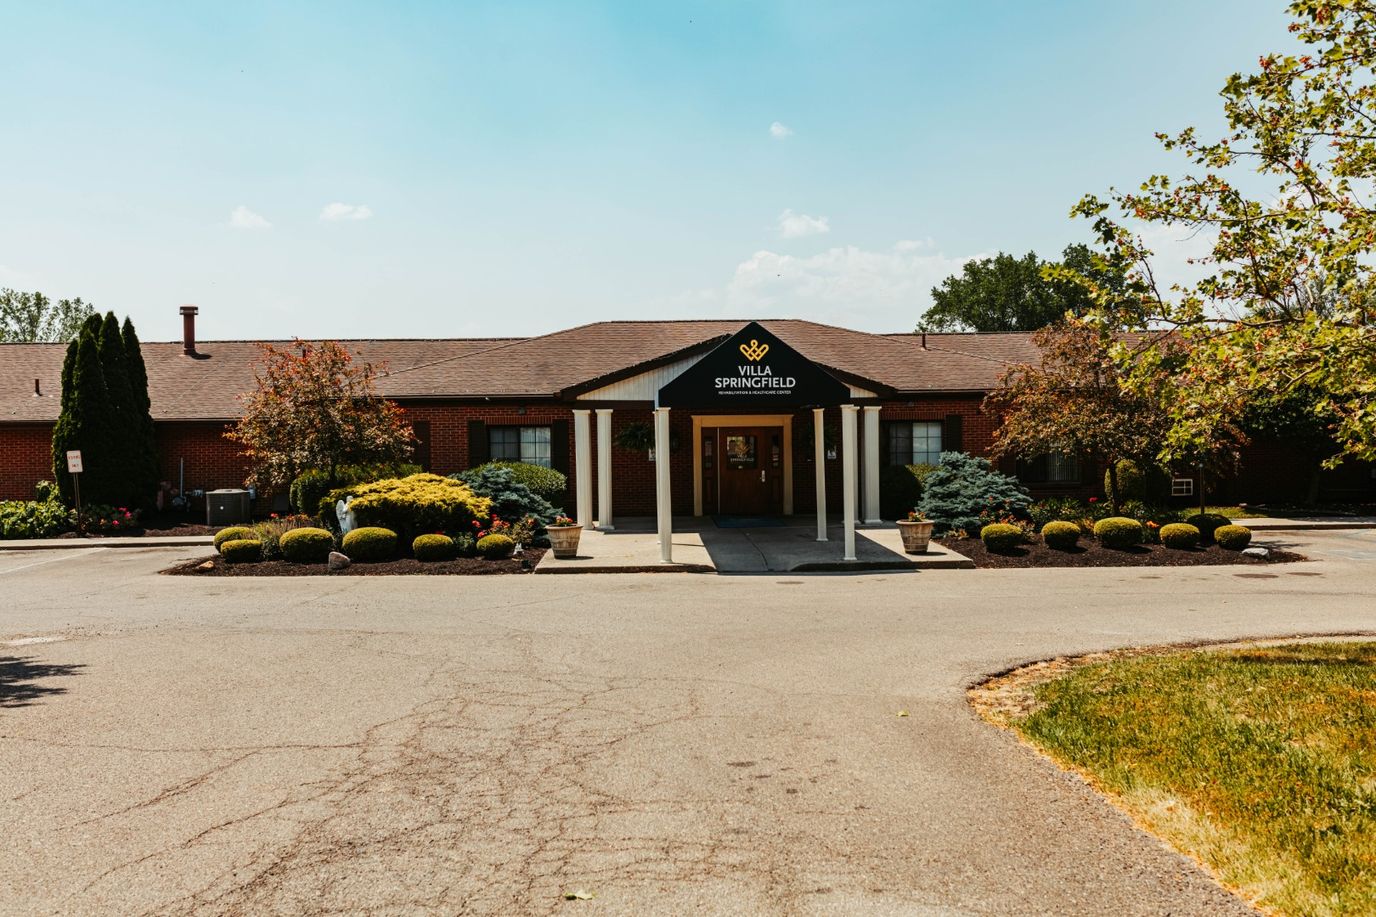
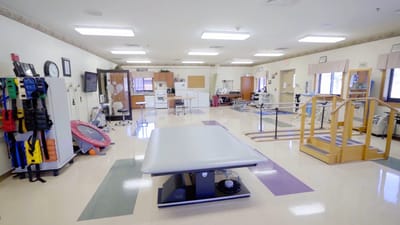
Villa Springfield Rehabilitation & Healthcare Center is a trusted nursing home in Springfield, OH, that offers subacute rehabilitation, long-term care, outpatient therapy, and respite care. With its comprehensive care options, residents receive care tailored to their healthcare needs around the clock. The community also provides physical, occupational, and speech therapy to help residents jump back to their routines.

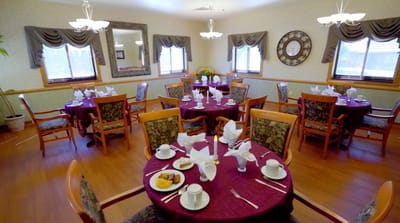
For residents’ recreation, a well-thought-out calendar of enriching activities and community events is conducted. Here, a variety of fine dining menus are also provided, striving to meet residents’ dietary needs and preferences. Pain management, psycho-social management, and hospice are also available to ease residents’ pain and discomfort. The community creates the ideal setting where residents can live beyond their potential, especially with its specially designed amenities and wide range of care services.

Quality ratings

Measured by Centers for Medicare & Medicaid Services (CMS)

Overall rating Info The Overall CMS Rating combines results from health inspections, staffing levels and quality measures. Health inspections carry the most weight. Staffing and quality scores can increase or decrease the final rating based on performance compared to state and national standards.
▼ 68.6% Below OH avg. ▼ 68.6% Below OH avg.OH average: 3.2Click the badge to see the full State ranking.Click here to see the full State ranking.
Health Inspection Info Based on the results of the facility's three most recent standard inspections and any complaint investigations. CMS reviews the number, scope, and severity of deficiencies, with more recent findings weighted more heavily.
▼ 28.6% Below OH avg. ▼ 28.6% Below OH avg.OH average: 2.8Click the badge to see the full State ranking.Click here to see the full State ranking.
Staffing Info Measures average nursing staff hours per resident per day, including Registered Nurses (RNs) and total nursing staff. Ratings are adjusted based on the level of care residents require and are compared to state and national benchmarks.
▼ 59.1% Below OH avg. ▼ 59.1% Below OH avg.OH average: 2.4Click the badge to see the full State ranking.Click here to see the full State ranking.
Quality Measures Info Based on clinical and physical health indicators reported to CMS, such as hospital readmissions, falls, pressure ulcers, and improvements in mobility. These measures reflect how well residents' health needs are being managed.
▼ 8.2% Below OH avg. ▼ 8.2% Below OH avg.OH average: 4.4Click the badge to see the full State ranking.Click here to see the full State ranking.

Staffing hours breakdown

Info Daily nursing hours per resident by staff type, reported to CMS. Higher is generally better — compare this facility to state and national averages to see where staffing stands.

Hours per resident per day — compared to Ohio state averages

Total nursing care / resident Info This home is ranked 190th out of 210 homes in Ohio for nurse hours. Total adjusted nursing hours per resident per day, combining RN, LPN, and aide time. CMS adjusts this for case-mix so facilities can be fairly compared.
2h 52m per day
Rank #190 / 210Nurse hours — State benchmarkedThis home is ranked 190th out of 210 homes in Ohio. Shows adjusted nurse hours per resident per day benchmarked to the Ohio average, with a ranking across 210 Ohio facilities. More hours mean more direct care. The national average is about 3.5 hrs; below 3.0 is a red flag.Rankings are based only on facilities in Ohio that report data for that category. Facilities without available data are excluded from the ranking.Click the rank badge to see the full State ranking.Click here to see the full State ranking.
This facility Ohio avg (3h 32m per day)
vs Ohio avg
-19%

6 of 6 metrics below state avg

Staff typeHours / Day / Residentvs state avg
Registered Nurse (RN) Info RNs hold the highest nursing license and can assess residents, interpret test results, and direct care plans. More RN hours per day often signals stronger clinical oversight and faster response to health changes. 26m per day ▼ 32% State avg: 38m per day · National avg: 41m per day
LPN / LVN Info Licensed Practical Nurses (LPNs) or Licensed Vocational Nurses (LVNs) deliver routine hands-on care — medication administration, wound dressing, and monitoring vital signs. They work under RN supervision and make up a large share of daily bedside care. 48m per day ▼ 17% State avg: 58m per day · National avg: 52m per day
Nurse Aide Info Certified Nurse Aides (CNAs) provide the most direct day-to-day assistance: bathing, dressing, feeding, and mobility. Nurse aide hours are typically the largest staffing category and directly affect residents' quality of life. 1h 54m per day ▼ 11% State avg: 2h 8m per day · National avg: 2h 21m per day
Weekend Total Nursing Info Combined nursing hours (RN + LPN + Nurse Aide) per resident per day on weekends. Staffing often drops on weekends — this figure reveals whether the facility maintains adequate coverage outside of weekday hours. 2h 54m per day ▼ 12% State avg: 3h 17m per day · National avg: 3h 26m per day
Physical Therapist Info Hours per resident per day provided by licensed Physical Therapists (PTs) or PT Assistants. PT services help residents recover mobility after injury or illness and are especially important for post-acute (short-stay) rehabilitation. 2m per day ▼ 33% State avg: 3m per day · National avg: 4m per day
Weekend RN Info Registered nurse hours specifically on weekends. Facilities sometimes reduce RN presence on Saturdays and Sundays — a low weekend RN figure compared to weekday hours can indicate reduced clinical oversight when most administrative staff are absent. 15m per day ▼ 40% State avg: 25m per day · National avg: 29m per day

Capacity and availability

This home usually has availability

Higher occupancy than the Ohio average: 78.7%
Occupancy rate
84.5% Rank #107 / 211Occupancy rate — State benchmarkedThis home is ranked 107th out of 211 homes in Ohio. Shows this facility's occupancy rate versus the Ohio average, with its Statewide rank out of 211. Higher occupancy signals strong local demand and financial stability.Rankings are based only on facilities in Ohio that report data for that category. Facilities without available data are excluded from the ranking.Click the rank badge to see the full State ranking.Click here to see the full State ranking.
Avg. Length of Stay
65 days
Bed community size
110-bed community Rank #61 / 323Bed count — State benchmarkedThis home is ranked 61st out of 323 homes in Ohio. Shows this facility's certified or reported bed count compared to other Ohio facilities. Larger communities may offer more amenities, programs, and on-site services for residents and families.Rankings are based only on facilities in Ohio that report data for that category. Facilities without available data are excluded from the ranking.Click the rank badge to see the full State ranking.Click here to see the full State ranking.
A larger shared setting that may offer more common spaces and organized community services.
Years in operation
41 years in operation
A longer operating history, which may indicate experience navigating regulations and delivering ongoing care.
Walk Score
Walk Score: 46 / 100 Rank #298 / 705Walk Score — State benchmarkedThis home is ranked 298th out of 705 homes in Ohio. Shows how walkable this facility's neighborhood is compared to the average Walk Score across Ohio facilities. Higher scores benefit residents, families, and staff.Rankings are based only on facilities in Ohio that report data for that category. Facilities without available data are excluded from the ranking.Click the rank badge to see the full State ranking.Click here to see the full State ranking.
Somewhat walkable. A few nearby services may be reachable on foot, but most trips require transportation.
BBB Rating
BBB Rating: A+ (Accredited)
An independent rating from the Better Business Bureau based on factors such as complaint history, transparency, and business practices.
How BBB ratings work

Staffing

Key information about the people who lead and staff this community.

Leadership

ContactMr. Bill Robinson, Executive Director/Administrator

Contact Villa Springfield Rehabilitation and Healthcare Center

Inspection History

In Ohio, the Department of Health, Bureau of Survey and Certification conducts unannounced onsite inspections to evaluate the quality of care and environment in all licensed facilities.

Since 2019 · 7 years of data 21 citations

Inspection Scorecard Info This scorecard compares key inspection, citation, and complaint metrics at this facility against the Ohio state average. Metrics rated ≥15% worse than average are highlighted in red; those ≥15% better are highlighted in green.

Since 2019 vs. Ohio state average
Overall vs. OH average 2 Worse Metrics worse than Ohio average:
• Total citations (950% above)
• Citations per year (900% above)
0 Better No metrics in this bucket.
Latest Inspection February 13, 2025 Routine

Citations Info Citations are formal regulatory issues recorded during state inspections.

This FacilityOH Averagevs. OH Avg
Total citations Info Formal regulatory issues recorded by inspectors across all inspection types. 212 This facility has 950% more total citations than a typical Ohio nursing home (21 vs. OH avg 2).↑ 950% worse
Citations per year Info Average citations per year since 2019. 30.3 This facility has 900% more citations per year than a typical Ohio nursing home (3 vs. OH avg 0.3).↑ 900% worse

Inspection Reports Summary Info An editor-reviewed summary of the themes and findings across this facility's recent inspection reports.

  • February 13, 2025 inspection found 11 deficiencies including failure to notify physicians of weight loss, improper insulin storage, incomplete care plans, and poor food safety practices.
  • Complaint investigations from 2023 to 2024 documented failures in medication administration, dignity violations, and incomplete wound assessments, showing recurring care and documentation issues.
  • The facility had no deficiencies in the June 20, 2019 annual inspection, but recent records show worsening compliance with resident care and infection control.

Health Inspection History

Inspections since 2022
Total health inspections 6

Ohio average 6.7


Last Health inspection on Feb 2025

Total health citations
21 Rank #72 / 210Health citations — State benchmarkedThis home is ranked 72nd out of 210 homes in Ohio. Shows this facility's total health deficiency citations benchmarked to the Ohio State average, with a ranking across all 210 OH facilities. Lower citation counts earn a better rank.Rankings are based only on facilities in Ohio that report data for that category. Facilities without available data are excluded from the ranking.Click the rank badge to see the full State ranking.Click here to see the full State ranking.

Ohio average 30.9

Citations per inspection
3.5 Rank #67 / 210Citations per inspection — State benchmarkedThis home is ranked 67th out of 210 homes in Ohio. Shows average deficiency citations per CMS inspection for this facility versus the Ohio mean across 210 facilities with citation data. Lower is better.Rankings are based only on facilities in Ohio that report data for that category. Facilities without available data are excluded from the ranking.Click the rank badge to see the full State ranking.Click here to see the full State ranking.

Ohio average 4.59


Health citations are formal notices following inspections when they fail to comply with safety and care standards.

17 of 21 citations resulted from standard inspections; and 4 of 21 resulted from complaint investigations.

Breakdown of citation severity (last 4 years)
Critical health citations
0
100% better than Ohio average

Ohio average: 0.3


Serious health citations
0
100% better than Ohio average

Ohio average: 0.9

0 critical citations Ohio average: 0.3

0 serious citations Ohio average: 0.9

21 moderate citations Ohio average: 29

0 minor citations Ohio average: 0.7
Citations history (last 4 years)
Infection Control moderate citation Feb 13, 2025
Corrected

Infection Control moderate citation Feb 13, 2025
Corrected

Nutrition moderate citation Feb 13, 2025
Corrected

Nutrition moderate citation Feb 13, 2025
Corrected

Staffing Data

Reporting period: October 1 – December 31, 2025 (Q4 2025). Source: CMS Payroll-Based Journal report.

Total staff 117
Employees 94
Contractors 23
Staff to resident ratio 1.26 : 1
38% fewer staff per resident than Ohio average
Ohio average ratio: 2.04 : 1 Ohio average ratio: 2.04 : 1See full Ohio ranking
Avg staff/day 45
Average shift 7.8 hours
0% compared with Ohio average
Ohio average: 8.1 hours Ohio average shift: 8.1 hoursSee full Ohio ranking
Total staff hours (quarter) 32,264

Nursing staff breakdown

Q4 2025 · Oct 1 – Dec 31 More info This data comes from the CMS Payroll-Based Journal report covering October 1 – December 31, 2025.
Registered Nurse

Manages medical care and health needs.

RN Staff Info 12 total: 11 full-time employees and 1 contractor. 12
Average shift length Info Average shift length. Calculated as total hours divided by days worked and average staff per day. 6.3 hours
Licensed Practical Nurse

Assists with medical care and medications.

LPN Staff Info 17 total: 11 full-time employees and 6 contractors. 17
Average shift length Info Average shift length. Calculated as total hours divided by days worked and average staff per day. 9.5 hours
Certified Nursing Assistant

Helps with daily care and mobility.

CNA Staff Info All 58 CNA Staff are full-time employees. No contractors work on this role. 58
Average shift length Info Average shift length. Calculated as total hours divided by days worked and average staff per day. 8.1 hours

Contractor staffing

Q4 2025 · Oct 1 – Dec 31 More info This data comes from the CMS Payroll-Based Journal report covering October 1 – December 31, 2025.

Total hours from contractors

16.4%

5,300 contractor hours this quarter

Licensed Practical Nurse: 6 Speech Language Pathologist: 6 Physical Therapy Aide: 4 Respiratory Therapy Technician: 3 Physical Therapy Assistant: 2 Registered Nurse: 1 Qualified Social Worker: 1

Staff by category

Q4 2025 · Oct 1 – Dec 31 More info This data comes from the CMS Payroll-Based Journal report covering October 1 – December 31, 2025.
Certified Nursing Assistant5805815,40792100%8.1
Licensed Practical Nurse116176,13092100%9.5
Registered Nurse111122,25192100%6.3
Speech Language Pathologist0661,6139199%7
Other Dietary Services Staff5051,3758491%7.6
Physical Therapy Aide0449638188%6.7
Clinical Nurse Specialist2029296470%8.2
RN Director of Nursing1016326773%9.4
Medication Aide/Technician2025625863%8.5
Dietitian1014876166%8
Mental Health Service Worker1014645863%8
Administrator1014485661%8
Nurse Practitioner1014405560%8
Respiratory Therapy Technician0332807379%3.7
Qualified Social Worker0111503336%4.5
Physical Therapy Assistant0221344549%3
58 Certified Nursing Assistant
% of Days 100%
17 Licensed Practical Nurse
% of Days 100%
12 Registered Nurse
% of Days 100%
6 Speech Language Pathologist
% of Days 99%
5 Other Dietary Services Staff
% of Days 91%
4 Physical Therapy Aide
% of Days 88%
2 Clinical Nurse Specialist
% of Days 70%
1 RN Director of Nursing
% of Days 73%
2 Medication Aide/Technician
% of Days 63%
1 Dietitian
% of Days 66%
1 Mental Health Service Worker
% of Days 63%
1 Administrator
% of Days 61%
1 Nurse Practitioner
% of Days 60%
3 Respiratory Therapy Technician
% of Days 79%
1 Qualified Social Worker
% of Days 36%
2 Physical Therapy Assistant
% of Days 49%

Penalties and fines

Federal penalties imposed by CMS for regulatory violations, including civil money penalties (fines) and denials of payment for new Medicare/Medicaid admissions.

Source: CMS Penalties Database

No penalties in the past 3 years

No civil money penalties or payment denials were reported in the last 3 years.

Quality of care over time

These measures show how residents usually do over time at this home, based on health outcomes and preventive care.

High-risk clinical events score Info A composite score based on pressure ulcers, falls with injury, weight loss, walking ability decline, and activities of daily living decline. 5.9
In line with Ohio average

Ohio average: 5.8

Functional decline score Info A composite score based on activities of daily living decline, walking ability decline, and incontinence. 11.5
9% better than Ohio average

Ohio average: 12.7

Long-stay resident measures
Significantly above average Ohio avg: 4.7 Info CMS star rating based on long-stay quality measure performance. 5 stars = significantly above average, 1 star = significantly below average.
Need for Help with Daily Activities Increased Info Percent of long-stay residents whose need for help with daily activities has increased 6.3%
8% better than Ohio average

Ohio average: 6.8%

Walking Ability Worsened Info Percent of long-stay residents whose ability to move independently worsened 5.3%
40% better than Ohio average

Ohio average: 8.9%

Low Risk Residents with Bowel/Bladder Incontinence Info Percent of low risk long-stay residents who lose control of their bowels or bladder 23.0%
5% worse than Ohio average

Ohio average: 22.0%

Falls with Major Injury Info Percent of long-stay residents experiencing one or more falls with major injury 2.4%
31% better than Ohio average

Ohio average: 3.4%

High Risk Residents with Pressure Ulcers Info Percent of long-stay high risk residents with pressure ulcers 1.4%
63% better than Ohio average

Ohio average: 3.9%

Urinary Tract Infection Info Percent of long-stay residents with a urinary tract infection 0.0%
100% better than Ohio average

Ohio average: 0.5%

Lost Too Much Weight Info Percent of long-stay residents who lose too much weight 14.2%
128% worse than Ohio average

Ohio average: 6.2%

Depressive Symptoms Info Percent of long-stay residents who have depressive symptoms 14.4%
40% better than Ohio average

Ohio average: 24.0%

Antipsychotic Use Info Percent of long-stay residents who received an antipsychotic medication 10.0%
18% worse than Ohio average

Ohio average: 8.4%

Pneumococcal Vaccine Info Percent of long-stay residents assessed and appropriately given the pneumococcal vaccine 100.0%
8% better than Ohio average

Ohio average: 92.4%

Influenza Vaccine Info Percent of long-stay residents assessed and appropriately given the seasonal influenza vaccine 97.3%
In line with Ohio average

Ohio average: 94.5%

Short-stay resident measures
Average Ohio avg: 2.4 Info CMS star rating based on short-stay quality measure performance. 5 stars = much above average, 1 star = much below average.
Pneumococcal Vaccine Info Percent of short-stay residents assessed and appropriately given the pneumococcal vaccine 97.9%
25% better than Ohio average

Ohio average: 78.0%

Antipsychotic medication increase Info Percent of short-stay residents who newly received an antipsychotic medication 2.1%
65% worse than Ohio average

Ohio average: 1.3%

Influenza Vaccine Info Percent of short-stay residents assessed and appropriately given the seasonal influenza vaccine 89.5%
18% better than Ohio average

Ohio average: 75.6%

Re-hospitalized after SNF stay Info Percentage of short-stay residents who were re-hospitalized after their nursing home admission. 22.3%
11% better than Ohio average

Ohio average: 25.1%

Emergency department visits Info Percentage of short-stay residents who had an outpatient emergency department visit. 13.7%
10% worse than Ohio average

Ohio average: 12.5%

Falls with major injury Info Percentage of SNF residents who experience falls with major injury during their stay. 0.0%
100% better than Ohio average

Ohio average: 0.8%

Ability to care for self at discharge Info Percentage of residents at or above expected ability to care for themselves at discharge. 52.5%
In line with Ohio average

Ohio average: 53.7%

Successful return to home or community Info Rate of successful return to home or community from a skilled nursing facility. 53.8%
6% better than Ohio average

Ohio average: 50.6%

Breakdown by payment type

Medicare

13% of new residents, usually for short-term rehab.

Typical stay 25 days

Private pay

67% of new residents, often for short stays.

Typical stay 23 days

Medicaid

20% of new residents, often for long-term daily care.

Typical stay 7 - 8 months

Facility Characteristics

Source: CMS Long-Term Care Facility Characteristics (Data as of Jan 2026)

Total residents 93
Medicare
6
6.5% of residents
Medicaid
52
55.9% of residents
Private pay or other
35
37.6% of residents
Programs & Services
Residents Group

Residents meet regularly to discuss policies, care quality, and activities

Nurse Aide Training

State-approved Nurse Aide Training and Competency Evaluation Program on-site

Active Resident Council

Organized group of residents that meets regularly to discuss facility policies, quality of life, and activities.

Finances and operations

Based on CMS SNF Cost Report for fiscal year ending in 12/2023.

For-profit
Operated by a single business entity.
Net patient revenue Info Net patient revenue — what the home actually collects for resident care, after contractual allowances, bad debt and discounts are subtracted from its gross charges (CMS cost report, Worksheet G-3). It covers resident care only; money the home earns from other sources is shown separately as "Other income."
$10.6M
Net patient income Info Net patient income: net patient revenue minus the home's total operating expenses. A positive figure means it earns more from resident care than it spends to deliver it; a negative figure means the opposite. It excludes non-operating "other income."
-$300.8K
For-profit Operated by a single business entity.
Net patient revenue Info Net patient revenue — what the home actually collects for resident care, after contractual allowances, bad debt and discounts are subtracted from its gross charges (CMS cost report, Worksheet G-3). It covers resident care only; money the home earns from other sources is shown separately as "Other income."
$10.6M Rank #69 / 210Revenue — State benchmarkedThis home is ranked 69th out of 210 homes in Ohio. Shows this facility's annual revenue compared to the Ohio average. Higher revenue generally means more resources for staffing and capital — read alongside Payroll %.Rankings are based only on facilities in Ohio that report data for that category. Facilities without available data are excluded from the ranking.Click the rank badge to see the full State ranking.Click here to see the full State ranking.
Net patient income Info Net patient income: net patient revenue minus the home's total operating expenses. A positive figure means it earns more from resident care than it spends to deliver it; a negative figure means the opposite. It excludes non-operating "other income."
-$300.8K
Other income Info Money the home earns outside of resident care — such as investments, grants, rentals and other non-operating sources (CMS cost report, Worksheet G-3). It is tracked separately from net patient revenue: it is not part of that figure, and it is not included in net patient income.
$387.1K
Payroll costs Info Staff salaries plus wage-related costs — benefits such as payroll taxes, health insurance and retirement — from the home's own accounting records (CMS cost report, Worksheet A). Contract or agency labor is counted separately, under other operating costs. Rank #108 / 210Payroll — State benchmarkedThis home is ranked 108th out of 210 homes in Ohio. Shows total annual staff payroll benchmarked to the Ohio average. Higher payroll investment relative to peers often signals better staffing and less reliance on cheaper contract labor.Rankings are based only on facilities in Ohio that report data for that category. Facilities without available data are excluded from the ranking.Click the rank badge to see the full State ranking.Click here to see the full State ranking.
$4.7M 44.5% of net patient revenue Info Payroll as a share of revenue: staff salaries and wage-related benefits divided by net patient revenue. A higher figure means more of each revenue dollar goes to staff pay. Rank #192 / 210Payroll % — State benchmarkedThis home is ranked 192nd out of 210 homes in Ohio. Shows payroll as a percentage of revenue versus the Ohio average. Well-run Ohio facilities typically land around 54–64% — the top third Statewide. Below 25% may signal understaffing or heavy agency use — read with Staffing ratings.Rankings are based only on facilities in Ohio that report data for that category. Facilities without available data are excluded from the ranking.Click the rank badge to see the full State ranking.Click here to see the full State ranking.
Other operating costs Info Everything it costs to run the home apart from payroll — food, utilities, supplies, maintenance, contract labor and administration. Calculated as total operating expense minus payroll (staff salaries and wage-related benefits).
$6.2M
Total costs Info The home's total operating expense for the year — all the costs of running it, salaries included (CMS cost report, Worksheet G-3).
$10.9M

What does this home offer?

Housing options icon

Housing Options: Private / Semi-Private Suites

Building type icon
Building type icon

Building Type: Single-story

Beauty services icon

Beauty Services

Housekeeping icon
Housekeeping icon

Housekeeping Services

Social and recreational activities icon

Social and Recreational Activities

On-site medical care and health services icon

On-site Medical Care and Health Services

Who this home usually serves

TYPE OF STAY

Primarily long-term care, limited rehab

Most residents stay long-term, while a smaller portion are admitted for short-term rehab.

Most new residents arrive under private pay (67% of admissions), and a typical private pay stay runs around 23 days.

Admissions
497 total

Coverage residents most often arrive under.

Medicare 13%
Private pay 67%
Medicaid 20%
Discharges
495 total

Coverage residents most often leave under.

Medicare 9%
Private pay 56%
Medicaid 35%

Places of interest near Villa Springfield Rehabilitation and Healthcare Center

Address 3.8 miles from city center Info Estimated distance in miles from Springfield's city center to Villa Springfield Rehabilitation and Healthcare Center's address, calculated via Google Maps.

Calculate Travel Distance to Villa Springfield Rehabilitation and Healthcare Center

Add your location

Address

Compare Nursing Homes around Springfield

The information below is reported by the Ohio Department of Health, Bureau of Survey and Certification.

2 facilities compared · CMS & OH Dept. of Health data

Forest Glen Rehabilitation and Healthcare Center
NH
AL
HC
IL
MC
PC
RC
Springfield
43
Facility 43
OH AVG 78
Rank #254 / 323
64.9%
Facility 64.9%
OH AVG 78.7%
Rank #181 / 211
-18%
4.15
Facility 4.15
OH AVG 3.54
Rank #35 / 210
-21%+17%
$0
Facility $0
OH AVG $74.0k
Rank #1 / 211
25
Facility 25
OH AVG 30.9
Rank #96 / 210
3.1
Facility 3.1
OH AVG 4.6
Rank #54 / 210
269-
10
Facility 10
OH AVG 40
Rank #620 / 705
Holli Remy
$11.1M
Facility $11.1M
OH AVG $10.1M
Rank #82 / 210
$7.0M
Facility $7.0M
OH AVG $3.9M
Rank #46 / 210
62.5%
Facility 62.5%
OH AVG 40.2%
Rank #26 / 210
366245
Villa Springfield Rehabilitation and Healthcare Center
NH
MC
RC
Springfield (Oakwood Village)
110
Facility 110
OH AVG 78
Rank #61 / 323
84.5%
Facility 84.5%
OH AVG 78.7%
Rank #107 / 211
+7%
2.87
Facility 2.87
OH AVG 3.54
Rank #190 / 210
+12%-19%
$0
Facility $0
OH AVG $74.0k
Rank #1 / 211
21
Facility 21
OH AVG 30.9
Rank #72 / 210
3.5
Facility 3.5
OH AVG 4.6
Rank #67 / 210
-91A+
46
Facility 46
OH AVG 40
Rank #298 / 705
Dawn Barone
$10.6M
Facility $10.6M
OH AVG $10.1M
Rank #69 / 210
$4.7M
Facility $4.7M
OH AVG $3.9M
Rank #108 / 210
44.5%
Facility 44.5%
OH AVG 40.2%
Rank #192 / 210
365829

Financial Assistance for
Nursing Home in Ohio

Villa Springfield Rehabilitation and Healthcare Center is located in Springfield, Ohio.
Here are the financial assistance programs available to residents in Ohio.

Get Financial aid guidance

PASSPORT Waiver

Ohio Medicaid PASSPORT

Age 60+
General Ohio resident, Medicaid-eligible, nursing home-level care need.
Income Limits (2025) ~$2,829/month 300% FBR, individual
Asset Limits $2,000 (individual), $3,000 (couple).
OH

Administered through regional agencies; waitlists possible.

Benefits
Personal care (5-7 hours/day) Respite (240 hours/year) Adult day care ($65/day) Home modifications ($1,500 avg.)

Ohio Home Care Program (non-Medicaid)

OH HCP

Age 60+
General Ohio resident, at risk of decline.
Income Limits ~$2,000/month individual, varies
Asset Limits $5,000 individual
OH

Limited funding; regional variation.

Benefits
In-home care (3-5 hours/week) Respite (up to 10 days/year) Transportation (~5 trips/month)

Assisted Living Waiver (ALW)

Ohio Assisted Living Waiver

Age 21+ (65+ prioritized)
General OH resident, Medicaid-eligible, NFLOC.
Income Limits (2025) ~$2,829/month (individual); QIT required.
Asset Limits $2,000 (individual), $3,000 (couple).
OH

Covers ~300 facilities; room/board not included (separate cost).

Benefits
Personal care Meals Medication management Transportation (~$3,000-$4,000/month value)

Program of All-Inclusive Care for the Elderly (PACE)

Ohio PACE (e.g., McGregor PACE)

Age 55+
General OH resident (specific counties), NFLOC, safe with PACE support.
Income Limits (2025) ~$2,829/month (Medicaid-eligible); private pay option available.
Asset Limits $2,000 (individual), $3,000 (couple) for Medicaid enrollees.
OH

Available in 9 counties (e.g., Cuyahoga, Franklin); expanding via Healthy Aging Grants.

Benefits
Personal care (5-7 hours/day) Medical care Meals Transportation Respite Therapies

Medicare Savings Program (MSP)

Ohio Medicare Savings Program

Age 65+ or disabled
General OH resident, Medicare Part A/B.
Income Limits (2025) ~$2,510/month (QMB), ~$3,380/month (SLMB), ~$3,598/month (QI)—individual.
Asset Limits $9,430 (individual), $14,130 (couple).
OH

Three tiers; includes Extra Help for Part D; no waitlist.

Benefits
Covers Part B premiums ($174.70/month) Deductibles ($240/year) Copays (~20%)

Home Energy Assistance Program (HEAP)

Ohio HEAP

Age 60+ prioritized
General OH resident, low-income household.
Income Limits (2025) ~$3,970/month individual, 185% FPL
Asset Limits Not assessed; income-focused.
OH

Covers gas, electric, oil; emergency aid via Winter/Summer Crisis Programs.

Benefits
Heating/cooling aid ($300-$1,000/season) Emergency aid ($500 max)

Family Caregiver Support Program (FCSP)

Ohio Family Caregiver Support Program

Age
General Caregivers of 60+ needing care or 55+ caregivers of others; OH resident; functional needs (2+ ADLs).
Income Limits (2025) Prioritizes ~$24,980/year (individual); no strict cap.
Asset Limits Not assessed; need-based.
OH

12 AAAs; rural/low-income priority; volunteer respite option.

Benefits
Respite (4-6 hours/week or 5 days/year) Adult day care ($60/day) Training Supplies (~$500/year)

VA Aid and Attendance (A&A) and Housebound Benefits

Ohio VA Aid and Attendance/Housebound

Age 65+ or disabled veteran/spouse
General OH resident, wartime service, need for ADL help (A&A) or homebound.
Income Limits (2025) Net income < ~$1,984/month (veteran with dependent, A&A); pension offsets income.
Asset Limits ~$155,356 net worth limit
OH

High veteran demand; supports care in multiple settings.

Benefits
Cash (~$1,433-$2,642/month veteran, ~$951-$1,318 spouse) for care costs (e.g., in-home, assisted living)

Homestead Exemption

Ohio Homestead Exemption

Age 65+ (or disabled)
General OH resident, homeowner, low-income.
Income Limits (2025) ~$38,500/year individual, adjusted annually
Asset Limits Not assessed; home ownership required.
OH

Reduces taxable value by $25,000; applies to primary residence.

Benefits
Tax reduction (~$400-$800/year avg., varies by county)

Save the Dream Ohio (Homeowner Assistance Fund)

Ohio Save the Dream

Age 60+ prioritized
General OH resident, homeowner, hardship post-Jan 21, 2020.
Income Limits (2025) ~$147,600/year family of 4, 150% AMI; varies by county
Asset Limits Not assessed; hardship-focused.
OH

Covers delinquent mortgages, utilities, taxes; max $25,000 mortgage aid.

Benefits
Mortgage aid ($25,000 max) Utility/property tax aid ($5,000 avg.)

Frequently Asked Questions about Villa Springfield Rehabilitation and Healthcare Center

What neighborhood is Villa Springfield Rehabilitation and Healthcare Center in?

Villa Springfield Rehabilitation and Healthcare Center is in the Oakwood Village neighborhood of Springfield.

Is Villa Springfield Rehabilitation and Healthcare Center in a walkable area?

Villa Springfield Rehabilitation and Healthcare Center has a walk score of 46. Somewhat walkable. A few nearby services may be reachable on foot, but most trips require transportation.

What is the occupancy rate at Villa Springfield Rehabilitation and Healthcare Center?

Villa Springfield Rehabilitation and Healthcare Center's occupancy is 80.2%.

Does Villa Springfield Rehabilitation and Healthcare Center operate as a for-profit or non-profit?

Villa Springfield Rehabilitation and Healthcare Center is registered as a for-profit in OH.

Are there photos of Villa Springfield Rehabilitation and Healthcare Center?

Yes — there are 5 photos of Villa Springfield Rehabilitation and Healthcare Center in the photo gallery on this page.

What is the address of Villa Springfield Rehabilitation and Healthcare Center?

Villa Springfield Rehabilitation and Healthcare Center is located at 701 Villa Rd, Springfield, OH 45503.

What is the phone number of Villa Springfield Rehabilitation and Healthcare Center?

(937) 399-5551 will put you in contact with the team at Villa Springfield Rehabilitation and Healthcare Center.

Guides for Better Senior Living

Care Cost Calculator: See Prices in Your Area

Nursing Home Data Explorer

Don’t Wait Too Long: 7 Red Flag Signs Your Parent Needs Assisted Living Now

The True Cost of Assisted Living in 2025 – And How Families Are Paying For It

Understanding Senior Living Costs: Pricing Models, Discounts & Financial Assistance