St. Martha Center for Rehabilitation & Healthcare
Nursing Home · Exton, PA
CMS overall rating Info The Overall CMS Rating is scored from 1 to 5 stars and combines results from health inspections, staffing levels, and quality measures. Health inspections carry the most weight. Staffing and quality scores can increase or decrease the final rating based on performance compared to state and national standards.

St. Martha Center for Rehabilitation & Healthcare

Nursing Home · Exton, PA
CMS overall rating Info The Overall CMS Rating is scored from 1 to 5 stars and combines results from health inspections, staffing levels, and quality measures. Health inspections carry the most weight. Staffing and quality scores can increase or decrease the final rating based on performance compared to state and national standards.
Calculator: See prices in your area
St. Martha Center for Rehabilitation & Healthcare accepts Medicare, Medicaid, and private pay.

Overview of St. Martha Center for Rehabilitation & Healthcare

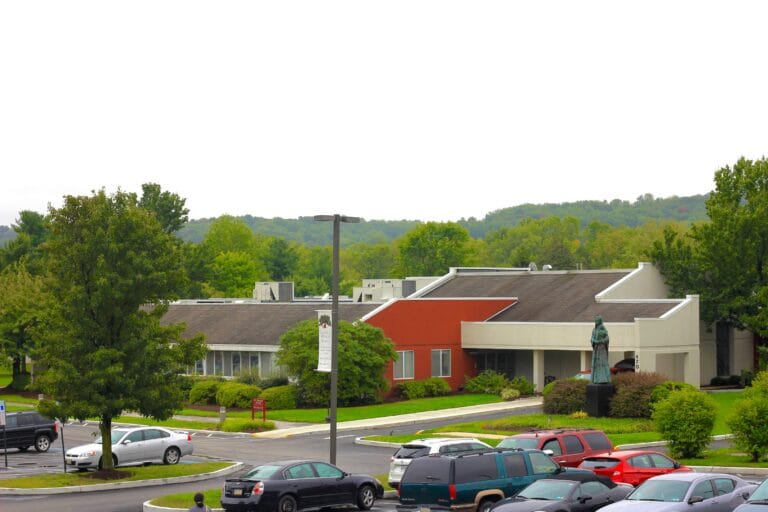
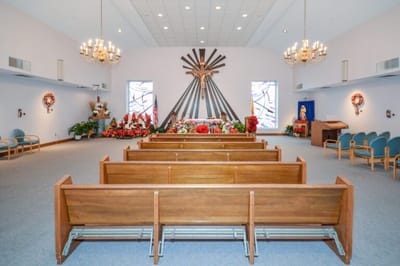
St. Martha Center for Rehabilitation & Healthcare is a top-rated nursing home in Downingtown, PA, offering long-term care, memory care, skilled nursing, and rehabilitation. Promoting a warm and welcoming environment, the community ensures older adults can feel at ease during their stay. Restaurant-style dining, 24-hour care, and therapies are also offered to improve residents’ quality of life. As a faith-based community, the community doubles its efforts to help residents recover and live to their potential in retirement.

Social events, cultural programs, and recreational activities encourage residents to make friends and have fun. Cozy lounge areas, a state-of-the-art rehabilitation gym, and an outdoor courtyard are among the top-notch amenities dedicated to residents’ wellness and relaxation. Located near schools and churches, and easily accessible through public transportation, the community guarantees a laid-back lifestyle. This nursing home has high standards of care and a clean setting, making it a great choice for senior living in Pennsylvania.

(610) 873-8490

Quality ratings

Measured by Centers for Medicare & Medicaid Services (CMS)

Overall rating Info The Overall CMS Rating combines results from health inspections, staffing levels and quality measures. Health inspections carry the most weight. Staffing and quality scores can increase or decrease the final rating based on performance compared to state and national standards.
At PA avg. At PA avg.Click the badge to see the full State ranking.Click here to see the full State ranking.
Health Inspection Info Based on the results of the facility's three most recent standard inspections and any complaint investigations. CMS reviews the number, scope, and severity of deficiencies, with more recent findings weighted more heavily.
▲ 43.0% Above PA avg. ▲ 43.0% Above PA avg.Click the badge to see the full State ranking.Click here to see the full State ranking.
Staffing Info Measures average nursing staff hours per resident per day, including Registered Nurses (RNs) and total nursing staff. Ratings are adjusted based on the level of care residents require and are compared to state and national benchmarks.
▼ 70.5% Below PA avg. ▼ 70.5% Below PA avg.Click the badge to see the full State ranking.Click here to see the full State ranking.
Quality Measures Info Based on clinical and physical health indicators reported to CMS, such as hospital readmissions, falls, pressure ulcers, and improvements in mobility. These measures reflect how well residents' health needs are being managed.
▼ 11.6% Below PA avg. ▼ 11.6% Below PA avg.Click the badge to see the full State ranking.Click here to see the full State ranking.

Staffing hours breakdown

Info Daily nursing hours per resident by staff type, reported to CMS. Higher is generally better — compare this facility to state and national averages to see where staffing stands.

Hours per resident per day — compared to Pennsylvania state averages

Total nursing care / resident Info Total adjusted nursing hours per resident per day, combining RN, LPN, and aide time. CMS adjusts this for case-mix so facilities can be fairly compared.
3h 5m per day
This facility Pennsylvania avg (4h 9m per day)
vs Pennsylvania avg
-26%

4 of 6 metrics below state avg

Standout metric Physical Therapist is +17% above state avg
Staff typeHours / Day / Residentvs state avg
Registered Nurse (RN) Info RNs hold the highest nursing license and can assess residents, interpret test results, and direct care plans. More RN hours per day often signals stronger clinical oversight and faster response to health changes. 23m per day ▼ 51% State avg: 47m per day · National avg: 41m per day
LPN / LVN Info Licensed Practical Nurses (LPNs) or Licensed Vocational Nurses (LVNs) deliver routine hands-on care — medication administration, wound dressing, and monitoring vital signs. They work under RN supervision and make up a large share of daily bedside care. 1h 0m per day ▲ 9% State avg: 55m per day · National avg: 52m per day
Nurse Aide Info Certified Nurse Aides (CNAs) provide the most direct day-to-day assistance: bathing, dressing, feeding, and mobility. Nurse aide hours are typically the largest staffing category and directly affect residents' quality of life. 2h 6m per day ▼ 5% State avg: 2h 12m per day · National avg: 2h 21m per day
Total Nursing (Weekend) Info Combined nursing hours (RN + LPN + Nurse Aide) per resident per day on weekends. Staffing often drops on weekends — this figure reveals whether the facility maintains adequate coverage outside of weekday hours. 3h 10m per day ▼ 10% State avg: 3h 31m per day · National avg: 3h 26m per day
Physical Therapist Info Hours per resident per day provided by licensed Physical Therapists (PTs) or PT Assistants. PT services help residents recover mobility after injury or illness and are especially important for post-acute (short-stay) rehabilitation. 7m per day ▲ 17% State avg: 6m per day · National avg: 4m per day
RN (Weekend) Info Registered nurse hours specifically on weekends. Facilities sometimes reduce RN presence on Saturdays and Sundays — a low weekend RN figure compared to weekday hours can indicate reduced clinical oversight when most administrative staff are absent. 15m per day ▼ 55% State avg: 33m per day · National avg: 29m per day

Capacity and availability

This home usually has limited availability

Occupancy between 85% and 95% suggests balanced demand.

Higher occupancy than the Pennsylvania average: 78.7%
Occupancy rate 93.6%
Avg. Length of Stay 76 days
Occupancy rate
93.6%
Avg. Length of Stay
76 days

Who this home usually serves

TYPE OF STAY

Mix of rehab and long-term care

This home supports both short-term rehab and long-term care, with residents staying for a wide range of durations.

Breakdown by payment type

Medicare

25% of new residents, usually for short-term rehab.

Typical stay 3 - 4 months

Private pay

59% of new residents, often for short stays.

Typical stay 29 days

Medicaid

16% of new residents, often for long-term daily care.

Typical stay 1 - 2 years

Finances and operations

Privately-owned community
Operated by a partnership between two or more business owners.
Home revenue
$23.4M
Profit
$1.4M
Privately-owned community Operated by a partnership between two or more business owners.
Home revenue
$23.4M
Profit
$1.4M
Payroll costs Info The portion of the home's budget spent on staff, including nurses, caregivers, and other employees who support care and operations.
$11.4M
48.8% of revenue
Other operating costs Info All remaining costs needed to run the home, such as food, utilities, building maintenance, supplies and administrative expenses.
$10.6M
Total costs $22.0M
Walk Score
Walk Score: 34 / 100
Somewhat walkable. A few nearby services may be reachable on foot, but most trips require transportation.

Types of Care at St. Martha Center for Rehabilitation & Healthcare

Contact St. Martha Center for Rehabilitation & Healthcare

Health Inspection History

Inspections Since 2023
Total health inspections 5

Pennsylvania average 6.7


Last Health inspection on Feb 2025

Total health citations
15

Pennsylvania average 31.3

Citations per inspection
3

Pennsylvania average 4.4


Health citations are formal notices following inspections when they fail to comply with safety and care standards.

10 of 15 citations resulted from standard inspections; 4 of 15 resulted from complaint investigations; and 1 of 15 came from combined inspections (standard and complaint).

Breakdown of citation severity (last 3 years)
Critical Health citations
0
100% better than Pennsylvania average

Pennsylvania average: 0.3


Serious Health citations
0
100% better than Pennsylvania average

Pennsylvania average: 0.6

0 critical citations Pennsylvania average: 0.3

0 serious citations Pennsylvania average: 0.6

15 moderate citations Pennsylvania average: 29.5

0 minor citations Pennsylvania average: 0.8
Citations history (last 3 years)
Pharmacy moderate citation Feb 21, 2025
Corrected

Quality of Care moderate citation Feb 21, 2025
Corrected

Administration moderate citation Jan 12, 2024
Corrected

Pharmacy moderate citation Jan 12, 2024
Corrected

Financial Assistance for
Nursing Home in Pennsylvania

St. Martha Center for Rehabilitation & Healthcare is located in Downingtown, Pennsylvania.
Here are the financial assistance programs available to residents in Pennsylvania.

Get Financial aid guidance

Community HealthChoices (CHC)

PA Medicaid CHC

Age 65+ or disabled
General Pennsylvania resident, Medicaid-eligible, nursing home-level care need.
Income Limits (2025) ~$2,829/month 300% FBR, individual
Asset Limits $2,000 (individual), $3,000 (couple) (excludes home, car).
PA

Managed care model; high urban demand (e.g., Philadelphia, Pittsburgh).

Benefits
Personal care (5-7 hours/day, e.g., bathing, dressing) Respite care (up to 240 hours/year) Adult day care ($70/day) Home modifications ($1,500 avg.)

Pennsylvania OPTIONS Program

PA OPTIONS

Age 60+
General Pennsylvania resident, at risk of nursing home placement.
Income Limits ~$2,000/month individual, varies by region
Asset Limits $8,000 individual
PA

Cost-sharing required above certain income; rural/urban balance.

Benefits
In-home care (3-5 hours/week) Respite (up to 10 days/year) Adult day care (~$70/day) Transportation (~5 trips/month)

Living Independence for the Elderly (LIFE)

Pennsylvania LIFE (PACE)

Age 55+
General PA resident (specific counties), NFLOC, safe with LIFE support.
Income Limits (2025) ~$2,829/month (Medicaid-eligible); private pay option available.
Asset Limits $2,000 (individual), $3,000 (couple) for Medicaid enrollees.
PA

16 providers in 25 counties (e.g., Allegheny, Luzerne); LIFE branding unique to PA.

Benefits
Personal care (5-7 hours/day) Medical care Meals Transportation Respite Therapies

Medicare Savings Program (MSP)

Pennsylvania Medicare Savings Program

Age 65+ or disabled
General PA resident, Medicare Part A/B.
Income Limits (2025) ~$2,510/month (QMB), ~$3,380/month (SLMB), ~$3,598/month (QI)—individual.
Asset Limits $9,430 (individual), $14,130 (couple).
PA

Three tiers; includes Extra Help for Part D; no waitlist.

Benefits
Covers Part B premiums ($174.70/month) Deductibles ($240/year) Copays (~20%)

Family Caregiver Support Program (FCSP)

Pennsylvania Family Caregiver Support Program

Age
General Caregivers of 60+ needing care or 55+ caregivers of others; PA resident; functional needs (2+ ADLs).
Income Limits (2025) No strict cap; reimbursements up to $600/month if care recipient income < ~$2,322/month 185% FPL
Asset Limits Not assessed; need-based.
PA

High demand; includes grandparent caregivers.

Benefits
Respite (4-6 hours/week or 5 days/year) Adult day care ($60/day) Supplies (~$2,000/year) Caregiver training

VA Aid and Attendance (A&A) and Housebound Benefits

Pennsylvania VA Aid and Attendance/Housebound

Age 65+ or disabled veteran/spouse
General PA resident, wartime service, need for ADL help (A&A) or homebound.
Income Limits (2025) Net income < ~$1,984/month (veteran with dependent, A&A); pension offsets income.
Asset Limits ~$155,356 net worth limit
PA

High veteran population; supports rural/urban care needs.

Benefits
Cash (~$1,433-$2,642/month veteran, ~$951-$1,318 spouse) for care costs (e.g., in-home, assisted living)

Property Tax/Rent Rebate Program (PTRR)

Pennsylvania Property Tax/Rent Rebate Program

Age 65+
General PA resident, homeowner/renter (or widow/er 50+, disabled 18+).
Income Limits (2025) ~$45,000/year individual or couple, excludes half of Social Security
Asset Limits Not assessed; income-focused.
PA

Rebates up to $1,000; ~600,000 eligible annually.

Benefits
Rebates ($250-$1,000 based on income; e.g., $1,000 if income < $8,000)

Senior Farmers’ Market Nutrition Program (SFMNP)

Pennsylvania SFMNP

Age 60+
General PA resident, low-income.
Income Limits (2025) ~$2,322/month individual, 185% FPL
Asset Limits Not assessed.
PA

Vouchers (~$50/season) via 52 AAAs; serves ~200,000 annually.

Benefits
Vouchers (~$50/season) for fresh produce at approved markets

Places of interest near St. Martha Center for Rehabilitation & Healthcare

Address 1.0 miles from city center Info Estimated distance in miles from Downingtown's city center to St. Martha Center for Rehabilitation & Healthcare's address, calculated via Google Maps.

Calculate Travel Distance to St. Martha Center for Rehabilitation & Healthcare

Add your location

Address

Staffing Data

Reporting period: April 1 – June 30, 2025 (Q2 2025). Source: CMS Payroll-Based Journal report.

Total staff 270
Employees 105
Contractors 165
Staff to resident ratio 2.45:1
27% better than Pennsylvania average
Pennsylvania average ratio: 1.94:1 Pennsylvania average ratio: 1.94:1See full Pennsylvania ranking
Avg staff/day 60
Average shift 7.8 hours
0% compared with Pennsylvania average
Pennsylvania average: 7.8 hours Pennsylvania average shift: 7.8 hoursSee full Pennsylvania ranking
Total staff hours (quarter) 42,511

Nursing staff breakdown

Q2 2025 · Apr 1 – Jun 30 More info This data comes from the CMS Payroll-Based Journal report covering April 1 – June 30, 2025.
Registered Nurse

Manages medical care and health needs.

Total count 12
Average shift length Info Average shift length. Calculated as total hours divided by days worked and average staff per day. 7.3 hours

This role is partially covered by contractors.

Licensed Practical Nurse

Assists with medical care and medications.

Total count 97
Average shift length Info Average shift length. Calculated as total hours divided by days worked and average staff per day. 8 hours

This role is partially covered by contractors.

Certified Nursing Assistant

Helps with daily care and mobility.

Total count 130
Average shift length Info Average shift length. Calculated as total hours divided by days worked and average staff per day. 8.2 hours

This role is partially covered by contractors.

Contractor staffing

Q2 2025 · Apr 1 – Jun 30 More info This data comes from the CMS Payroll-Based Journal report covering April 1 – June 30, 2025.

Total hours from contractors

19.2%

8,152 contractor hours this quarter

Certified Nursing Assistant: 83 Licensed Practical Nurse: 77 Registered Nurse: 3 Occupational Therapy Aide: 1 Medical Director: 1

Staff by category

Q2 2025 · Apr 1 – Jun 30 More info This data comes from the CMS Payroll-Based Journal report covering April 1 – June 30, 2025.
Certified Nursing Assistant478313021,02391100%8.2
Licensed Practical Nurse2077979,69691100%8
Registered Nurse93122,48191100%7.3
Physical Therapy Assistant4041,5538998%6.8
Other Dietary Services Staff3031,4518695%7.5
Respiratory Therapy Technician4049258189%5.9
Mental Health Service Worker4048886268%7.3
Speech Language Pathologist3037266673%6.7
Dietitian1015186571%8
Administrator1015046369%8
Physical Therapy Aide5054795763%5
RN Director of Nursing1014776167%7.8
Qualified Social Worker1014476066%7.5
Nurse Practitioner1014455662%7.9
Occupational Therapy Aide0114185662%7.5
Clinical Nurse Specialist1014025864%6.9
Medical Director011783943%2
130 Certified Nursing Assistant
% of Days 100%
97 Licensed Practical Nurse
% of Days 100%
12 Registered Nurse
% of Days 100%
4 Physical Therapy Assistant
% of Days 98%
3 Other Dietary Services Staff
% of Days 95%
4 Respiratory Therapy Technician
% of Days 89%
4 Mental Health Service Worker
% of Days 68%
3 Speech Language Pathologist
% of Days 73%
1 Dietitian
% of Days 71%
1 Administrator
% of Days 69%
5 Physical Therapy Aide
% of Days 63%
1 RN Director of Nursing
% of Days 67%
1 Qualified Social Worker
% of Days 66%
1 Nurse Practitioner
% of Days 62%
1 Occupational Therapy Aide
% of Days 62%
1 Clinical Nurse Specialist
% of Days 64%
1 Medical Director
% of Days 43%

Facility Characteristics

Source: CMS Long-Term Care Facility Characteristics (Data as of Jan 2026)

Total residents 110
Medicare
23
20.9% of residents
Medicaid
61
55.5% of residents
Private pay or other
26
23.6% of residents
Programs & Services
Residents Group

Residents meet regularly to discuss policies, care quality, and activities

CCRC

Part of a Continuing Care Retirement Community offering multiple care levels

Active Resident Council

Organized group of residents that meets regularly to discuss facility policies, quality of life, and activities.

Quality of care over time

These measures show how residents usually do over time at this home, based on health outcomes and preventive care.

High-risk clinical events score Info A composite score based on pressure ulcers, falls with injury, weight loss, walking ability decline, and activities of daily living decline. 8.1
26% better than Pennsylvania average

Pennsylvania average: 11.0

Functional decline score Info A composite score based on activities of daily living decline, walking ability decline, and incontinence. 17.8
20% better than Pennsylvania average

Pennsylvania average: 22.2

Long-stay resident measures
Significantly above average Info CMS star rating based on long-stay quality measure performance. 5 stars = significantly above average, 1 star = significantly below average.
Need for Help with Daily Activities Increased Info Percent of long-stay residents whose need for help with daily activities has increased 11.6%
39% better than Pennsylvania average

Pennsylvania average: 19.0%

Walking Ability Worsened Info Percent of long-stay residents whose ability to move independently worsened 10.0%
53% better than Pennsylvania average

Pennsylvania average: 21.1%

Low Risk Residents with Bowel/Bladder Incontinence Info Percent of low risk long-stay residents who lose control of their bowels or bladder 31.9%
19% worse than Pennsylvania average

Pennsylvania average: 26.7%

Falls with Major Injury Info Percent of long-stay residents experiencing one or more falls with major injury 4.5%
41% worse than Pennsylvania average

Pennsylvania average: 3.2%

High Risk Residents with Pressure Ulcers Info Percent of long-stay high risk residents with pressure ulcers 3.2%
42% better than Pennsylvania average

Pennsylvania average: 5.5%

Urinary Tract Infection Info Percent of long-stay residents with a urinary tract infection 0.6%
68% better than Pennsylvania average

Pennsylvania average: 1.8%

Lost Too Much Weight Info Percent of long-stay residents who lose too much weight 11.2%
69% worse than Pennsylvania average

Pennsylvania average: 6.6%

Depressive Symptoms Info Percent of long-stay residents who have depressive symptoms 46.8%
750% worse than Pennsylvania average

Pennsylvania average: 5.5%

Antipsychotic Use Info Percent of long-stay residents who received an antipsychotic medication 18.0%
5% worse than Pennsylvania average

Pennsylvania average: 17.1%

Pneumococcal Vaccine Info Percent of long-stay residents assessed and appropriately given the pneumococcal vaccine 61.5%
29% worse than Pennsylvania average

Pennsylvania average: 86.9%

Influenza Vaccine Info Percent of long-stay residents assessed and appropriately given the seasonal influenza vaccine 98.0%
5% better than Pennsylvania average

Pennsylvania average: 93.5%

Hospitalizations per 1,000 days Info Number of hospitalizations per 1,000 long-stay resident days. 2.18
30% worse than Pennsylvania average

Pennsylvania average: 1.68

ED visits per 1,000 days Info Number of outpatient emergency department visits per 1,000 long-stay resident days. 1.41
18% worse than Pennsylvania average

Pennsylvania average: 1.20

Short-stay resident measures
Average Info CMS star rating based on short-stay quality measure performance. 5 stars = much above average, 1 star = much below average.
Pneumococcal Vaccine Info Percent of short-stay residents assessed and appropriately given the pneumococcal vaccine 25.8%
63% worse than Pennsylvania average

Pennsylvania average: 68.8%

Antipsychotic medication increase Info Percent of short-stay residents who newly received an antipsychotic medication 0.8%
51% better than Pennsylvania average

Pennsylvania average: 1.5%

Influenza Vaccine Info Percent of short-stay residents assessed and appropriately given the seasonal influenza vaccine 43.7%
36% worse than Pennsylvania average

Pennsylvania average: 68.7%

Re-hospitalized after SNF stay Info Percentage of short-stay residents who were re-hospitalized after their nursing home admission. 20.9%
10% better than Pennsylvania average

Pennsylvania average: 23.1%

Emergency department visits Info Percentage of short-stay residents who had an outpatient emergency department visit. 11.0%
12% worse than Pennsylvania average

Pennsylvania average: 9.8%

Falls with major injury Info Percentage of SNF residents who experience falls with major injury during their stay. 0.6%
18% better than Pennsylvania average

Pennsylvania average: 0.8%

Ability to care for self at discharge Info Percentage of residents at or above expected ability to care for themselves at discharge. 49.5%
8% worse than Pennsylvania average

Pennsylvania average: 53.7%

Successful return to home or community Info Rate of successful return to home or community from a skilled nursing facility. 32.9%
35% worse than Pennsylvania average

Pennsylvania average: 50.6%

Penalties and fines

Federal penalties imposed by CMS for regulatory violations, including civil money penalties (fines) and denials of payment for new Medicare/Medicaid admissions.

Source: CMS Penalties Database

No penalties in the past 3 years

No civil money penalties or payment denials were reported in the last 3 years.

Guides for Better Senior Living

Care Cost Calculator: See Prices in Your Area

Nursing Home Data Explorer

Don’t Wait Too Long: 7 Red Flag Signs Your Parent Needs Assisted Living Now

The True Cost of Assisted Living in 2025 – And How Families Are Paying For It

Understanding Senior Living Costs: Pricing Models, Discounts & Financial Assistance

Frequently Asked Questions about St. Martha Center for Rehabilitation & Healthcare

What neighborhood is St. Martha Center for Rehabilitation & Healthcare in?

St. Martha Center for Rehabilitation & Healthcare is in the Manor Avenue neighborhood.

Is St. Martha Center for Rehabilitation & Healthcare in a walkable area?

St. Martha Center for Rehabilitation & Healthcare has a walk score of 34. Somewhat walkable. A few nearby services may be reachable on foot, but most trips require transportation.

What is the address of St. Martha Center for Rehabilitation & Healthcare?

St. Martha Center for Rehabilitation & Healthcare is located at 470 Manor Ave, Downingtown, PA 19335.

What is the phone number of St. Martha Center for Rehabilitation & Healthcare?

(610) 873-8490 will put you in contact with the team at St. Martha Center for Rehabilitation & Healthcare.

Is St. Martha Center for Rehabilitation & Healthcare Medicare or Medicaid certified?

Yes — St. Martha Center for Rehabilitation & Healthcare is a CMS-certified provider of Medicare and Medicaid.

Explore Open Rooms
1 Contact details
2 What type of senior care service are you looking for?
3 What budget do you have in mind for senior care?
4 How soon do you need to find care?
5 Additional details

Thank you for your interest!

Our team will be in touch shortly to help with next steps.