Delmar Gardens of Lenexa
Nursing Home, Assisted Living, Independent Living & Memory Care · Lenexa, KS
CMS overall rating Info CMS (the Centers for Medicare & Medicaid Services) is the federal agency that rates nursing home quality. Its Overall Rating runs from 1 to 5 stars, combining health inspections, staffing, and quality measures, with inspections weighted most heavily.

Delmar Gardens of Lenexa

Nursing Home, Assisted Living, Independent Living & Memory Care · Lenexa, KS
CMS overall rating Info CMS (the Centers for Medicare & Medicaid Services) is the federal agency that rates nursing home quality. Its Overall Rating runs from 1 to 5 stars, combining health inspections, staffing, and quality measures, with inspections weighted most heavily.
Calculator: See prices in your area
Delmar Gardens of Lenexa accepts Medicare, Medicaid, and private pay.

Overview of Delmar Gardens of Lenexa

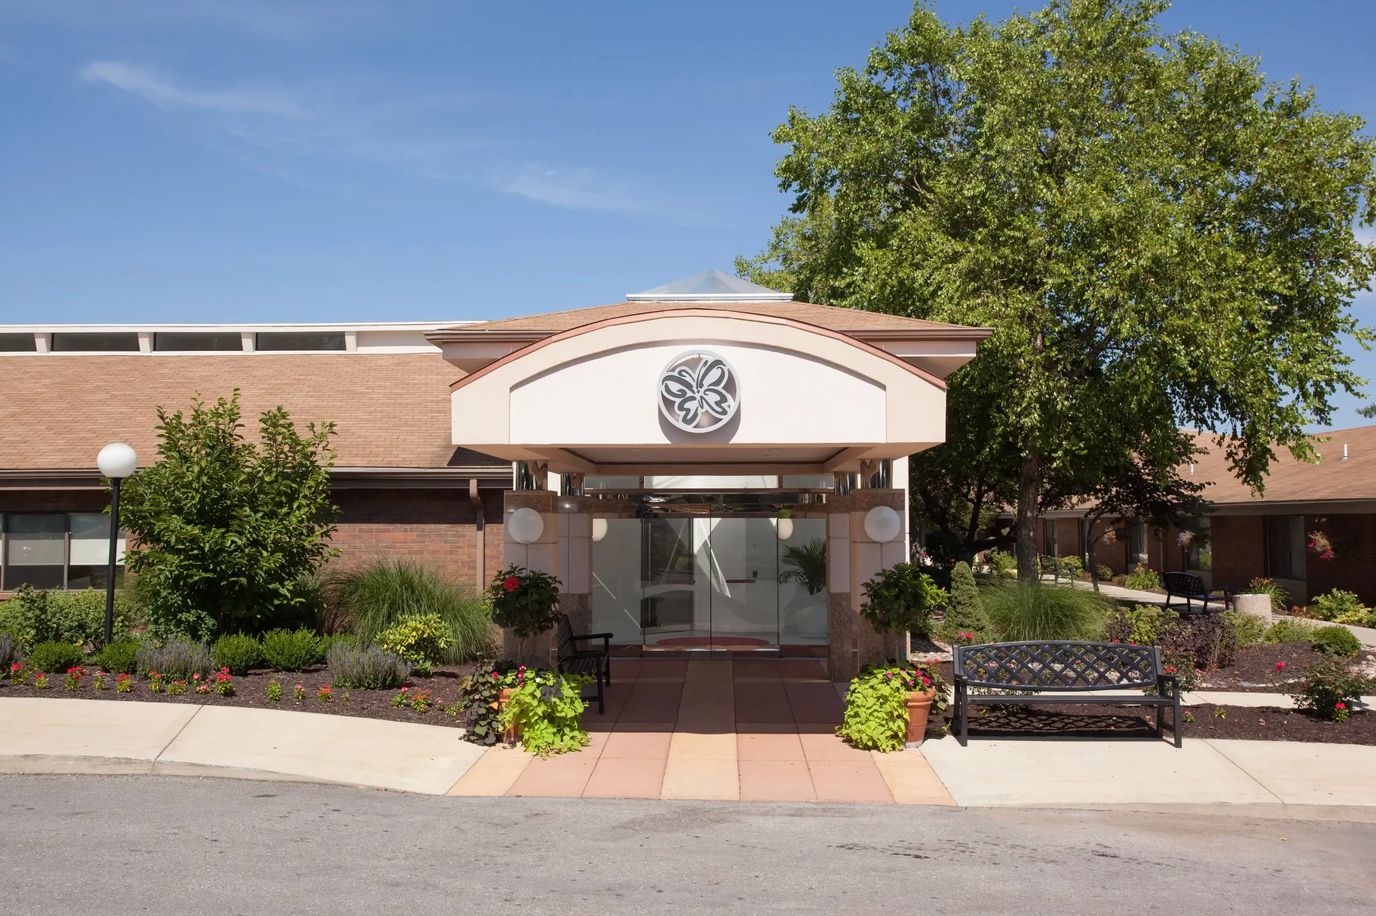
Delmar Gardens of Lenexa is a nursing home in Lenexa, KS, offering skilled nursing and rehabilitation. Promoting a supportive and welcoming environment, the community strives to keep older adults comfortable and safe. With 24-hour care, therapy services, and nutritious meals, residents receive the utmost attention and care for a worry-free living. Following a holistic approach to care, the community strives to meet residents’ unique needs and preferences.

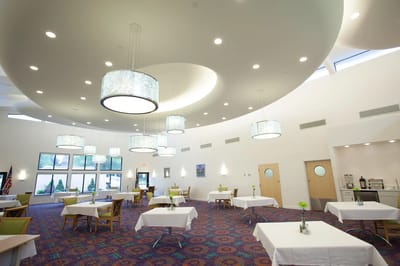
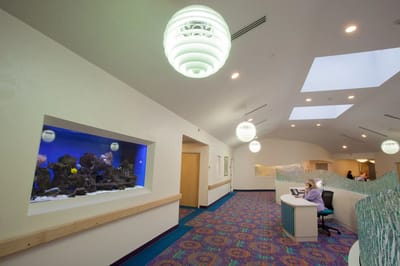
Fun events, exercises, and recreational programs foster interaction and encourage residents to have fun. Spacious dining rooms, a beauty salon/ barbershop, and an activity room are also available, so residents can freely move around and live leisurely. Restaurants, a mall, and shops are also located nearby, providing residents with easy access to their necessities and leisure. This nursing home ensures older adults can live to their potential in retirement, making it one of the finest options for senior living in Kansas.

Quality ratings

Measured by Centers for Medicare & Medicaid Services (CMS)

Overall rating Info The Overall CMS Rating combines results from health inspections, staffing levels and quality measures. Health inspections carry the most weight. Staffing and quality scores can increase or decrease the final rating based on performance compared to state and national standards.
▲ 38.3% Above KS avg. ▲ 38.3% Above KS avg.KS average: 2.9Click the badge to see the full State ranking.Click here to see the full State ranking.
Health Inspection Info Based on the results of the facility's three most recent standard inspections and any complaint investigations. CMS reviews the number, scope, and severity of deficiencies, with more recent findings weighted more heavily.
▲ 44.8% Above KS avg. ▲ 44.8% Above KS avg.KS average: 2.8Click the badge to see the full State ranking.Click here to see the full State ranking.
Staffing Info Measures average nursing staff hours per resident per day, including Registered Nurses (RNs) and total nursing staff. Ratings are adjusted based on the level of care residents require and are compared to state and national benchmarks.
▼ 42.2% Below KS avg. ▼ 42.2% Below KS avg.KS average: 3.5Click the badge to see the full State ranking.Click here to see the full State ranking.
Quality Measures Info Based on clinical and physical health indicators reported to CMS, such as hospital readmissions, falls, pressure ulcers, and improvements in mobility. These measures reflect how well residents' health needs are being managed.
▼ 35.3% Below KS avg. ▼ 35.3% Below KS avg.KS average: 3.1Click the badge to see the full State ranking.Click here to see the full State ranking.

Staffing hours breakdown

Info Daily nursing hours per resident by staff type, reported to CMS. Higher is generally better — compare this facility to state and national averages to see where staffing stands.

Hours per resident per day — compared to Kansas state averages

Total nursing care / resident Info Total adjusted nursing hours per resident per day, combining RN, LPN, and aide time. CMS adjusts this for case-mix so facilities can be fairly compared.
4h 23m per day
This facility Kansas avg (4h 38m per day)
vs Kansas avg
-5%

3 of 6 metrics below state avg

Standout metric Physical Therapist is +66% above state avg
Staff typeHours / Day / Residentvs state avg
Registered Nurse (RN) Info RNs hold the highest nursing license and can assess residents, interpret test results, and direct care plans. More RN hours per day often signals stronger clinical oversight and faster response to health changes. 21m per day ▼ 52% State avg: 43m per day · National avg: 41m per day
LPN / LVN Info Licensed Practical Nurses (LPNs) or Licensed Vocational Nurses (LVNs) deliver routine hands-on care — medication administration, wound dressing, and monitoring vital signs. They work under RN supervision and make up a large share of daily bedside care. 48m per day ▲ 19% State avg: 40m per day · National avg: 52m per day
Nurse Aide Info Certified Nurse Aides (CNAs) provide the most direct day-to-day assistance: bathing, dressing, feeding, and mobility. Nurse aide hours are typically the largest staffing category and directly affect residents' quality of life. 2h 33m per day ▼ 6% State avg: 2h 42m per day · National avg: 2h 21m per day
Weekend Total Nursing Info Combined nursing hours (RN + LPN + Nurse Aide) per resident per day on weekends. Staffing often drops on weekends — this figure reveals whether the facility maintains adequate coverage outside of weekday hours. 3h 32m per day ■ Avg State avg: 3h 35m per day · National avg: 3h 26m per day
Physical Therapist Info Hours per resident per day provided by licensed Physical Therapists (PTs) or PT Assistants. PT services help residents recover mobility after injury or illness and are especially important for post-acute (short-stay) rehabilitation. 3m per day ▲ 66% State avg: 2m per day · National avg: 4m per day
Weekend RN Info Registered nurse hours specifically on weekends. Facilities sometimes reduce RN presence on Saturdays and Sundays — a low weekend RN figure compared to weekday hours can indicate reduced clinical oversight when most administrative staff are absent. 19m per day ▼ 35% State avg: 29m per day · National avg: 29m per day

Capacity and availability

This home usually has availability

Lower occupancy than the Kansas average: 79.5%
Occupancy rate
63.3%
Avg. Length of Stay
28 days
Bed community size
222-bed community Rank #1 / 224Bed count — State benchmarkedThis home is ranked 1st out of 224 homes in Kansas. Shows this facility's certified or reported bed count compared to other Kansas facilities. Larger communities may offer more amenities, programs, and on-site services for residents and families.Rankings are based only on facilities in Kansas that report data for that category. Facilities without available data are excluded from the ranking.Click the rank badge to see the full State ranking.Click here to see the full State ranking.
A large-scale community that may provide a wide range of amenities, services, and structured programs.
Walk Score
Walk Score: 75 / 100 Rank #39 / 363Walk Score — State benchmarkedThis home is ranked 39th out of 363 homes in Kansas. Shows how walkable this facility's neighborhood is compared to the average Walk Score across Kansas facilities. Higher scores benefit residents, families, and staff.Rankings are based only on facilities in Kansas that report data for that category. Facilities without available data are excluded from the ranking.Click the rank badge to see the full State ranking.Click here to see the full State ranking.
Very walkable. Most errands can be accomplished on foot, and many essentials are within a short walk.

Contact Delmar Gardens of Lenexa

Staffing Data

Reporting period: October 1 – December 31, 2025 (Q4 2025). Source: CMS Payroll-Based Journal report.

Total staff 215
Employees 144
Contractors 71
Staff to resident ratio 1.42 : 1
36% fewer staff per resident than Kansas average
Kansas average ratio: 2.24 : 1 Kansas average ratio: 2.24 : 1See full Kansas ranking
Avg staff/day 89
Average shift 8.4 hours
9% better than Kansas average
Kansas average: 7.7 hours Kansas average shift: 7.7 hoursSee full Kansas ranking
Total staff hours (quarter) 68,719

Nursing staff breakdown

Q4 2025 · Oct 1 – Dec 31 More info This data comes from the CMS Payroll-Based Journal report covering October 1 – December 31, 2025.
Registered Nurse

Manages medical care and health needs.

RN Staff Info 17 total: 11 full-time employees and 6 contractors. 17
Average shift length Info Average shift length. Calculated as total hours divided by days worked and average staff per day. 8.8 hours
Licensed Practical Nurse

Assists with medical care and medications.

LPN Staff Info 31 total: 25 full-time employees and 6 contractors. 31
Average shift length Info Average shift length. Calculated as total hours divided by days worked and average staff per day. 8.4 hours
Certified Nursing Assistant

Helps with daily care and mobility.

CNA Staff Info 114 total: 84 full-time employees and 30 contractors. 114
Average shift length Info Average shift length. Calculated as total hours divided by days worked and average staff per day. 8.8 hours

Contractor staffing

Q4 2025 · Oct 1 – Dec 31 More info This data comes from the CMS Payroll-Based Journal report covering October 1 – December 31, 2025.

Total hours from contractors

7.7%

5,313 contractor hours this quarter

Certified Nursing Assistant: 30 Speech Language Pathologist: 7 Licensed Practical Nurse: 6 Registered Nurse: 6 Qualified Social Worker: 6 Respiratory Therapy Technician: 4 Physical Therapy Assistant: 4 Physical Therapy Aide: 4 Occupational Therapy Aide: 2 Medical Director: 1 Occupational Therapy Assistant: 1

Staff by category

Q4 2025 · Oct 1 – Dec 31 More info This data comes from the CMS Payroll-Based Journal report covering October 1 – December 31, 2025.
Certified Nursing Assistant843011437,92392100%8.8
Licensed Practical Nurse2563111,93892100%8.4
Registered Nurse116173,87892100%8.8
Medication Aide/Technician8083,46292100%8
Other Dietary Services Staff4041,80592100%7.8
Clinical Nurse Specialist3031,3177480%7.2
Qualified Social Worker0661,2866773%7
RN Director of Nursing2029588289%7.9
Mental Health Service Worker2029287278%7.5
Administrator3039116874%8.3
Respiratory Therapy Technician0449018087%6.7
Speech Language Pathologist0778777683%5.7
Physical Therapy Assistant0447417278%6.2
Dietitian1015726470%8.9
Physical Therapy Aide0444696672%6.2
Nurse Practitioner1014516166%7.4
Occupational Therapy Aide0222242325%8
Medical Director011561415%4
Occupational Therapy Assistant0112433%8
114 Certified Nursing Assistant
% of Days 100%
31 Licensed Practical Nurse
% of Days 100%
17 Registered Nurse
% of Days 100%
8 Medication Aide/Technician
% of Days 100%
4 Other Dietary Services Staff
% of Days 100%
3 Clinical Nurse Specialist
% of Days 80%
6 Qualified Social Worker
% of Days 73%
2 RN Director of Nursing
% of Days 89%
2 Mental Health Service Worker
% of Days 78%
3 Administrator
% of Days 74%
4 Respiratory Therapy Technician
% of Days 87%
7 Speech Language Pathologist
% of Days 83%
4 Physical Therapy Assistant
% of Days 78%
1 Dietitian
% of Days 70%
4 Physical Therapy Aide
% of Days 72%
1 Nurse Practitioner
% of Days 66%
2 Occupational Therapy Aide
% of Days 25%
1 Medical Director
% of Days 15%
1 Occupational Therapy Assistant
% of Days 3%

Penalties and fines

Federal penalties imposed by CMS for regulatory violations, including civil money penalties (fines) and denials of payment for new Medicare/Medicaid admissions.

Source: CMS Penalties Database

No penalties in the past 3 years

No civil money penalties or payment denials were reported in the last 3 years.

Quality of care over time

These measures show how residents usually do over time at this home, based on health outcomes and preventive care.

High-risk clinical events score Info A composite score based on pressure ulcers, falls with injury, weight loss, walking ability decline, and activities of daily living decline. 12.7
21% worse than Kansas average

Kansas average: 10.5

Functional decline score Info A composite score based on activities of daily living decline, walking ability decline, and incontinence. 24.5
18% worse than Kansas average

Kansas average: 20.7

Long-stay resident measures
Average Info CMS star rating based on long-stay quality measure performance. 5 stars = significantly above average, 1 star = significantly below average.
Need for Help with Daily Activities Increased Info Percent of long-stay residents whose need for help with daily activities has increased 22.6%
19% worse than Kansas average

Kansas average: 19.0%

Walking Ability Worsened Info Percent of long-stay residents whose ability to move independently worsened 27.7%
43% worse than Kansas average

Kansas average: 19.4%

Low Risk Residents with Bowel/Bladder Incontinence Info Percent of low risk long-stay residents who lose control of their bowels or bladder 23.1%
In line with Kansas average

Kansas average: 23.8%

Falls with Major Injury Info Percent of long-stay residents experiencing one or more falls with major injury 2.1%
51% better than Kansas average

Kansas average: 4.4%

High Risk Residents with Pressure Ulcers Info Percent of long-stay high risk residents with pressure ulcers 6.0%
30% worse than Kansas average

Kansas average: 4.6%

Urinary Tract Infection Info Percent of long-stay residents with a urinary tract infection 2.9%
8% better than Kansas average

Kansas average: 3.1%

Lost Too Much Weight Info Percent of long-stay residents who lose too much weight 5.1%
In line with Kansas average

Kansas average: 5.1%

Depressive Symptoms Info Percent of long-stay residents who have depressive symptoms 1.2%
78% better than Kansas average

Kansas average: 5.2%

Antipsychotic Use Info Percent of long-stay residents who received an antipsychotic medication 13.9%
18% better than Kansas average

Kansas average: 16.9%

Pneumococcal Vaccine Info Percent of long-stay residents assessed and appropriately given the pneumococcal vaccine 83.8%
9% worse than Kansas average

Kansas average: 91.9%

Influenza Vaccine Info Percent of long-stay residents assessed and appropriately given the seasonal influenza vaccine 85.0%
11% worse than Kansas average

Kansas average: 95.5%

Hospitalizations per 1,000 days Info Number of hospitalizations per 1,000 long-stay resident days. 3.33
81% worse than Kansas average

Kansas average: 1.84

ED visits per 1,000 days Info Number of outpatient emergency department visits per 1,000 long-stay resident days. 0.86
60% better than Kansas average

Kansas average: 2.16

Short-stay resident measures
Significantly below average Info CMS star rating based on short-stay quality measure performance. 5 stars = much above average, 1 star = much below average.
Pneumococcal Vaccine Info Percent of short-stay residents assessed and appropriately given the pneumococcal vaccine 85.1%
12% better than Kansas average

Kansas average: 75.6%

Antipsychotic medication increase Info Percent of short-stay residents who newly received an antipsychotic medication 2.0%
10% better than Kansas average

Kansas average: 2.2%

Influenza Vaccine Info Percent of short-stay residents assessed and appropriately given the seasonal influenza vaccine 42.4%
42% worse than Kansas average

Kansas average: 73.5%

Re-hospitalized after SNF stay Info Percentage of short-stay residents who were re-hospitalized after their nursing home admission. 37.7%
64% worse than Kansas average

Kansas average: 23.0%

Emergency department visits Info Percentage of short-stay residents who had an outpatient emergency department visit. 11.9%
In line with Kansas average

Kansas average: 11.7%

Falls with major injury Info Percentage of SNF residents who experience falls with major injury during their stay. 1.4%
86% worse than Kansas average

Kansas average: 0.8%

Ability to care for self at discharge Info Percentage of residents at or above expected ability to care for themselves at discharge. 45.2%
16% worse than Kansas average

Kansas average: 53.7%

Successful return to home or community Info Rate of successful return to home or community from a skilled nursing facility. 47.6%
6% worse than Kansas average

Kansas average: 50.6%

Breakdown by payment type

Medicare

19% of new residents, usually for short-term rehab.

Typical stay 26 days

Private pay

62% of new residents, often for short stays.

Typical stay 1 - 2 months

Medicaid

19% of new residents, often for long-term daily care.

Typical stay 10 - 11 months

Facility Characteristics

Source: CMS Long-Term Care Facility Characteristics (Data as of Jan 2026)

Total residents 151
Medicare
5
3.3% of residents
Medicaid
83
55% of residents
Private pay or other
63
41.7% of residents
Programs & Services
Residents Group

Residents meet regularly to discuss policies, care quality, and activities

Active Resident Council

Organized group of residents that meets regularly to discuss facility policies, quality of life, and activities.

Finances and operations

Based on CMS SNF Cost Report for fiscal year ending in 03/2024.

For-profit
Operated by a single business entity.
Net patient revenue Info Net patient revenue — what the home actually collects for resident care, after contractual allowances, bad debt and discounts are subtracted from its gross charges (CMS cost report, Worksheet G-3). It covers resident care only; money the home earns from other sources is shown separately as "Other income."
$14.7M
Net patient income Info Net patient income: net patient revenue minus the home's total operating expenses. A positive figure means it earns more from resident care than it spends to deliver it; a negative figure means the opposite. It excludes non-operating "other income."
-$366.2K
For-profit Operated by a single business entity.
Net patient revenue Info Net patient revenue — what the home actually collects for resident care, after contractual allowances, bad debt and discounts are subtracted from its gross charges (CMS cost report, Worksheet G-3). It covers resident care only; money the home earns from other sources is shown separately as "Other income."
$14.7M
Net patient income Info Net patient income: net patient revenue minus the home's total operating expenses. A positive figure means it earns more from resident care than it spends to deliver it; a negative figure means the opposite. It excludes non-operating "other income."
-$366.2K
Other income Info Money the home earns outside of resident care — such as investments, grants, rentals and other non-operating sources (CMS cost report, Worksheet G-3). It is tracked separately from net patient revenue: it is not part of that figure, and it is not included in net patient income.
$90.4K
Payroll costs Info Staff salaries plus wage-related costs — benefits such as payroll taxes, health insurance and retirement — from the home's own accounting records (CMS cost report, Worksheet A). Contract or agency labor is counted separately, under other operating costs.
$8.4M 57.3% of net patient revenue Info Payroll as a share of revenue: staff salaries and wage-related benefits divided by net patient revenue. A higher figure means more of each revenue dollar goes to staff pay.
Other operating costs Info Everything it costs to run the home apart from payroll — food, utilities, supplies, maintenance, contract labor and administration. Calculated as total operating expense minus payroll (staff salaries and wage-related benefits).
$6.6M
Total costs Info The home's total operating expense for the year — all the costs of running it, salaries included (CMS cost report, Worksheet G-3).
$15.1M

What does this home offer?

Housing options icon

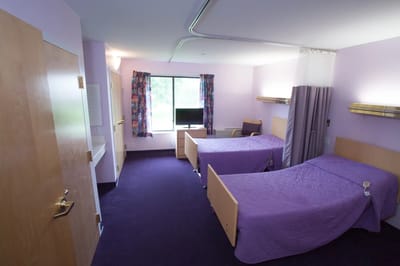
Housing Options: Private / Semi-Private Rooms

Building type icon
Building type icon

Building Type: Single-story

Beauty services icon

Beauty Services

Social and recreational activities icon

Social and Recreational Activities

On-site medical care and health services icon

On-site Medical Care and Health Services

Rehabilitative support icon

Rehabilitative Support

Who this home usually serves

TYPE OF STAY

Primarily short stays

Residents typically stay for brief periods, with frequent admissions and discharges throughout the year.

Most new residents arrive under private pay (62% of admissions), and a typical private pay stay runs around 1 - 2 months.

Admissions
543 total

Coverage residents most often arrive under.

Medicare 19%
Private pay 62%
Medicaid 19%
Discharges
530 total

Coverage residents most often leave under.

Medicare 19%
Private pay 50%
Medicaid 30%

Places of interest near Delmar Gardens of Lenexa

Address 0.7 miles from city center Info Estimated distance in miles from Lenexa's city center to Delmar Gardens of Lenexa's address, calculated via Google Maps.

Calculate Travel Distance to Delmar Gardens of Lenexa

Add your location

Address

Compare Nursing Homes around Lenexa

The information below is reported by the Kansas Department for Aging and Disability Services.

3 facilities compared · CMS & KS Dept. of Health data

Westchester Village of Lenexa
NH
AL
IL
Lenexa
34
Facility 34
KS AVG 69
Rank #217 / 224
90.9% +14%4.88 -9%+5%$0227.3-31-
70
Facility 70
KS AVG 46
Rank #57 / 363
Haley Nickles$8.4M$3.8M45.1%175536
Delmar Gardens of Lenexa
NH
AL
IL
MC
Lenexa (Monrovia Street)
222
Facility 222
KS AVG 69
Rank #1 / 224
63.3% -20%4.38 -22%-5%$0144.7-177-
75
Facility 75
KS AVG 46
Rank #39 / 363
Kathryn Allen$14.7M$8.4M57.3%175122
Lakeview Village
NH
AL
IL
Lenexa
184
Facility 184
KS AVG 69
Rank #3 / 224
69.6% -12%7.23 -23%+56%$35.6k184.52115A+
54
Facility 54
KS AVG 46
Rank #138 / 363
Lakeview Village, Inc$44.4M$29.7M66.9%175242

Financial Assistance for
Nursing Home in Kansas

Delmar Gardens of Lenexa is located in Lenexa, Kansas.
Here are the financial assistance programs available to residents in Kansas.

Get Financial aid guidance

Frail Elderly Waiver

Kansas Medicaid FE Waiver

Age 65+
General Kansas resident, Medicaid-eligible, nursing home- level care need.
Income Limits (2025) ~$2,829/month 300% FBR, individual
Asset Limits $2,000 (individual), $3,000 (couple).
KS

Requires care level assessment.

Benefits
Personal care (5-7 hours/day) Respite (240 hours/year) Adult day care (~$60/day) Home aides

Senior Care Act

Kansas SCA

Age 60+
General Kansas resident, at risk of nursing home.
Income Limits ~$1,800/month individual, varies
Asset Limits $2,000 individual
KS

Limited funding; waitlists common.

Benefits
In-home care (3-5 hours/week) Respite (up to 10 days/year) Homemaker services

Medicare Savings Program (MSP)

Kansas Medicare Savings Program

Age 65+ or disabled
General Kansas resident, Medicare Part A/B.
Income Limits (2025) ~$2,510/month (QMB), ~$3,380/month (SLMB), ~$3,598/month (QI)—individual.
Asset Limits $9,430 (individual), $14,130 (couple).
KS

Three tiers; no waitlist.

Benefits
Covers Part B premiums ($174.70/month) Deductibles ($240/year) Copays (~20%)

National Family Caregiver Support Program (NFCSP) Respite

Kansas NFCSP Respite Care

Age
General Caregivers of 60+ needing care or 55+ caregivers of others; Kansas resident; functional needs (2+ ADLs).
Income Limits (2025) Prioritizes ~$24,980/year (individual); no strict cap.
Asset Limits Not assessed; need-based.
KS

11 AAAs; prioritizes low-income, rural caregivers.

Benefits
Respite (4-6 hours/week or 5 days/year) Adult day care ($60/day) Caregiver training

VA Aid and Attendance (A&A) and Housebound Benefits

Kansas VA Aid and Attendance/Housebound

Age 65+ or disabled veteran/spouse
General Kansas resident, wartime service, need for ADL help (A&A) or homebound.
Income Limits (2025) Net income < ~$1,984/month (veteran with dependent, A&A); pension offsets income.
Asset Limits ~$155,356 net worth limit
KS

High veteran demand in rural/urban areas.

Benefits
Cash (~$1,433-$2,642/month veteran, ~$951-$1,318 spouse) for care costs (e.g., in-home, assisted living)

Frequently Asked Questions about Delmar Gardens of Lenexa

What neighborhood is Delmar Gardens of Lenexa in?

Delmar Gardens of Lenexa is in the Monrovia Street neighborhood.

Is Delmar Gardens of Lenexa in a walkable area?

Delmar Gardens of Lenexa has a walk score of 75. Very walkable. Most errands can be accomplished on foot, and many essentials are within a short walk.

What is the occupancy rate at Delmar Gardens of Lenexa?

Delmar Gardens of Lenexa's occupancy is 63.3%.

Does Delmar Gardens of Lenexa operate as a for-profit or non-profit?

Delmar Gardens of Lenexa is registered as a for-profit.

Are there photos of Delmar Gardens of Lenexa?

Yes — there are 7 photos of Delmar Gardens of Lenexa in the photo gallery on this page.

What is the address of Delmar Gardens of Lenexa?

Delmar Gardens of Lenexa is located at 9701 Monrovia, Lenexa, KS 66215.

What is the phone number of Delmar Gardens of Lenexa?

(913) 492-1130 will put you in contact with the team at Delmar Gardens of Lenexa.

Guides for Better Senior Living

Care Cost Calculator: See Prices in Your Area

Nursing Home Data Explorer

Don’t Wait Too Long: 7 Red Flag Signs Your Parent Needs Assisted Living Now

The True Cost of Assisted Living in 2025 – And How Families Are Paying For It

Understanding Senior Living Costs: Pricing Models, Discounts & Financial Assistance