Van Buren Healthcare and Rehabilitation Center
CMS overall rating Info CMS (the Centers for Medicare & Medicaid Services) is the federal agency that rates nursing home quality. Its Overall Rating runs from 1 to 5 stars, combining health inspections, staffing, and quality measures, with inspections weighted most heavily.

Van Buren Healthcare and Rehabilitation Center

CMS overall rating Info CMS (the Centers for Medicare & Medicaid Services) is the federal agency that rates nursing home quality. Its Overall Rating runs from 1 to 5 stars, combining health inspections, staffing, and quality measures, with inspections weighted most heavily.
Calculator: See prices in your area
Van Buren Healthcare and Rehabilitation Center accepts Medicare, Medicaid, and private pay.

Overview of Van Buren Healthcare and Rehabilitation Center

Robert Rye owns Van Buren Healthcare and Rehabilitation Center, a 140-bed facility on North 28th Street in Van Buren, Arkansas, which is operated by Wonder Boys Properties of Arkansas, LLC, and managed by administrator Cynthia McArthur. The building maintains an average length of stay of around 123 days, indicating that the daily workflow focuses largely on short-term rehab turnarounds alongside traditional long-term nursing care. Families planning out finances can pay for services through standard private funds, traditional Medicare, or state Medicaid.

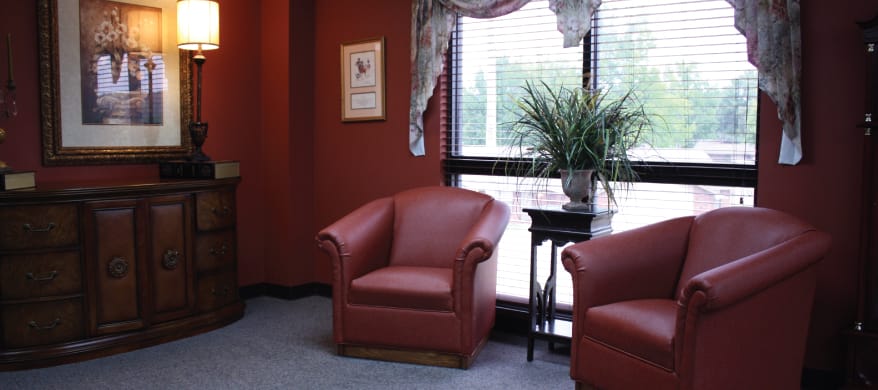
The on-site amenities include common rooms for socializing and a dining program that focuses on home-cooked meals. These features complement a 24-hour nursing team that delivers about 4 hours and 40 minutes of direct, hands-on attention to each resident daily, dividing their time between everyday clinical oversight and goal-oriented physical recovery programs. For visitors, the surrounding neighborhood has a walk score of 56, meaning you can easily take care of a few quick tasks on foot, though most trips across town will still require a car.

The latest reports pointed out specific compliance issues involving resident supervision, safety protocols, assessment documentation, food service infection control, building maintenance, and communication access, making the report a useful tool for evaluating their current quality control procedures.

Older adults can call the administrative department to find out which rooms are open or to walk through the general intake steps. During the call, you can also ask the management team to review their recent state health department survey results with you.

Quality ratings

Measured by Centers for Medicare & Medicaid Services (CMS)

Overall rating Info The Overall CMS Rating combines results from health inspections, staffing levels and quality measures. Health inspections carry the most weight. Staffing and quality scores can increase or decrease the final rating based on performance compared to state and national standards.
Health Inspection Info Based on the results of the facility's three most recent standard inspections and any complaint investigations. CMS reviews the number, scope, and severity of deficiencies, with more recent findings weighted more heavily.
Staffing Info Measures average nursing staff hours per resident per day, including Registered Nurses (RNs) and total nursing staff. Ratings are adjusted based on the level of care residents require and are compared to state and national benchmarks.
Quality Measures Info Based on clinical and physical health indicators reported to CMS, such as hospital readmissions, falls, pressure ulcers, and improvements in mobility. These measures reflect how well residents' health needs are being managed.

Staffing hours breakdown

Info Daily nursing hours per resident by staff type, reported to CMS. Higher is generally better — compare this facility to state and national averages to see where staffing stands.

Hours per resident per day — compared to state averages

Total nursing care / resident Info Total adjusted nursing hours per resident per day, combining RN, LPN, and aide time. CMS adjusts this for case-mix so facilities can be fairly compared.
4h 40m per day
vs avg

2 of 6 metrics below state avg

Standout metric Physical Therapist is +100% above state avg
Staff typeHours / Day / Residentvs state avg
Registered Nurse (RN) Info RNs hold the highest nursing license and can assess residents, interpret test results, and direct care plans. More RN hours per day often signals stronger clinical oversight and faster response to health changes. 12m per day ▼ 49% State avg: 24m per day · National avg: 41m per day
LPN / LVN Info Licensed Practical Nurses (LPNs) or Licensed Vocational Nurses (LVNs) deliver routine hands-on care — medication administration, wound dressing, and monitoring vital signs. They work under RN supervision and make up a large share of daily bedside care. 1h 6m per day ▲ 16% State avg: 57m per day · National avg: 52m per day
Nurse Aide Info Certified Nurse Aides (CNAs) provide the most direct day-to-day assistance: bathing, dressing, feeding, and mobility. Nurse aide hours are typically the largest staffing category and directly affect residents' quality of life. 2h 51m per day ▲ 5% State avg: 2h 43m per day · National avg: 2h 20m per day
Weekend Total Nursing Info Combined nursing hours (RN + LPN + Nurse Aide) per resident per day on weekends. Staffing often drops on weekends — this figure reveals whether the facility maintains adequate coverage outside of weekday hours. 3h 32m per day ■ Avg State avg: 3h 29m per day · National avg: 3h 26m per day
Physical Therapist Info Hours per resident per day provided by licensed Physical Therapists (PTs) or PT Assistants. PT services help residents recover mobility after injury or illness and are especially important for post-acute (short-stay) rehabilitation. 4m per day ▲ 100% State avg: 2m per day · National avg: 4m per day
Weekend RN Info Registered nurse hours specifically on weekends. Facilities sometimes reduce RN presence on Saturdays and Sundays — a low weekend RN figure compared to weekday hours can indicate reduced clinical oversight when most administrative staff are absent. 4m per day ▼ 73% State avg: 16m per day · National avg: 28m per day

Capacity and availability

Avg. Length of Stay
123 days
Bed community size
140-bed community Rank #17 / 330Bed count — State benchmarkedThis home is ranked 17th out of 330 homes in Arkansas. Shows this facility's certified or reported bed count compared to other Arkansas facilities. Larger communities may offer more amenities, programs, and on-site services for residents and families.Rankings are based only on facilities in Arkansas that report data for that category. Facilities without available data are excluded from the ranking.Click the rank badge to see the full State ranking.Click here to see the full State ranking.
A larger shared setting that may offer more common spaces and organized community services.
Walk Score
Walk Score: 56 / 100 Rank #73 / 419Walk Score — State benchmarkedThis home is ranked 73rd out of 419 homes in Arkansas. Shows how walkable this facility's neighborhood is compared to the average Walk Score across Arkansas facilities. Higher scores benefit residents, families, and staff.Rankings are based only on facilities in Arkansas that report data for that category. Facilities without available data are excluded from the ranking.Click the rank badge to see the full State ranking.Click here to see the full State ranking.
Moderately walkable. Some errands can be accomplished on foot, with a mix of nearby amenities.

About this community

License Details

Facility TypeSkilled Nursing Facility With Dual Certified Beds (medicaid/medicare)
CountyCrawford
CMS Certification Number045268
Certification TypeMedicaid / Medicare

Ownership & Operating Entity

Van Buren Healthcare and Rehabilitation Center is legally operated by Wonder Boys Properties of Arkansas, LLC, and administered by Cynthia Mcarthur.

Owner NameWonder Boys Properties Of Arkansas, LLC
Profit StatusFor-profit

Type Of Units

Medicaid and Medicare
140 units
Total beds
140 units

Therapy & Rehabilitation

1 service
Rehabilitation Services

Contact Information

Fax479-471-8570

Amenities & Lifestyle

Comfortable Places To Relax
Goal-Oriented Rehab Programs
Well-Balanced Home-Cooked Meals

Contact Van Buren Healthcare and Rehabilitation Center

Inspection History

In Arkansas, the Department of Human Services, Office of Long Term Care is authorized to conduct unannounced inspections and issue official quality of care reports for all senior living providers.

Since 2022 · 4 years of data 21 deficiencies

Inspection Scorecard Info This scorecard compares key inspection, deficiency, and complaint metrics at this facility against the Arkansas state average. Metrics rated ≥15% worse than average are highlighted in red; those ≥15% better are highlighted in green.

Since 2022 vs. Arkansas state average
Overall vs. AR average 0 Worse No metrics in this bucket. 2 At Avg Metrics at Arkansas average:
• Total deficiencies (at AR avg)
• Deficiencies per year (at AR avg)
0 Better No metrics in this bucket.
Latest Inspection September 19, 2024 Complaint Investigation

Deficiencies Info Deficiencies are formal regulatory issues recorded during state inspections.

This FacilityAR Averagevs. AR Avg
Total deficiencies Info Formal regulatory issues recorded by inspectors across all inspection types. 2121 This facility has total deficiencies in line with the Arkansas average (21 vs. AR avg 21).— At avg
Deficiencies per year Info Average deficiencies per year since 2022. 5.35.3 This facility has deficiencies per year in line with the Arkansas average (5.3 vs. AR avg 5.3).— At avg

Inspection Reports Summary Info An editor-reviewed summary of the themes and findings across this facility's recent inspection reports.

  • September 19, 2024 complaint inspection substantiated failure to supervise Resident #4, allowing access to open hand sanitizer despite known cognitive impairment risks.
  • July 14, 2023 annual inspection found 10 deficiencies including privacy breaches, inaccurate assessments, poor ADL care, food safety violations, and pest infestations in food and resident areas.
  • September 19, 2024 routine survey cited 2 deficiencies for not following fall care plans and failing to provide alternative communication methods for residents.

Health Inspection History

Inspections since 2022
Total health inspections 3

State average N/A


Last Health inspection on Sep 2024

Total health citations
20

State average N/A

Citations per inspection
6.67

State average N/A


Health citations are formal notices following inspections when they fail to comply with safety and care standards.

18 of 20 citations resulted from standard inspections; 1 of 20 resulted from complaint investigations; and 1 of 20 came from combined inspections (standard and complaint).

Breakdown of citation severity (last 4 years)
Critical health citations
0
In line with State average

State average: N/A


Serious health citations
0
In line with State average

State average: N/A

0 critical citations State average: N/A

0 serious citations State average: N/A

19 moderate citations State average: N/A

1 minor citation State average: N/A
Citations history (last 4 years)
Quality of Care moderate citation Sep 19, 2024
Corrected

Quality of Care moderate citation Sep 19, 2024
Corrected

Care Planning moderate citation Sep 19, 2024
Corrected

Environmental moderate citation Jul 14, 2023
Corrected

Staffing Data

Reporting period: October 1 – December 31, 2025 (Q4 2025). Source: CMS Payroll-Based Journal report.

Total staff 149
Employees 130
Contractors 19
Staff to resident ratio 1.48 : 1
0% compared with State average

State average ratio: 0 : 0

Avg staff/day 63
Average shift 8.5 hours
0% compared with State average

State average: 0 hours

Total staff hours (quarter) 48,986

Nursing staff breakdown

Q4 2025 · Oct 1 – Dec 31 More info This data comes from the CMS Payroll-Based Journal report covering October 1 – December 31, 2025.
Registered Nurse

Manages medical care and health needs.

RN Staff Info 7 total: 6 full-time employees and 1 contractor. 7
Average shift length Info Average shift length. Calculated as total hours divided by days worked and average staff per day. 8.4 hours
Licensed Practical Nurse

Assists with medical care and medications.

LPN Staff Info 29 total: 27 full-time employees and 2 contractors. 29
Average shift length Info Average shift length. Calculated as total hours divided by days worked and average staff per day. 8.4 hours
Certified Nursing Assistant

Helps with daily care and mobility.

CNA Staff Info 88 total: 85 full-time employees and 3 contractors. 88
Average shift length Info Average shift length. Calculated as total hours divided by days worked and average staff per day. 8.3 hours

Contractor staffing

Q4 2025 · Oct 1 – Dec 31 More info This data comes from the CMS Payroll-Based Journal report covering October 1 – December 31, 2025.

Total hours from contractors

7.6%

3,718 contractor hours this quarter

Speech Language Pathologist: 4 Certified Nursing Assistant: 3 Licensed Practical Nurse: 2 Physical Therapy Aide: 2 Respiratory Therapy Technician: 2 Qualified Social Worker: 1 Physical Therapy Assistant: 1 Registered Nurse: 1 Occupational Therapy Aide: 1 Medical Director: 1 Occupational Therapy Assistant: 1

Staff by category

Q4 2025 · Oct 1 – Dec 31 More info This data comes from the CMS Payroll-Based Journal report covering October 1 – December 31, 2025.
Certified Nursing Assistant8538828,74492100%8.3
Licensed Practical Nurse2722910,61492100%8.4
Registered Nurse6171,65292100%8.4
Medication Aide/Technician3031,2546368%10.8
Speech Language Pathologist0441,1126672%8.8
RN Director of Nursing3039916773%8.8
Physical Therapy Aide0227656368%11.8
Physical Therapy Assistant0117496672%11.3
Respiratory Therapy Technician0227016267%11.1
Mental Health Service Worker1016136470%9.6
Other Dietary Services Staff1015466368%8.7
Administrator1014806470%7.5
Nurse Practitioner1014806470%7.5
Qualified Social Worker0111316166%2.1
Occupational Therapy Aide011971516%6.5
Dietitian1012744%6.8
Occupational Therapy Assistant0112433%8
Medical Director011633%2
Nurse Aide in Training101211%1.8
88 Certified Nursing Assistant
% of Days 100%
29 Licensed Practical Nurse
% of Days 100%
7 Registered Nurse
% of Days 100%
3 Medication Aide/Technician
% of Days 68%
4 Speech Language Pathologist
% of Days 72%
3 RN Director of Nursing
% of Days 73%
2 Physical Therapy Aide
% of Days 68%
1 Physical Therapy Assistant
% of Days 72%
2 Respiratory Therapy Technician
% of Days 67%
1 Mental Health Service Worker
% of Days 70%
1 Other Dietary Services Staff
% of Days 68%
1 Administrator
% of Days 70%
1 Nurse Practitioner
% of Days 70%
1 Qualified Social Worker
% of Days 66%
1 Occupational Therapy Aide
% of Days 16%
1 Dietitian
% of Days 4%
1 Occupational Therapy Assistant
% of Days 3%
1 Medical Director
% of Days 3%
1 Nurse Aide in Training
% of Days 1%

Penalties and fines

Federal penalties imposed by CMS for regulatory violations, including civil money penalties (fines) and denials of payment for new Medicare/Medicaid admissions.

Source: CMS Penalties Database

No penalties in the past 3 years

No civil money penalties or payment denials were reported in the last 3 years.

Quality of care over time

These measures show how residents usually do over time at this home, based on health outcomes and preventive care.

High-risk clinical events score Info A composite score based on pressure ulcers, falls with injury, weight loss, walking ability decline, and activities of daily living decline. 4.6
40% better than State average

State average: 7.7

Functional decline score Info A composite score based on activities of daily living decline, walking ability decline, and incontinence. 5.7
58% better than State average

State average: 13.3

Long-stay resident measures
Above average State avg: 4.2 Info CMS star rating based on long-stay quality measure performance. 5 stars = significantly above average, 1 star = significantly below average.
Need for Help with Daily Activities Increased Info Percent of long-stay residents whose need for help with daily activities has increased 5.3%
54% better than State average

State average: 11.5%

Walking Ability Worsened Info Percent of long-stay residents whose ability to move independently worsened 6.9%
48% better than State average

State average: 13.4%

Low Risk Residents with Bowel/Bladder Incontinence Info Percent of low risk long-stay residents who lose control of their bowels or bladder 4.8%
69% better than State average

State average: 15.1%

Falls with Major Injury Info Percent of long-stay residents experiencing one or more falls with major injury 3.3%
17% better than State average

State average: 3.9%

High Risk Residents with Pressure Ulcers Info Percent of long-stay high risk residents with pressure ulcers 4.0%
17% better than State average

State average: 4.7%

Urinary Tract Infection Info Percent of long-stay residents with a urinary tract infection 2.3%
80% worse than State average

State average: 1.3%

Lost Too Much Weight Info Percent of long-stay residents who lose too much weight 3.7%
26% better than State average

State average: 5.0%

Depressive Symptoms Info Percent of long-stay residents who have depressive symptoms 15.9%
925% worse than State average

State average: 1.5%

Antipsychotic Use Info Percent of long-stay residents who received an antipsychotic medication 24.1%
131% worse than State average

State average: 10.5%

Pneumococcal Vaccine Info Percent of long-stay residents assessed and appropriately given the pneumococcal vaccine 99.8%
6% better than State average

State average: 94.4%

Influenza Vaccine Info Percent of long-stay residents assessed and appropriately given the seasonal influenza vaccine 100.0%
In line with State average

State average: 96.2%

Hospitalizations per 1,000 days Info Number of hospitalizations per 1,000 long-stay resident days. 1.91
In line with State average

State average: 1.97

ED visits per 1,000 days Info Number of outpatient emergency department visits per 1,000 long-stay resident days. 3.61
66% worse than State average

State average: 2.18

Short-stay resident measures
Significantly below average State avg: 2.7 Info CMS star rating based on short-stay quality measure performance. 5 stars = much above average, 1 star = much below average.
Pneumococcal Vaccine Info Percent of short-stay residents assessed and appropriately given the pneumococcal vaccine 93.4%
15% better than State average

State average: 80.9%

Antipsychotic medication increase Info Percent of short-stay residents who newly received an antipsychotic medication 3.4%
125% worse than State average

State average: 1.5%

Influenza Vaccine Info Percent of short-stay residents assessed and appropriately given the seasonal influenza vaccine 96.2%
24% better than State average

State average: 77.7%

Re-hospitalized after SNF stay Info Percentage of short-stay residents who were re-hospitalized after their nursing home admission. 29.3%
16% worse than State average

State average: 25.2%

Emergency department visits Info Percentage of short-stay residents who had an outpatient emergency department visit. 21.2%
54% worse than State average

State average: 13.8%

Falls with major injury Info Percentage of SNF residents who experience falls with major injury during their stay. 1.3%
66% worse than State average

State average: 0.8%

Ability to care for self at discharge Info Percentage of residents at or above expected ability to care for themselves at discharge. 57.7%
7% better than State average

State average: 53.7%

Successful return to home or community Info Rate of successful return to home or community from a skilled nursing facility. 52.8%
In line with State average

State average: 50.6%

Breakdown by payment type

Medicare

25% of new residents, usually for short-term rehab.

Typical stay 29 days

Private pay

48% of new residents, often for short stays.

Typical stay 1 - 2 months

Medicaid

27% of new residents, often for long-term daily care.

Typical stay 11 - 12 months

Facility Characteristics

Source: CMS Long-Term Care Facility Characteristics (Data as of Jan 2026)

Total residents 101
Medicare
4
4% of residents
Medicaid
81
80.2% of residents
Private pay or other
16
15.8% of residents
Programs & Services
Residents Group

Residents meet regularly to discuss policies, care quality, and activities

Nurse Aide Training

State-approved Nurse Aide Training and Competency Evaluation Program on-site

Active Resident Council

Organized group of residents that meets regularly to discuss facility policies, quality of life, and activities.

Finances and operations

Based on CMS SNF Cost Report for fiscal year ending in 06/2024.

For-profit
Operated by a single business entity.
Net patient revenue Info Net patient revenue — what the home actually collects for resident care, after contractual allowances, bad debt and discounts are subtracted from its gross charges (CMS cost report, Worksheet G-3). It covers resident care only; money the home earns from other sources is shown separately as "Other income."
$10.4M
Net patient income Info Net patient income: net patient revenue minus the home's total operating expenses. A positive figure means it earns more from resident care than it spends to deliver it; a negative figure means the opposite. It excludes non-operating "other income."
$1.3M
For-profit Operated by a single business entity.
Net patient revenue Info Net patient revenue — what the home actually collects for resident care, after contractual allowances, bad debt and discounts are subtracted from its gross charges (CMS cost report, Worksheet G-3). It covers resident care only; money the home earns from other sources is shown separately as "Other income."
$10.4M
Net patient income Info Net patient income: net patient revenue minus the home's total operating expenses. A positive figure means it earns more from resident care than it spends to deliver it; a negative figure means the opposite. It excludes non-operating "other income."
$1.3M
Other income Info Money the home earns outside of resident care — such as investments, grants, rentals and other non-operating sources (CMS cost report, Worksheet G-3). It is tracked separately from net patient revenue: it is not part of that figure, and it is not included in net patient income.
$6.3K
Payroll costs Info Staff salaries plus wage-related costs — benefits such as payroll taxes, health insurance and retirement — from the home's own accounting records (CMS cost report, Worksheet A). Contract or agency labor is counted separately, under other operating costs.
$4.7M 45.7% of net patient revenue Info Payroll as a share of revenue: staff salaries and wage-related benefits divided by net patient revenue. A higher figure means more of each revenue dollar goes to staff pay.
Other operating costs Info Everything it costs to run the home apart from payroll — food, utilities, supplies, maintenance, contract labor and administration. Calculated as total operating expense minus payroll (staff salaries and wage-related benefits).
$4.3M
Total costs Info The home's total operating expense for the year — all the costs of running it, salaries included (CMS cost report, Worksheet G-3).
$9.0M

Who this home usually serves

TYPE OF STAY

Mix of rehab and long-term care

This home supports both short-term rehab and long-term care, with residents staying for a wide range of durations.

New residents most often arrive under private pay (48% of admissions), and a typical private pay stay runs around 1 - 2 months.

Admissions
307 total

Coverage residents most often arrive under.

Medicare 25%
Private pay 48%
Medicaid 27%
Discharges
297 total

Coverage residents most often leave under.

Medicare 17%
Private pay 47%
Medicaid 36%

Places of interest near Van Buren Healthcare and Rehabilitation Center

Address 0.0 miles from city center Info Estimated distance in miles from Van Buren's city center to Van Buren Healthcare and Rehabilitation Center's address, calculated via Google Maps.

Calculate Travel Distance to Van Buren Healthcare and Rehabilitation Center

Add your location

Address

Compare Nursing Homes around the area

The information below is reported by the Arkansas Department of Human Services, Office of Long Term Care.

Van Buren Healthcare and Rehabilitation Center
NH
Van Buren -140 - 56 -
Butterfield Trail Village
NH
AL
IL
Fayetteville (East Joyce Boulevard) -87 A+ 39 Studio / 1 Bed / 2 Bed
Barnes Healthcare
NH
MC
Lonoke -141 A+ 38 Private / Shared Rooms
The Green House Cottages of Poplar Grove
NH
HC
MC
RC
Little Rock (Leander) -120 A+ 31 Private Rooms / Semi-Private Rooms
Timberlane Health & Rehab
NH
MC
RC
El Dorado -106 A+ 33 -

Frequently Asked Questions about Van Buren Healthcare and Rehabilitation Center

Who is the owner of Van Buren Healthcare and Rehabilitation Center?

Van Buren Healthcare and Rehabilitation Center is legally operated by Wonder Boys Properties of Arkansas, LLC, and administered by Cynthia McArthur.

Is Van Buren Healthcare and Rehabilitation Center in a walkable area?

Van Buren Healthcare and Rehabilitation Center has a walk score of 56. Moderately walkable. Some errands can be accomplished on foot, with a mix of nearby amenities.

What is the occupancy rate at Van Buren Healthcare and Rehabilitation Center?

Van Buren Healthcare and Rehabilitation Center's occupancy is 710.2%.

Does Van Buren Healthcare and Rehabilitation Center operate as a for-profit or non-profit?

Van Buren Healthcare and Rehabilitation Center is registered as a for-profit in AR.

Who is the administrator of Van Buren Healthcare and Rehabilitation Center?

Cynthia McArthur is the administrator of Van Buren Healthcare and Rehabilitation Center.

How many beds does Van Buren Healthcare and Rehabilitation Center have?

Van Buren Healthcare and Rehabilitation Center has 140 beds.

Are there photos of Van Buren Healthcare and Rehabilitation Center?

Yes — there are 2 photos of Van Buren Healthcare and Rehabilitation Center in the photo gallery on this page.

Guides for Better Senior Living

Care Cost Calculator: See Prices in Your Area

Nursing Home Data Explorer

Don’t Wait Too Long: 7 Red Flag Signs Your Parent Needs Assisted Living Now

The True Cost of Assisted Living in 2025 – And How Families Are Paying For It

Understanding Senior Living Costs: Pricing Models, Discounts & Financial Assistance