Belle View Estates Rehabilitation and Care Center
Nursing Home & Respite Care · Monticello, AR
CMS overall rating Info CMS (the Centers for Medicare & Medicaid Services) is the federal agency that rates nursing home quality. Its Overall Rating runs from 1 to 5 stars, combining health inspections, staffing, and quality measures, with inspections weighted most heavily.

Belle View Estates Rehabilitation and Care Center

Nursing Home & Respite Care · Monticello, AR
CMS overall rating Info CMS (the Centers for Medicare & Medicaid Services) is the federal agency that rates nursing home quality. Its Overall Rating runs from 1 to 5 stars, combining health inspections, staffing, and quality measures, with inspections weighted most heavily.
Calculator: See prices in your area
Belle View Estates Rehabilitation and Care Center accepts Medicaid, Medicare, and private pay.

Overview of Belle View Estates Rehabilitation and Care Center

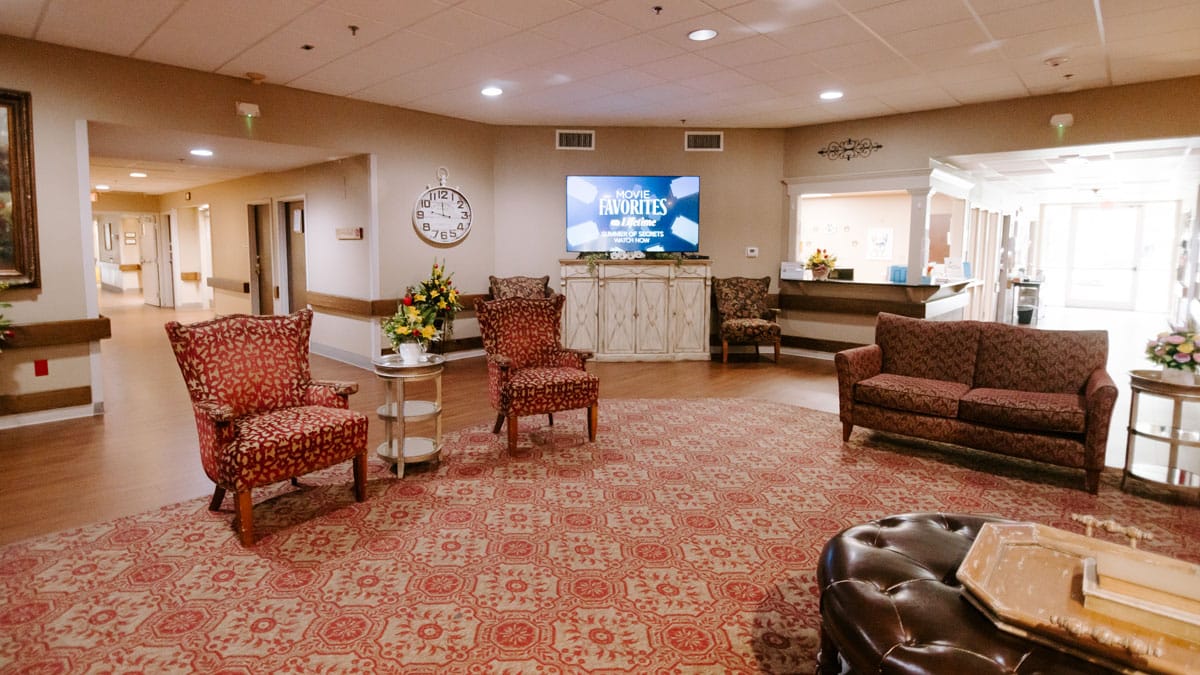
Drew SNF Operations, LLC runs Belle View Estates Rehabilitation and Care Center, an 80-bed care home on Old Warren Road in Monticello, Arkansas, where Julie Trucks serves as the administrator. The building keeps a stable population at roughly 78 percent occupancy, and stays average around 107 days. This timeline shows that the daily routine balances short-term therapy recovery with permanent residential care. To cover the costs of a stay, the front office processes traditional Medicare, state Medicaid, and regular private pay.

An on-staff physician coordinates clinical care alongside a 24-hour nursing team that logs about 3 hours and 53 minutes of direct, hands-on attention per resident daily. This crew handles daily medical routines and short-term physical rehabilitation right inside the building. The neighborhood carries a 56 walk score, so while family members will mostly want a car to get around town, it is possible to tackle a few quick errands on foot during a visit.

Past surveys identified specific operational and compliance issues, but the records show the management team successfully addressed and resolved those concerns. Reviewing these corrections with the staff is a good way to see how they maintain safety standards before you ask about current room choices or the steps needed for admission.

Families researching local care options can go over the building’s recent state inspection reports with the administrative team to see how they handle quality control.

Quality ratings

Measured by Centers for Medicare & Medicaid Services (CMS)

Overall rating Info The Overall CMS Rating combines results from health inspections, staffing levels and quality measures. Health inspections carry the most weight. Staffing and quality scores can increase or decrease the final rating based on performance compared to state and national standards.
Health Inspection Info Based on the results of the facility's three most recent standard inspections and any complaint investigations. CMS reviews the number, scope, and severity of deficiencies, with more recent findings weighted more heavily.
Staffing Info Measures average nursing staff hours per resident per day, including Registered Nurses (RNs) and total nursing staff. Ratings are adjusted based on the level of care residents require and are compared to state and national benchmarks.
Quality Measures Info Based on clinical and physical health indicators reported to CMS, such as hospital readmissions, falls, pressure ulcers, and improvements in mobility. These measures reflect how well residents' health needs are being managed.

Staffing hours breakdown

Info Daily nursing hours per resident by staff type, reported to CMS. Higher is generally better — compare this facility to state and national averages to see where staffing stands.

Hours per resident per day — compared to state averages

Total nursing care / resident Info Total adjusted nursing hours per resident per day, combining RN, LPN, and aide time. CMS adjusts this for case-mix so facilities can be fairly compared.
3h 53m per day
vs avg

4 of 6 metrics below state avg

Standout metric Physical Therapist is +101% above state avg
Staff typeHours / Day / Residentvs state avg
Registered Nurse (RN) Info RNs hold the highest nursing license and can assess residents, interpret test results, and direct care plans. More RN hours per day often signals stronger clinical oversight and faster response to health changes. 13m per day ▼ 44% State avg: 24m per day · National avg: 41m per day
LPN / LVN Info Licensed Practical Nurses (LPNs) or Licensed Vocational Nurses (LVNs) deliver routine hands-on care — medication administration, wound dressing, and monitoring vital signs. They work under RN supervision and make up a large share of daily bedside care. 1h 17m per day ▲ 35% State avg: 57m per day · National avg: 52m per day
Nurse Aide Info Certified Nurse Aides (CNAs) provide the most direct day-to-day assistance: bathing, dressing, feeding, and mobility. Nurse aide hours are typically the largest staffing category and directly affect residents' quality of life. 2h 12m per day ▼ 19% State avg: 2h 43m per day · National avg: 2h 20m per day
Weekend Total Nursing Info Combined nursing hours (RN + LPN + Nurse Aide) per resident per day on weekends. Staffing often drops on weekends — this figure reveals whether the facility maintains adequate coverage outside of weekday hours. 3h 20m per day ▼ 4% State avg: 3h 29m per day · National avg: 3h 26m per day
Physical Therapist Info Hours per resident per day provided by licensed Physical Therapists (PTs) or PT Assistants. PT services help residents recover mobility after injury or illness and are especially important for post-acute (short-stay) rehabilitation. 4m per day ▲ 101% State avg: 2m per day · National avg: 4m per day
Weekend RN Info Registered nurse hours specifically on weekends. Facilities sometimes reduce RN presence on Saturdays and Sundays — a low weekend RN figure compared to weekday hours can indicate reduced clinical oversight when most administrative staff are absent. 7m per day ▼ 57% State avg: 16m per day · National avg: 28m per day

Capacity and availability

Avg. Length of Stay
107 days
Bed community size
80-bed community Rank #186 / 330Bed count — State benchmarkedThis home is ranked 186th out of 330 homes in Arkansas. Shows this facility's certified or reported bed count compared to other Arkansas facilities. Larger communities may offer more amenities, programs, and on-site services for residents and families.Rankings are based only on facilities in Arkansas that report data for that category. Facilities without available data are excluded from the ranking.Click the rank badge to see the full State ranking.Click here to see the full State ranking.
A larger shared setting that may offer more common spaces and organized community services.
Walk Score
Walk Score: 56 / 100 Rank #73 / 419Walk Score — State benchmarkedThis home is ranked 73rd out of 419 homes in Arkansas. Shows how walkable this facility's neighborhood is compared to the average Walk Score across Arkansas facilities. Higher scores benefit residents, families, and staff.Rankings are based only on facilities in Arkansas that report data for that category. Facilities without available data are excluded from the ranking.Click the rank badge to see the full State ranking.Click here to see the full State ranking.
Moderately walkable. Some errands can be accomplished on foot, with a mix of nearby amenities.

About this community

Occupancy

Occupancy rate
78%
Higher than the Arkansas average: 71.3%
Occupied beds
63 / 80
Average occupied beds in Arkansas homes 77 beds

License Details

Facility TypeSkilled Nursing Facility With Dual Certified Beds (medicaid/medicare)
CountyDrew
CMS Certification Number045239
Certification TypeMedicaid / Medicare

Ownership & Operating Entity

Belle View Estates Rehabilitation and Care Center is legally operated by Drew SNF Operations, LLC, and administered by Julie Trucks.

Owner NameDr. Ew Snf Operations, LLC
Profit StatusFor-profit

Type Of Units

Medicaid and Medicare
80 units
Total beds
80 units

Payment & Insurance

1 service
Accept Medicaid

Therapy & Rehabilitation

1 service
Rehabilitation Services

Staffing & Medical

2 services
Doctor on Staff
24-Hour Staffing

Contact Information

Fax870-367-0020

Contact Belle View Estates Rehabilitation and Care Center

Inspection History

In Arkansas, the Department of Human Services, Office of Long Term Care is authorized to conduct unannounced inspections and issue official quality of care reports for all senior living providers.

Since 2023 · 3 years of data 16 deficiencies

Inspection Scorecard Info This scorecard compares key inspection, deficiency, and complaint metrics at this facility against the Arkansas state average. Metrics rated ≥15% worse than average are highlighted in red; those ≥15% better are highlighted in green.

Since 2023 vs. Arkansas state average
Overall vs. AR average 0 Worse No metrics in this bucket. 2 Better Metrics better than Arkansas average:
• Total deficiencies (24% below)
• Deficiencies per year (24% below)
Latest Inspection June 5, 2025 Annual Inspection

Deficiencies Info Deficiencies are formal regulatory issues recorded during state inspections.

This FacilityAR Averagevs. AR Avg
Total deficiencies Info Formal regulatory issues recorded by inspectors across all inspection types. 1621 This facility has 24% fewer total deficiencies than a typical Arkansas assisted living residence (16 vs. AR avg 21).↓ 24% better
Deficiencies per year Info Average deficiencies per year since 2023. 5.37 This facility has 24% fewer deficiencies per year than a typical Arkansas assisted living residence (5.3 vs. AR avg 7).↓ 24% better

Inspection Reports Summary Info An editor-reviewed summary of the themes and findings across this facility's recent inspection reports.

  • March 14, 2024 inspection found seven deficiencies including medication errors, poor food safety, hygiene lapses, unsecured narcotics, and inconsistent antibiotic stewardship.
  • September 25, 2023 complaint investigation confirmed a resident suffered head and spinal injury due to failure to secure wheelchair during transport.
  • June 5, 2025 annual inspection found no deficiencies and no complaints, showing correction of prior issues.

Health Inspection History

Inspections since 2023
Total health inspections 3

State average N/A


Last Health inspection on Mar 2024

Total health citations
17

State average N/A

Citations per inspection
5.67

State average N/A


Health citations are formal notices following inspections when they fail to comply with safety and care standards.

16 of 17 citations resulted from standard inspections; and 1 of 17 resulted from complaint investigations.

Breakdown of citation severity (last 3 years)
Critical health citations
0
In line with State average

State average: N/A


Serious health citations
1
In line with State average

State average: N/A

0 critical citations State average: N/A

1 serious citation State average: N/A

16 moderate citations State average: N/A

0 minor citations State average: N/A
Citations history (last 3 years)
Infection Control moderate citation Mar 14, 2024
Corrected

Infection Control moderate citation Mar 14, 2024
Corrected

Nutrition moderate citation Mar 14, 2024
Corrected

Pharmacy moderate citation Mar 14, 2024
Corrected

Staffing Data

Reporting period: October 1 – December 31, 2025 (Q4 2025). Source: CMS Payroll-Based Journal report.

Total staff 86
Employees 74
Contractors 12
Staff to resident ratio 1.25 : 1
0% compared with State average

State average ratio: 0 : 0

Avg staff/day 38
Average shift 7.8 hours
0% compared with State average

State average: 0 hours

Total staff hours (quarter) 27,347

Nursing staff breakdown

Q4 2025 · Oct 1 – Dec 31 More info This data comes from the CMS Payroll-Based Journal report covering October 1 – December 31, 2025.
Registered Nurse

Manages medical care and health needs.

RN Staff Info No RN Staff reported this quarter. 0
Average shift length Info Average shift length. Calculated as total hours divided by days worked and average staff per day.
Licensed Practical Nurse

Assists with medical care and medications.

LPN Staff Info All 17 LPN Staff are full-time employees. No contractors work on this role. 17
Average shift length Info Average shift length. Calculated as total hours divided by days worked and average staff per day. 9.2 hours
Certified Nursing Assistant

Helps with daily care and mobility.

CNA Staff Info All 38 CNA Staff are full-time employees. No contractors work on this role. 38
Average shift length Info Average shift length. Calculated as total hours divided by days worked and average staff per day. 7.6 hours

Contractor staffing

Q4 2025 · Oct 1 – Dec 31 More info This data comes from the CMS Payroll-Based Journal report covering October 1 – December 31, 2025.

Total hours from contractors

8.7%

2,375 contractor hours this quarter

Speech Language Pathologist: 3 Qualified Social Worker: 2 Clinical Nurse Specialist: 1 Respiratory Therapy Technician: 1 Physical Therapy Assistant: 1 Physical Therapy Aide: 1 Occupational Therapy Assistant: 1 Medical Director: 1 Occupational Therapy Aide: 1

Staff by category

Q4 2025 · Oct 1 – Dec 31 More info This data comes from the CMS Payroll-Based Journal report covering October 1 – December 31, 2025.
Certified Nursing Assistant3803813,90092100%7.6
Licensed Practical Nurse170177,04192100%9.2
RN Director of Nursing3031,3026470%7.5
Clinical Nurse Specialist6179339098%7.6
Nurse Practitioner4045286672%8
Dietitian1014725964%8
Administrator1014485661%8
Respiratory Therapy Technician0114366368%6.9
Physical Therapy Assistant0114356672%6.6
Physical Therapy Aide0114346065%7.2
Mental Health Service Worker1014165661%7.4
Nurse Aide in Training3034064347%6.2
Speech Language Pathologist0333925661%6.9
Qualified Social Worker0221746470%2.7
Occupational Therapy Aide0111733%5.6
Occupational Therapy Assistant01112910%1.3
Medical Director011333%1
38 Certified Nursing Assistant
% of Days 100%
17 Licensed Practical Nurse
% of Days 100%
3 RN Director of Nursing
% of Days 70%
7 Clinical Nurse Specialist
% of Days 98%
4 Nurse Practitioner
% of Days 72%
1 Dietitian
% of Days 64%
1 Administrator
% of Days 61%
1 Respiratory Therapy Technician
% of Days 68%
1 Physical Therapy Assistant
% of Days 72%
1 Physical Therapy Aide
% of Days 65%
1 Mental Health Service Worker
% of Days 61%
3 Nurse Aide in Training
% of Days 47%
3 Speech Language Pathologist
% of Days 61%
2 Qualified Social Worker
% of Days 70%
1 Occupational Therapy Aide
% of Days 3%
1 Occupational Therapy Assistant
% of Days 10%
1 Medical Director
% of Days 3%

Penalties and fines

Includes penalties issued in 2023

Federal penalties imposed by CMS for regulatory violations, including civil money penalties (fines) and denials of payment for new Medicare/Medicaid admissions.

Source: CMS Penalties Database (Data as of Jan 2026)

Total fines amount $7K
71% lower than State average

State average: $26K

Number of fines 1
32% fewer fines than State average

State average: 1.5

Payment Denials Info Serious action where Medicare and/or Medicaid temporarily stops payments for new residents until issues are fixed. 0
100% fewer payment denials than State average

State average: 0.2

Fines amount comparison
This facility $7K
State average $26K
Penalty History

Penalties are imposed by CMS for violations of federal nursing home regulations.

1 penalty in the past 3 years

Sep 25, 2023 · $7K

Civil Money Penalty Info Fines imposed for noncompliance, which can be assessed per day or per instance of violation. Sep 25, 2023
$7K

Last updated: Jan 2026

Quality of care over time

These measures show how residents usually do over time at this home, based on health outcomes and preventive care.

High-risk clinical events score Info A composite score based on pressure ulcers, falls with injury, weight loss, walking ability decline, and activities of daily living decline. 5.2
32% better than State average

State average: 7.7

Functional decline score Info A composite score based on activities of daily living decline, walking ability decline, and incontinence. 10.3
23% better than State average

State average: 13.3

Long-stay resident measures
Significantly above average State avg: 4.2 Info CMS star rating based on long-stay quality measure performance. 5 stars = significantly above average, 1 star = significantly below average.
Need for Help with Daily Activities Increased Info Percent of long-stay residents whose need for help with daily activities has increased 4.0%
65% better than State average

State average: 11.5%

Walking Ability Worsened Info Percent of long-stay residents whose ability to move independently worsened 8.9%
33% better than State average

State average: 13.4%

Low Risk Residents with Bowel/Bladder Incontinence Info Percent of low risk long-stay residents who lose control of their bowels or bladder 18.0%
19% worse than State average

State average: 15.1%

Falls with Major Injury Info Percent of long-stay residents experiencing one or more falls with major injury 3.7%
5% better than State average

State average: 3.9%

High Risk Residents with Pressure Ulcers Info Percent of long-stay high risk residents with pressure ulcers 5.3%
11% worse than State average

State average: 4.7%

Urinary Tract Infection Info Percent of long-stay residents with a urinary tract infection 0.0%
100% better than State average

State average: 1.3%

Lost Too Much Weight Info Percent of long-stay residents who lose too much weight 4.1%
18% better than State average

State average: 5.0%

Depressive Symptoms Info Percent of long-stay residents who have depressive symptoms 0.0%
100% better than State average

State average: 1.5%

Antipsychotic Use Info Percent of long-stay residents who received an antipsychotic medication 2.5%
76% better than State average

State average: 10.5%

Pneumococcal Vaccine Info Percent of long-stay residents assessed and appropriately given the pneumococcal vaccine 99.1%
5% better than State average

State average: 94.4%

Influenza Vaccine Info Percent of long-stay residents assessed and appropriately given the seasonal influenza vaccine 100.0%
In line with State average

State average: 96.2%

Short-stay resident measures
Significantly above average State avg: 2.7 Info CMS star rating based on short-stay quality measure performance. 5 stars = much above average, 1 star = much below average.
Pneumococcal Vaccine Info Percent of short-stay residents assessed and appropriately given the pneumococcal vaccine 83.7%
In line with State average

State average: 80.9%

Antipsychotic medication increase Info Percent of short-stay residents who newly received an antipsychotic medication 0.3%
78% better than State average

State average: 1.5%

Influenza Vaccine Info Percent of short-stay residents assessed and appropriately given the seasonal influenza vaccine 81.0%
In line with State average

State average: 77.7%

Re-hospitalized after SNF stay Info Percentage of short-stay residents who were re-hospitalized after their nursing home admission. 21.1%
16% better than State average

State average: 25.2%

Emergency department visits Info Percentage of short-stay residents who had an outpatient emergency department visit. 10.1%
27% better than State average

State average: 13.8%

Falls with major injury Info Percentage of SNF residents who experience falls with major injury during their stay. 1.7%
122% worse than State average

State average: 0.8%

Ability to care for self at discharge Info Percentage of residents at or above expected ability to care for themselves at discharge. 66.7%
24% better than State average

State average: 53.7%

Successful return to home or community Info Rate of successful return to home or community from a skilled nursing facility. 64.0%
27% better than State average

State average: 50.6%

Breakdown by payment type

Medicare

60% of new residents, usually for short-term rehab.

Typical stay 1 months

Private pay

38% of new residents, often for short stays.

Typical stay 1 - 2 months

Medicaid

2% of new residents, often for long-term daily care.

Typical stay 9 - 10 years

Facility Characteristics

Source: CMS Long-Term Care Facility Characteristics (Data as of Jan 2026)

Total residents 69
Medicare
10
14.5% of residents
Medicaid
45
65.2% of residents
Private pay or other
14
20.3% of residents
Programs & Services
Residents Group

Residents meet regularly to discuss policies, care quality, and activities

Active Resident Council

Organized group of residents that meets regularly to discuss facility policies, quality of life, and activities.

Finances and operations

Based on CMS SNF Cost Report for fiscal year ending in 12/2023.

For-profit
Operated by a single business entity.
Net patient revenue Info Net patient revenue — what the home actually collects for resident care, after contractual allowances, bad debt and discounts are subtracted from its gross charges (CMS cost report, Worksheet G-3). It covers resident care only; money the home earns from other sources is shown separately as "Other income."
$7.8M
Net patient income Info Net patient income: net patient revenue minus the home's total operating expenses. A positive figure means it earns more from resident care than it spends to deliver it; a negative figure means the opposite. It excludes non-operating "other income."
$857.5K
For-profit Operated by a single business entity.
Net patient revenue Info Net patient revenue — what the home actually collects for resident care, after contractual allowances, bad debt and discounts are subtracted from its gross charges (CMS cost report, Worksheet G-3). It covers resident care only; money the home earns from other sources is shown separately as "Other income."
$7.8M
Net patient income Info Net patient income: net patient revenue minus the home's total operating expenses. A positive figure means it earns more from resident care than it spends to deliver it; a negative figure means the opposite. It excludes non-operating "other income."
$857.5K
Other income Info Money the home earns outside of resident care — such as investments, grants, rentals and other non-operating sources (CMS cost report, Worksheet G-3). It is tracked separately from net patient revenue: it is not part of that figure, and it is not included in net patient income.
$293.8K
Payroll costs Info Staff salaries plus wage-related costs — benefits such as payroll taxes, health insurance and retirement — from the home's own accounting records (CMS cost report, Worksheet A). Contract or agency labor is counted separately, under other operating costs.
$3.3M 42.3% of net patient revenue Info Payroll as a share of revenue: staff salaries and wage-related benefits divided by net patient revenue. A higher figure means more of each revenue dollar goes to staff pay.
Other operating costs Info Everything it costs to run the home apart from payroll — food, utilities, supplies, maintenance, contract labor and administration. Calculated as total operating expense minus payroll (staff salaries and wage-related benefits).
$3.7M
Total costs Info The home's total operating expense for the year — all the costs of running it, salaries included (CMS cost report, Worksheet G-3).
$7.0M

Who this home usually serves

TYPE OF STAY

Mostly short-term rehab stays

Most residents typically stay for a few weeks or months before returning home or moving on.

Most new residents arrive under Medicare (60% of admissions), and a typical Medicare stay runs around 1 months.

Admissions
217 total

Coverage residents most often arrive under.

Medicare 60%
Private pay 38%
Medicaid 2%
Discharges
213 total

Coverage residents most often leave under.

Medicare 54%
Private pay 41%
Medicaid 5%

Places of interest near Belle View Estates Rehabilitation and Care Center

Address 0.0 miles from city center Info Estimated distance in miles from Monticello's city center to Belle View Estates Rehabilitation and Care Center's address, calculated via Google Maps.

Calculate Travel Distance to Belle View Estates Rehabilitation and Care Center

Add your location

Address

Compare Nursing Homes around the area

The information below is reported by the Arkansas Department of Human Services, Office of Long Term Care.

Belle View Estates Rehabilitation and Care Center
NH
RC
Monticello -80 - 56 -
Butterfield Trail Village
NH
AL
IL
Fayetteville (East Joyce Boulevard) -87 A+ 39 Studio / 1 Bed / 2 Bed
Barnes Healthcare
NH
MC
Lonoke -141 A+ 38 Private / Shared Rooms
The Green House Cottages of Poplar Grove
NH
HC
MC
RC
Little Rock (Leander) -120 A+ 31 Private Rooms / Semi-Private Rooms
Timberlane Health & Rehab
NH
MC
RC
El Dorado -106 A+ 33 -

Frequently Asked Questions about Belle View Estates Rehabilitation and Care Center

Who is the owner of Belle View Estates Rehabilitation and Care Center?

Belle View Estates Rehabilitation and Care Center is legally operated by Drew SNF Operations, LLC, and administered by Julie Trucks.

Is Belle View Estates Rehabilitation and Care Center in a walkable area?

Belle View Estates Rehabilitation and Care Center has a walk score of 56. Moderately walkable. Some errands can be accomplished on foot, with a mix of nearby amenities.

What is the occupancy rate at Belle View Estates Rehabilitation and Care Center?

Belle View Estates Rehabilitation and Care Center's occupancy is 78%.

Does Belle View Estates Rehabilitation and Care Center operate as a for-profit or non-profit?

Belle View Estates Rehabilitation and Care Center is registered as a for-profit in AR.

Who is the administrator of Belle View Estates Rehabilitation and Care Center?

Julie Trucks is the administrator of Belle View Estates Rehabilitation and Care Center.

How many beds does Belle View Estates Rehabilitation and Care Center have?

Belle View Estates Rehabilitation and Care Center has 80 beds.

Are there photos of Belle View Estates Rehabilitation and Care Center?

Yes — there are 3 photos of Belle View Estates Rehabilitation and Care Center in the photo gallery on this page.

Guides for Better Senior Living

Care Cost Calculator: See Prices in Your Area

Nursing Home Data Explorer

Don’t Wait Too Long: 7 Red Flag Signs Your Parent Needs Assisted Living Now

The True Cost of Assisted Living in 2025 – And How Families Are Paying For It

Understanding Senior Living Costs: Pricing Models, Discounts & Financial Assistance