Silver Oaks Health and Rehabilitation
Nursing Home, Memory Care & Respite Care · Camden, AR
CMS overall rating Info CMS (the Centers for Medicare & Medicaid Services) is the federal agency that rates nursing home quality. Its Overall Rating runs from 1 to 5 stars, combining health inspections, staffing, and quality measures, with inspections weighted most heavily.

Silver Oaks Health and Rehabilitation

Nursing Home, Memory Care & Respite Care · Camden, AR
CMS overall rating Info CMS (the Centers for Medicare & Medicaid Services) is the federal agency that rates nursing home quality. Its Overall Rating runs from 1 to 5 stars, combining health inspections, staffing, and quality measures, with inspections weighted most heavily.
Calculator: See prices in your area
Silver Oaks Health and Rehabilitation accepts Medicare, Medicaid, and private pay.

Overview of Silver Oaks Health and Rehabilitation

Silver Oaks Health and Rehabilitation has been operating on Old Wire Road in Camden, Arkansas for 16 years. Owned by Rhc Operations and run by OCNC, Inc., this 104-bed facility stays fairly busy with an 83 percent occupancy rate. Residents stay here for about 193 days on average, a timeline that shows the staff routinely balances short-term recovery setups with long-term residential placements. When it comes to the paperwork, the billing office processes payments through traditional Medicare, state Medicaid, and standard private funds.

Daily clinical needs are covered by a 24-hour nursing team that clocks an average of 4 hours and 36 minutes of hands-on attention per resident every day. This combined crew of registered nurses, practical nurses, and assistants handles physical, occupational, and speech therapy routines right on-site to help people bounce back after hospitalizations.

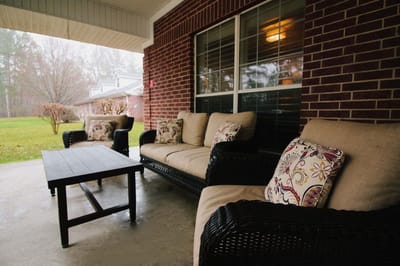
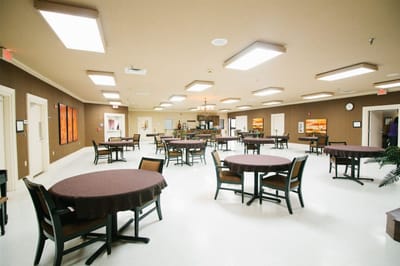
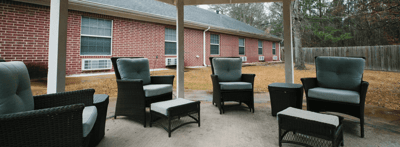
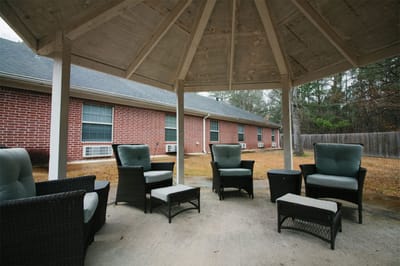
For daily life, the building features private rooms with showers, a communal dining room, and an outdoor courtyard with a gazebo. The kitchen crew serves up a mix of regional dishes like fried okra and biscuits alongside standard pasta and chicken, while the neighborhood’s walk score of 50 means visitors will generally want a car to get around town easily.

Prospective residents can call the intake department to check on room availability or to ask how the admissions process works. The front office can also walk you through their recent state inspection reports, which looked at resident care, infection control, medication management, food safety, and building upkeep, giving you a clear picture of how they handle daily compliance.

Quality ratings

Measured by Centers for Medicare & Medicaid Services (CMS)

Overall rating Info The Overall CMS Rating combines results from health inspections, staffing levels and quality measures. Health inspections carry the most weight. Staffing and quality scores can increase or decrease the final rating based on performance compared to state and national standards.
▲ 27.5% Above AR avg. ▲ 27.5% Above AR avg.AR average: 3.1Click the badge to see the full State ranking.Click here to see the full State ranking.
Health Inspection Info Based on the results of the facility's three most recent standard inspections and any complaint investigations. CMS reviews the number, scope, and severity of deficiencies, with more recent findings weighted more heavily.
▲ 3.8% Above AR avg. ▲ 3.8% Above AR avg.AR average: 2.9Click the badge to see the full State ranking.Click here to see the full State ranking.
Staffing Info Measures average nursing staff hours per resident per day, including Registered Nurses (RNs) and total nursing staff. Ratings are adjusted based on the level of care residents require and are compared to state and national benchmarks.
▼ 5.8% Below AR avg. ▼ 5.8% Below AR avg.AR average: 3.2Click the badge to see the full State ranking.Click here to see the full State ranking.
Quality Measures Info Based on clinical and physical health indicators reported to CMS, such as hospital readmissions, falls, pressure ulcers, and improvements in mobility. These measures reflect how well residents' health needs are being managed.
▲ 36.6% Above AR avg. ▲ 36.6% Above AR avg.AR average: 3.7Click the badge to see the full State ranking.Click here to see the full State ranking.

Staffing hours breakdown

Info Daily nursing hours per resident by staff type, reported to CMS. Higher is generally better — compare this facility to state and national averages to see where staffing stands.

Hours per resident per day — compared to Arkansas state averages

Total nursing care / resident Info Total adjusted nursing hours per resident per day, combining RN, LPN, and aide time. CMS adjusts this for case-mix so facilities can be fairly compared.
4h 36m per day
This facility Arkansas avg (4h 40m per day)
vs Arkansas avg
-2%

5 of 6 metrics below state avg

Staff typeHours / Day / Residentvs state avg
Registered Nurse (RN) Info RNs hold the highest nursing license and can assess residents, interpret test results, and direct care plans. More RN hours per day often signals stronger clinical oversight and faster response to health changes. 14m per day ▼ 40% State avg: 24m per day · National avg: 41m per day
LPN / LVN Info Licensed Practical Nurses (LPNs) or Licensed Vocational Nurses (LVNs) deliver routine hands-on care — medication administration, wound dressing, and monitoring vital signs. They work under RN supervision and make up a large share of daily bedside care. 58m per day ■ Avg State avg: 57m per day · National avg: 52m per day
Nurse Aide Info Certified Nurse Aides (CNAs) provide the most direct day-to-day assistance: bathing, dressing, feeding, and mobility. Nurse aide hours are typically the largest staffing category and directly affect residents' quality of life. 2h 35m per day ▼ 6% State avg: 2h 44m per day · National avg: 2h 21m per day
Weekend Total Nursing Info Combined nursing hours (RN + LPN + Nurse Aide) per resident per day on weekends. Staffing often drops on weekends — this figure reveals whether the facility maintains adequate coverage outside of weekday hours. 3h 15m per day ▼ 7% State avg: 3h 29m per day · National avg: 3h 26m per day
Physical Therapist Info Hours per resident per day provided by licensed Physical Therapists (PTs) or PT Assistants. PT services help residents recover mobility after injury or illness and are especially important for post-acute (short-stay) rehabilitation. 0m per day ▼ 83% State avg: 2m per day · National avg: 4m per day
Weekend RN Info Registered nurse hours specifically on weekends. Facilities sometimes reduce RN presence on Saturdays and Sundays — a low weekend RN figure compared to weekday hours can indicate reduced clinical oversight when most administrative staff are absent. 13m per day ▼ 17% State avg: 16m per day · National avg: 29m per day

Capacity and availability

Avg. Length of Stay
193 days
Bed community size
104-bed community Rank #119 / 330Bed count — State benchmarkedThis home is ranked 119th out of 330 homes in Arkansas. Shows this facility's certified or reported bed count compared to other Arkansas facilities. Larger communities may offer more amenities, programs, and on-site services for residents and families.Rankings are based only on facilities in Arkansas that report data for that category. Facilities without available data are excluded from the ranking.Click the rank badge to see the full State ranking.Click here to see the full State ranking.
A larger shared setting that may offer more common spaces and organized community services.
Years in operation
16 years in operation
A community with a solid operating history and experience delivering ongoing care.
Walk Score
Walk Score: 50 / 100 Rank #99 / 419Walk Score — State benchmarkedThis home is ranked 99th out of 419 homes in Arkansas. Shows how walkable this facility's neighborhood is compared to the average Walk Score across Arkansas facilities. Higher scores benefit residents, families, and staff.Rankings are based only on facilities in Arkansas that report data for that category. Facilities without available data are excluded from the ranking.Click the rank badge to see the full State ranking.Click here to see the full State ranking.
Moderately walkable. Some errands can be accomplished on foot, with a mix of nearby amenities.
BBB Rating
BBB Rating: A+ (Not Accredited)
An independent rating from the Better Business Bureau based on factors such as complaint history, transparency, and business practices.
How BBB ratings work

About this community

Occupancy

Occupancy rate
83%
Higher than the Arkansas average: 71.3%
Occupied beds
87 / 104
Average occupied beds in Arkansas homes 77 beds

License Details

Facility TypeSkilled Nursing Facility With Dual Certified Beds (medicaid / Medicare)
CountyOuachita
CMS Certification Number045173
Certification TypeMedicaid / Medicare

Ownership & Operating Entity

Silver Oaks Health and Rehabilitation is legally operated by OCNC, Inc., and administered by Stephen Mcguire.

Owner NameOcnc, Inc
Profit StatusFor-profit

Type Of Units

Medicaid and Medicare
104 units
Total beds
104 units

Staffing

Key information about the people who lead and staff this community.

Leadership

ContactMrs. Amy Rollins, Operations Coordinator

Therapy & Rehabilitation

2 services
Rehabilitation Services
Respite Care

Staffing & Medical

1 service
24-Hour Staffing

Contact Information

Fax870-836-8095

Amenities & Lifestyle

Private Rooms With Showers
Large Communal Dining Space
Dedicated Activity Area
Physical Therapy
Occupational Therapy
Speech Therapy
Outdoor Courtyard With Gazebo
Specialized Outdoor Therapy Equipment
Activities
Specific ProgramsShort-Term Rehab, Additional Services

Contact Silver Oaks Health and Rehabilitation

Inspection History

In Arkansas, the Department of Human Services, Office of Long Term Care is authorized to conduct unannounced inspections and issue official quality of care reports for all senior living providers.

Since 2023 · 3 years of data 38 deficiencies

Inspection Scorecard Info This scorecard compares key inspection, deficiency, and complaint metrics at this facility against the Arkansas state average. Metrics rated ≥15% worse than average are highlighted in red; those ≥15% better are highlighted in green.

Since 2023 vs. Arkansas state average
Overall vs. AR average 2 Worse Metrics worse than Arkansas average:
• Total deficiencies (81% above)
• Deficiencies per year (81% above)
0 Better No metrics in this bucket.
Latest Inspection June 5, 2025 Routine

Deficiencies Info Deficiencies are formal regulatory issues recorded during state inspections.

This FacilityAR Averagevs. AR Avg
Total deficiencies Info Formal regulatory issues recorded by inspectors across all inspection types. 3821 This facility has 81% more total deficiencies than a typical Arkansas nursing home (38 vs. AR avg 21).↑ 81% worse
Deficiencies per year Info Average deficiencies per year since 2023. 12.77 This facility has 81% more deficiencies per year than a typical Arkansas nursing home (12.7 vs. AR avg 7).↑ 81% worse

Inspection Reports Summary Info An editor-reviewed summary of the themes and findings across this facility's recent inspection reports.

  • June 5, 2025 inspection found 6 deficiencies including improper incontinence care, unsafe enteral feeding practices, inaccurate MDS assessments, and poor infection control with multiple hand hygiene lapses.
  • March 17, 2025 complaint investigation substantiated failure to provide timely incontinence care, leaving residents in urine-saturated bedding and chairs as confirmed by video and interviews.
  • April 18, 2024 routine survey cited 8 deficiencies involving resident dignity violations, expired medications, unsanitary environment, poor food safety, and inadequate infection prevention and wound care.

Health Inspection History

Inspections since 2023
Total health inspections 4

Arkansas average 4.2


Last Health inspection on Jun 2025

Total health citations
17

Arkansas average 21.8

Citations per inspection
4.25

Arkansas average 5.32


Health citations are formal notices following inspections when they fail to comply with safety and care standards.

15 of 17 citations resulted from standard inspections; 1 of 17 resulted from complaint investigations; and 1 of 17 came from combined inspections (standard and complaint).

Breakdown of citation severity (last 3 years)
Critical health citations
0
100% better than Arkansas average

Arkansas average: 0.4


Serious health citations
0
100% better than Arkansas average

Arkansas average: 0.2

0 critical citations Arkansas average: 0.4

0 serious citations Arkansas average: 0.2

17 moderate citations Arkansas average: 20.9

0 minor citations Arkansas average: 0.4
Citations history (last 3 years)
Infection Control moderate citation Jun 05, 2025
Corrected

Quality of Care moderate citation Jun 05, 2025
Corrected

Care Planning moderate citation Jun 05, 2025
Corrected

Quality of Care moderate citation Mar 18, 2025
Corrected

Staffing Data

Reporting period: October 1 – December 31, 2025 (Q4 2025). Source: CMS Payroll-Based Journal report.

Total staff 125
Employees 112
Contractors 13
Staff to resident ratio 1.42 : 1
11% fewer staff per resident than Arkansas average
Arkansas average ratio: 1.59 : 1 Arkansas average ratio: 1.59 : 1See full Arkansas ranking
Avg staff/day 48
Average shift 7.7 hours
0% compared with Arkansas average
Arkansas average: 8 hours Arkansas average shift: 8 hoursSee full Arkansas ranking
Total staff hours (quarter) 33,912

Nursing staff breakdown

Q4 2025 · Oct 1 – Dec 31 More info This data comes from the CMS Payroll-Based Journal report covering October 1 – December 31, 2025.
Registered Nurse

Manages medical care and health needs.

RN Staff Info All 6 RN Staff are full-time employees. No contractors work on this role. 6
Average shift length Info Average shift length. Calculated as total hours divided by days worked and average staff per day. 7.7 hours
Licensed Practical Nurse

Assists with medical care and medications.

LPN Staff Info All 19 LPN Staff are full-time employees. No contractors work on this role. 19
Average shift length Info Average shift length. Calculated as total hours divided by days worked and average staff per day. 9.3 hours
Certified Nursing Assistant

Helps with daily care and mobility.

CNA Staff Info All 72 CNA Staff are full-time employees. No contractors work on this role. 72
Average shift length Info Average shift length. Calculated as total hours divided by days worked and average staff per day. 7.6 hours

Contractor staffing

Q4 2025 · Oct 1 – Dec 31 More info This data comes from the CMS Payroll-Based Journal report covering October 1 – December 31, 2025.

Total hours from contractors

4.3%

1,467 contractor hours this quarter

Clinical Nurse Specialist: 4 Physical Therapy Assistant: 3 Speech Language Pathologist: 2 Respiratory Therapy Technician: 2 Physical Therapy Aide: 1 Qualified Social Worker: 1

Staff by category

Q4 2025 · Oct 1 – Dec 31 More info This data comes from the CMS Payroll-Based Journal report covering October 1 – December 31, 2025.
Certified Nursing Assistant7207220,77092100%7.6
Licensed Practical Nurse190195,84392100%9.3
RN Director of Nursing4042,0409199%7.5
Clinical Nurse Specialist4481,0488997%6.7
Speech Language Pathologist0227367076%5.6
Other Dietary Services Staff1016027177%8.5
Administrator1015286672%8
Nurse Practitioner1015286672%8
Mental Health Service Worker1015036368%8
Physical Therapy Aide0114416672%6.7
Registered Nurse6063904145%7.7
Nurse Aide in Training3032763134%7.5
Qualified Social Worker0111113841%2.9
Physical Therapy Assistant033532830%1.9
Respiratory Therapy Technician022442527%1.8
72 Certified Nursing Assistant
% of Days 100%
19 Licensed Practical Nurse
% of Days 100%
4 RN Director of Nursing
% of Days 99%
8 Clinical Nurse Specialist
% of Days 97%
2 Speech Language Pathologist
% of Days 76%
1 Other Dietary Services Staff
% of Days 77%
1 Administrator
% of Days 72%
1 Nurse Practitioner
% of Days 72%
1 Mental Health Service Worker
% of Days 68%
1 Physical Therapy Aide
% of Days 72%
6 Registered Nurse
% of Days 45%
3 Nurse Aide in Training
% of Days 34%
1 Qualified Social Worker
% of Days 41%
3 Physical Therapy Assistant
% of Days 30%
2 Respiratory Therapy Technician
% of Days 27%

Penalties and fines

Federal penalties imposed by CMS for regulatory violations, including civil money penalties (fines) and denials of payment for new Medicare/Medicaid admissions.

Source: CMS Penalties Database

No penalties in the past 3 years

No civil money penalties or payment denials were reported in the last 3 years.

Quality of care over time

These measures show how residents usually do over time at this home, based on health outcomes and preventive care.

High-risk clinical events score Info A composite score based on pressure ulcers, falls with injury, weight loss, walking ability decline, and activities of daily living decline. 6.9
10% better than Arkansas average

Arkansas average: 7.7

Functional decline score Info A composite score based on activities of daily living decline, walking ability decline, and incontinence. 13.5
In line with Arkansas average

Arkansas average: 13.3

Long-stay resident measures
Significantly above average Arkansas avg: 4.2 Info CMS star rating based on long-stay quality measure performance. 5 stars = significantly above average, 1 star = significantly below average.
Need for Help with Daily Activities Increased Info Percent of long-stay residents whose need for help with daily activities has increased 8.6%
25% better than Arkansas average

Arkansas average: 11.5%

Walking Ability Worsened Info Percent of long-stay residents whose ability to move independently worsened 14.4%
7% worse than Arkansas average

Arkansas average: 13.4%

Low Risk Residents with Bowel/Bladder Incontinence Info Percent of low risk long-stay residents who lose control of their bowels or bladder 17.4%
15% worse than Arkansas average

Arkansas average: 15.1%

Falls with Major Injury Info Percent of long-stay residents experiencing one or more falls with major injury 3.2%
17% better than Arkansas average

Arkansas average: 3.9%

High Risk Residents with Pressure Ulcers Info Percent of long-stay high risk residents with pressure ulcers 4.6%
In line with Arkansas average

Arkansas average: 4.7%

Urinary Tract Infection Info Percent of long-stay residents with a urinary tract infection 0.7%
49% better than Arkansas average

Arkansas average: 1.3%

Lost Too Much Weight Info Percent of long-stay residents who lose too much weight 3.8%
24% better than Arkansas average

Arkansas average: 5.0%

Depressive Symptoms Info Percent of long-stay residents who have depressive symptoms 0.0%
100% better than Arkansas average

Arkansas average: 1.5%

Antipsychotic Use Info Percent of long-stay residents who received an antipsychotic medication 7.8%
26% better than Arkansas average

Arkansas average: 10.5%

Pneumococcal Vaccine Info Percent of long-stay residents assessed and appropriately given the pneumococcal vaccine 87.1%
8% worse than Arkansas average

Arkansas average: 94.4%

Influenza Vaccine Info Percent of long-stay residents assessed and appropriately given the seasonal influenza vaccine 97.6%
In line with Arkansas average

Arkansas average: 96.2%

Hospitalizations per 1,000 days Info Number of hospitalizations per 1,000 long-stay resident days. 1.67
15% better than Arkansas average

Arkansas average: 1.97

ED visits per 1,000 days Info Number of outpatient emergency department visits per 1,000 long-stay resident days. 4.01
84% worse than Arkansas average

Arkansas average: 2.18

Short-stay resident measures
Significantly above average Arkansas avg: 2.7 Info CMS star rating based on short-stay quality measure performance. 5 stars = much above average, 1 star = much below average.
Pneumococcal Vaccine Info Percent of short-stay residents assessed and appropriately given the pneumococcal vaccine 71.9%
11% worse than Arkansas average

Arkansas average: 80.9%

Antipsychotic medication increase Info Percent of short-stay residents who newly received an antipsychotic medication 0.0%
100% better than Arkansas average

Arkansas average: 1.5%

Influenza Vaccine Info Percent of short-stay residents assessed and appropriately given the seasonal influenza vaccine 81.3%
5% better than Arkansas average

Arkansas average: 77.7%

Re-hospitalized after SNF stay Info Percentage of short-stay residents who were re-hospitalized after their nursing home admission. 13.9%
45% better than Arkansas average

Arkansas average: 25.2%

Emergency department visits Info Percentage of short-stay residents who had an outpatient emergency department visit. 21.3%
54% worse than Arkansas average

Arkansas average: 13.8%

Falls with major injury Info Percentage of SNF residents who experience falls with major injury during their stay. 0.0%
100% better than Arkansas average

Arkansas average: 0.8%

Ability to care for self at discharge Info Percentage of residents at or above expected ability to care for themselves at discharge. 50.0%
7% worse than Arkansas average

Arkansas average: 53.7%

Successful return to home or community Info Rate of successful return to home or community from a skilled nursing facility. 59.2%
17% better than Arkansas average

Arkansas average: 50.6%

Breakdown by payment type

Medicare

37% of new residents, usually for short-term rehab.

Typical stay 2 - 3 months

Private pay

56% of new residents, often for short stays.

Typical stay 1 - 2 months

Medicaid

7% of new residents, often for long-term daily care.

Typical stay 5 - 6 years

Facility Characteristics

Source: CMS Long-Term Care Facility Characteristics (Data as of Jan 2026)

Total residents 88
Medicare
11
12.5% of residents
Medicaid
63
71.6% of residents
Private pay or other
14
15.9% of residents
Programs & Services
Residents Group

Residents meet regularly to discuss policies, care quality, and activities

Active Resident Council

Organized group of residents that meets regularly to discuss facility policies, quality of life, and activities.

Finances and operations

Based on CMS SNF Cost Report for fiscal year ending in 12/2023.

For-profit
Corporation
Net patient revenue Info Net patient revenue — what the home actually collects for resident care, after contractual allowances, bad debt and discounts are subtracted from its gross charges (CMS cost report, Worksheet G-3). It covers resident care only; money the home earns from other sources is shown separately as "Other income."
$10.2M
Net patient income Info Net patient income: net patient revenue minus the home's total operating expenses. A positive figure means it earns more from resident care than it spends to deliver it; a negative figure means the opposite. It excludes non-operating "other income."
$1.3M
For-profit Corporation
Net patient revenue Info Net patient revenue — what the home actually collects for resident care, after contractual allowances, bad debt and discounts are subtracted from its gross charges (CMS cost report, Worksheet G-3). It covers resident care only; money the home earns from other sources is shown separately as "Other income."
$10.2M
Net patient income Info Net patient income: net patient revenue minus the home's total operating expenses. A positive figure means it earns more from resident care than it spends to deliver it; a negative figure means the opposite. It excludes non-operating "other income."
$1.3M
Other income Info Money the home earns outside of resident care — such as investments, grants, rentals and other non-operating sources (CMS cost report, Worksheet G-3). It is tracked separately from net patient revenue: it is not part of that figure, and it is not included in net patient income.
$15.4K
Payroll costs Info Staff salaries plus wage-related costs — benefits such as payroll taxes, health insurance and retirement — from the home's own accounting records (CMS cost report, Worksheet A). Contract or agency labor is counted separately, under other operating costs.
$4.2M 41.6% of net patient revenue Info Payroll as a share of revenue: staff salaries and wage-related benefits divided by net patient revenue. A higher figure means more of each revenue dollar goes to staff pay.
Other operating costs Info Everything it costs to run the home apart from payroll — food, utilities, supplies, maintenance, contract labor and administration. Calculated as total operating expense minus payroll (staff salaries and wage-related benefits).
$4.7M
Total costs Info The home's total operating expense for the year — all the costs of running it, salaries included (CMS cost report, Worksheet G-3).
$8.9M

Who this home usually serves

TYPE OF STAY

Mix of rehab and long-term care

This home supports both short-term rehab and long-term care, with residents staying for a wide range of durations.

Most new residents arrive under private pay (56% of admissions), and a typical private pay stay runs around 1 - 2 months.

Admissions
161 total

Coverage residents most often arrive under.

Medicare 37%
Private pay 56%
Medicaid 7%
Discharges
164 total

Coverage residents most often leave under.

Medicare 43%
Private pay 56%
Medicaid 1%

Places of interest near Silver Oaks Health and Rehabilitation

Address 0.0 miles from city center Info Estimated distance in miles from Camden's city center to Silver Oaks Health and Rehabilitation's address, calculated via Google Maps.

Calculate Travel Distance to Silver Oaks Health and Rehabilitation

Add your location

Address

Financial Assistance for
Nursing Home in Arkansas

Silver Oaks Health and Rehabilitation is located in Camden, Arkansas.
Here are the financial assistance programs available to residents in Arkansas.

Get Financial aid guidance

ARChoices

Arkansas Medicaid ARChoices

Age 65+ or 21+ with disability
General Arkansas resident, Medicaid- eligible, nursing home-level care need.
Income Limits (2025) ~$2,829/month 300% FBR, individual
Asset Limits $2,000 (individual), $3,000 (couple).
AR

Rural focus; possible waitlists.

Benefits
Personal care (5-7 hours/day) Meals ($7/meal) Respite care (240 hours/year) Adult day services ($60/day)

Choices in Living Resource Center

Arkansas Choices in Living

Age 60+
General Arkansas resident.
Income Limits No strict limit; prioritizes low-income.
Asset Limits Not applicable.
AR

Limited direct funding; mostly referral-based.

Benefits
Care coordination Limited respite (up to 5 days/year) Transportation assistance (~5 trips/month)

Living Choices Assisted Living Waiver

Arkansas Medicaid Living Choices Assisted Living Waiver

Age 65+
General Arkansas resident, requires nursing home-level care, lives in a Level II assisted living facility.
Income Limits (2025) ~$2,829/month 300% FBR, individual
Asset Limits $2,000 (individual), $3,000 (couple); spousal rules apply.
AR

Limited provider network; excludes Level I facilities (no nursing services).

Benefits
Personal care (~5 hours/day) Medication management Nursing Activities Transportation

Program of All-Inclusive Care for the Elderly (PACE)

Arkansas Medicaid PACE

Age 55+
General Arkansas resident, nursing home-level care, safe with PACE support.
Income Limits (2025) ~$2,829/month 300% FBR
Asset Limits $2,000 (individual), $3,000 (couple).
AR

Limited geographic availability.

Benefits
Primary/preventive care Personal care (5-7 hours/day) Meals Transportation Therapy

Arkansas State Plan Personal Care

Arkansas Medicaid Personal Care Program

Age
General Any age, Arkansas resident, needs ADL/IADL help, Medicaid-eligible.
Income Limits (2025) ~$1,004/month individual
Asset Limits $9,660 (individual), $14,470 (couple).
AR

No nursing home-level care requirement.

Benefits
Personal care (~4-6 hours/day) Homemaker services (e.g., meal prep)

Frequently Asked Questions about Silver Oaks Health and Rehabilitation

Who is the owner of Silver Oaks Health and Rehabilitation?

Silver Oaks Health and Rehabilitation is legally operated by OCNC, Inc., and administered by Stephen McGuire.

Is Silver Oaks Health and Rehabilitation in a walkable area?

Silver Oaks Health and Rehabilitation has a walk score of 50. Moderately walkable. Some errands can be accomplished on foot, with a mix of nearby amenities.

What is the occupancy rate at Silver Oaks Health and Rehabilitation?

Silver Oaks Health and Rehabilitation's occupancy is 83%.

Does Silver Oaks Health and Rehabilitation operate as a for-profit or non-profit?

Silver Oaks Health and Rehabilitation is registered as a for-profit in AR.

Who is the administrator of Silver Oaks Health and Rehabilitation?

Stephen McGuire is the administrator of Silver Oaks Health and Rehabilitation.

How many beds does Silver Oaks Health and Rehabilitation have?

Silver Oaks Health and Rehabilitation has 104 beds.

Are there photos of Silver Oaks Health and Rehabilitation?

Yes — there are 8 photos of Silver Oaks Health and Rehabilitation in the photo gallery on this page.

Guides for Better Senior Living

Care Cost Calculator: See Prices in Your Area

Nursing Home Data Explorer

Don’t Wait Too Long: 7 Red Flag Signs Your Parent Needs Assisted Living Now

The True Cost of Assisted Living in 2025 – And How Families Are Paying For It

Understanding Senior Living Costs: Pricing Models, Discounts & Financial Assistance